-
PDF
- Split View
-
Views
-
Cite
Cite
Katharina T. Huber, Bengt Oxelman, Martin Lott, Vincent Moulton, Reconstructing the Evolutionary History of Polyploids from Multilabeled Trees, Molecular Biology and Evolution, Volume 23, Issue 9, September 2006, Pages 1784–1791, https://doi.org/10.1093/molbev/msl045
Close - Share Icon Share
Abstract
In recent studies, phylogenetic networks have been derived from so-called multilabeled trees in order to understand the origins of certain polyploids. Although the trees used in these studies were constructed using sophisticated techniques in phylogenetic analysis, the presented networks were inferred using ad hoc arguments that cannot be easily extended to larger, more complicated examples. In this paper, we present a general method for constructing such networks, which takes as input a multilabeled phylogenetic tree and outputs a phylogenetic network with certain desirable properties. To illustrate the applicability of our method, we discuss its use in reconstructing the evolutionary history of plant allopolyploids. We conclude with a discussion concerning possible future directions. The network construction method has been implemented and is freely available for use from http://www.uea.ac.uk/∼a043878/padre.html.
Introduction
Polyploid species arise via genome doubling, a phenomenon that is assumed to have played a major role in the evolution of plants and to a lesser extent in the evolution of animals (e.g., Sexton 1979; Spring 1997; Otto and Whitton 2000; Adams and Wendel 2005). Historically, polyploid origins have often been inferred by studying morphological and cytological intermediacy and/or additivity between possible “parental species” candidates and then “confirmed” by experimentally deriving polyploid hybrids between the putative parents (as, e.g., in the classical studies on Galeopsis by Müntzing 1930, 1932). Although such studies have made major contributions to our understanding of polyploid origins, they are problematic in that there is no formal criterion to use for rejecting certain evolutionary hypotheses, and, more importantly, the historical dimension of polyploidy evolution is effectively ignored (i.e., the parental lineages as well as the polyploid derivate may have undergone significant changes since the hybridization event).
Several recent studies have begun to address these problems using contemporary techniques for analyzing molecular evolution. For example, in Popp and Oxelman (2001), Cronn et al. (2002), Smedmark et al. (2003), Doyle et al. (2004), Popp et al. (2005), and Smedmark et al. (2005), certain trees are constructed from which phylogenetic networks representing the evolutionary history of various plants are deduced, such as the one presented in figure 1c. Networks are employed because hybridization events by their very nature cannot be displayed by a tree (see, e.g., Martin 1999; Linder and Rieseberg 2004). Although the trees in these studies are based upon sophisticated techniques in phylogenetic analysis, the networks are inferred using ad hoc arguments, which cannot be easily extended to larger, more complicated examples. In this paper, we present a method for constructing networks from such trees in a more systematic fashion, which can be proven to produce networks having a minimal number of hybridization events.
(a) A phylogenetic network on the plant taxa Silene ajanensis s.l. (S.a), Silene sorensenis/ostenfeldii (S.s), Silene involucrata (S.i), and Silene uralensis (S.u) based on the network appearing in Popp et al. (2005). (b) A simplified version of a MUL tree that appeared in Popp et al. (2005). (c) The way in which the network in (a) (bold lines) exhibits the MUL tree in (b) (thin lines).
Methods
Multilabeled Trees and Phylogenetic Networks
In many phylogenetic studies, trees are used to model the evolutionary past of species. However, there is growing evidence that, at least for organisms such as plants, bacteria, and viruses, such a model is inappropriate because the evolution of these organisms involves reticulation events, which by their very nature cannot be properly represented by trees (Martin 1999; Linder and Rieseberg 2004). This has resulted in a plethora of network construction techniques (see, e.g., Posada and Crandall 2001; Huber and Moulton 2005; and Morrison 2005 for recent reviews).
Various definitions of phylogenetic networks have been presented in the literature. For convenience, we will follow the one presented in Huber and Moulton (2006), where we consider a phylogenetic network to be a rooted, directed graph without directed cycles, with leaves labeled by taxa (sometimes also called a “reticulate network”; Huson and Bryant 2006). In figure 1a, we illustrate such a network. Because all edges in the network are directed away from the root we suppress, in general, the edge directions in our figures. In particular, there are 3 types of nodes in a phylogenetic network: those at the end of 1 edge, which we call “tree nodes”; those at the end of at least 2 edges (representing “combination” events such as hybridization or lateral transfer), which we call “interaction nodes”; and the root node. In case all internal nodes have degree 3, we call the network “binary” (so the network in fig. 1a is binary). Note that we regard a phylogenetic tree as a phylogenetic network with no interaction nodes.
To any phylogenetic network we can associate a certain kind of tree. For example, in figure 1b, we present the tree that is exhibited by the phylogenetic network in figure 1a in a way that is illustrated in figure 1c. Note that this tree is not a phylogenetic tree in the usual sense (as defined in, e.g., Semple and Steel 2003) because some of its leaves are labeled by the same taxa. We call trees of this type “multilabeled (phylogenetic) trees” or “MUL trees” for short. Examples of MUL trees include gene or allele trees, where the labels are organismal or taxon names. A gene may be present in 2 variants (alleles) in a heterozygous diploid organism, and genes may duplicate within a genome, processes that lead to gene or allele trees that are not the same as organismal trees. Analogously, area cladograms (see Page and Lydeard 1994; van Veller et al. 2002) are trees where the organisms are replaced by area names, and tanglegrams are trees where parasites have been replaced by their host (Page 2003). Thus, MUL trees are potentially very common and may be derived from a great variety of biological processes.
Although a MUL tree can be associated to any phylogenetic network in a way similar to that indicated by figure 1, we are interested in the reverse problem. In other words, we will assume that we have produced a MUL tree (using, e.g., standard techniques in phylogenetic tree reconstruction from molecular data) and that we wish to recover a phylogenetic network from this tree.
In general, given any MUL tree, it is quite straightforward to find a binary phylogenetic network exhibiting this tree (Huber and Moulton 2006). For example, we can merge all the leaves labeled by the same organism into a single node and, for each such node, insert an extra edge, push the taxa label into the leaf, and—in case a binary network is required—resolve the node under consideration in case it is at the end of more than 2 edges. This process is illustrated in figure 2b and c for the MUL tree depicted in figure 2a. However, the phylogenetic network so obtained will probably not be a good representation of the events that have taken place in the evolutionary history of the given species. For example, the binary phylogenetic network in figure 2d also exhibits the MUL tree in figure 2a, and it has fewer interaction nodes that, at least on parsimonious grounds, could represent a more realistic evolutionary scenario. In the following, we will therefore present a method to construct a binary phylogenetic network exhibiting a given MUL tree that is guaranteed to have a minimal number of interaction nodes among all such networks.
A MUL tree 𝒯 (a), together with 3 phylogenetic networks (b), (c), and (d) that exhibit 𝒯.
Inextendible Subtrees of MUL Trees
Before presenting our construction, we introduce some useful concepts concerning MUL trees. A subtree of a MUL tree 𝒯 is any MUL tree that can be obtained from 𝒯 by taking the MUL tree lying below any node of 𝒯 that is not the root. In particular, note that every leaf of 𝒯 is considered to be a subtree of 𝒯. Two distinct subtrees of 𝒯 that are the same as MUL trees are called “equivalent.” For example, the MUL tree in figure 3a has subtrees
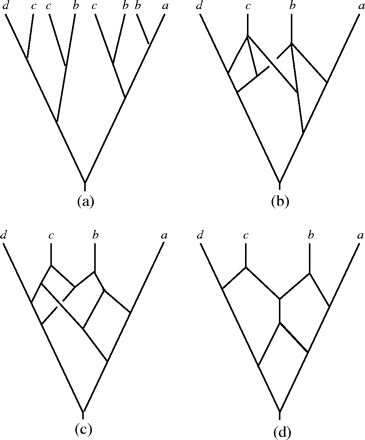
Constructing the network 𝒩(𝒯) for a MUL tree 𝒯. (a) A MUL tree 𝒯 with 3 equivalent maximal inextendible subtrees
An inextendible subtree 𝒯′ of 𝒯 is “maximal” inextendible if no subtree of 𝒯 that is equivalent to 𝒯′ is equivalent to a subtree of an inextendible subtree of 𝒯. Note that every subtree of 𝒯 that is equivalent to a maximal inextendible subtree of 𝒯 is also maximal inextendible. For example, in figure 3a, each subtree having leaves labeled with “b” and “c” is inextendible but none of these 4 trees is maximal inextendible because, for example,
Minimal Networks from MUL Trees
We now describe our method for inferring minimal phylogenetic networks from MUL trees.
Suppose that 𝒯 is a MUL tree. We assume that 𝒯 is not a phylogenetic tree in the usual sense (otherwise 𝒯 is a minimal network exhibiting 𝒯!), so that 𝒯 has at least 2 leaves labeled by the same organism. Therefore, 𝒯 must contain at least 1 maximal inextendible subtree 𝒯′. Let
Note that the resulting network exhibits 𝒯 and has fewer leaves than 𝒯. Within this network, we can define inextendible and maximal inextendible trees in a similar way as with MUL trees. In case the network still contains a maximal inextendible subtree, we repeat the above process for this network: find a collection of equivalent maximal inextendible subtrees and subdivide, identify, and prune. This is repeated until a network 𝒩(𝒯) is obtained that contains no maximal inextendible subtrees. Note that because we reduce the number of leaves at each step in this process, it will eventually terminate, and in the resulting network 𝒩(𝒯) no 2 leaves will be labeled by the same organism. We illustrate this whole process in figure 3a–c.
Note that the network 𝒩(𝒯) is not necessarily binary. However, if we resolve any nodes with a degree greater than 3 (e.g., see fig. 3d) using, for example, additional biological information, then we are guaranteed that such a resolution of 𝒩(𝒯) is minimal in view of the following result:
TheoremSuppose that 𝒯 is a MUL tree and that 𝒩 is a binary phylogenetic network exhibiting 𝒯 that has a minimal number of interaction nodes (or, equivalently, a minimal number of tree nodes) among all binary phylogenetic networks that exhibit 𝒯. Then 𝒩 is a resolution of 𝒩(𝒯).
The proof of this result is quite long and technical and may be found in Huber and Moulton (2006). It is also shown that, for any MUL tree 𝒯, the network 𝒩(𝒯) has a minimal number of nodes among all phylogenetic networks exhibiting 𝒯 but not necessarily a minimal number of interaction nodes.
An Efficient Algorithm for Computing 𝒩(𝒯)
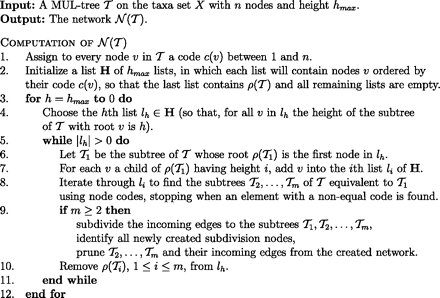
We now describe an efficient algorithm for computing the network 𝒩(𝒯) associated to any MUL tree 𝒯. The algorithm is presented in figure 4, and it works as follows:
An algorithm for computing the network 𝒩(𝒯), for any given MUL tree 𝒯.
Suppose that 𝒯 is a MUL tree on the set X of taxa with n nodes and height hmax. In Step 1, we assign a number in the range 1–n inclusive to each node v, called the code c(v) of v, which will allow us to efficiently determine whether subtrees of 𝒯 are equivalent or not. In particular, codes are assigned to nodes so that roots of subtrees of 𝒯 are assigned the same code if and only if the subtrees are equivalent. Essentially, this is done by arbitrarily ordering the set
In Step 2, we initialize a list H of hmax lists, so that the last list consists of the root ρ(𝒯) of 𝒯, and all remaining lists are empty. The hth list lh in H will be populated with nodes v of 𝒯 that are roots of height h subtrees of 𝒯 (ordered according to their codes). In Steps 3–12, we run through the elements of the list H in the order of decreasing height for processing. In particular, the next element lh from H is selected in Step 4, and, while the list lh is nonempty, we process it in the loop consisting of Steps 5–11.
The processing proceeds as follows. In Step 6, we pick the subtree 𝒯1 of height h in 𝒯, whose root is the first element in lh. Then, in Step 7, we add each child v of ρ(𝒯1) having height i (strictly less than h) into the ith list li of H for processing in subsequent iterations. In Step 8, we find the subtrees
The complexity of this algorithm is as follows. For each node in 𝒯, storage and retrieval using the trie data structure takes O(log n) time (Knuth 1997, p 492). Because there are n nodes in 𝒯, the complexity of Step 1 is thus O(n log n). Step 2 takes constant time. Steps 3 and 5 iterate through a subset of the nodes in 𝒯, and so they are performed O(n) times. Steps 4, 6, 8, 9, and 10 all take constant time, and Step 7 can be done in O(log n) time (the time required to identify the insertion position in the correct list lh in H) by implementing the lists in H as binary search trees (Knuth 1997, p 426ff.). It therefore follows that the overall complexity of the algorithm is O(n log n).
We have implemented a simpler version of this algorithm in the “Padre” software, which is freely available for use from http://www.uea.ac.uk/∼a043878/padre.html.
Plant Allopolyploidy
To illustrate the applicability of our method, we discuss its application to reconstructing the evolutionary history of plant allopolyploids, an extremely common class of plants.
Plant molecular phylogenetics has, to date, concentrated on plastid and nuclear ribosomal DNA sequences for reconstructing evolution. However, these regions are ill-suited for observing reticulate evolution because plastids are usually uniparentally inherited. In addition, the usage of nuclear ribosomal DNA is complicated by the presence of many paralogues, which are more or less similar due to the little understood process of concerted evolution (e.g., Álvarez and Wendel 2003). Low–copy number nuclear genes may provide the way out but are still far from being standardly used. However, it is expected that this will change when their potential is more widely understood (Small et al. 2004). We envisage that the availability of our method together with the use of multiple low–copy number nuclear genes will greatly improve the understanding of plant phylogenetics, as well as in other organismal groups where polyploidy occurs.
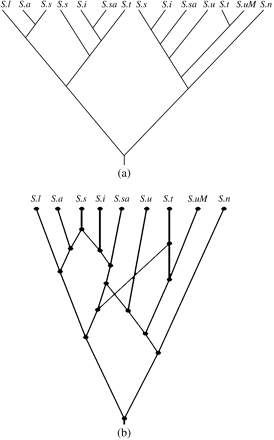
A case in point is provided in Popp et al. (2005), where these authors study the evolution in a group of Silene taxa using a data set on 5 putatively unlinked nuclear gene regions and 2 plastid regions. By and large, these regions indicate compatible gene phylogenies, and a simplified version of the MUL tree that was obtained by Popp et al. is depicted in figure 1b. The phylogenetic network depicted in figure 1a is the (unique) optimal network that is produced by our method for that tree. Recently, A Petri and B Oxelman (unpublished data) have added more taxa to this study which resulted in a possible binary MUL tree that is presented in figure 5a. Applying our method to this extended MUL tree yields the (unique) phylogenetic network pictured in figure 5b. Regarding the evolution of Silene, this network is interesting on several levels. First, it suggests that Silene tomachevii (S.t) and Silene sachalinensis (S.sa) are likely to be allotetraploids (their chromosome numbers are unknown). Second, it suggests that S.t has a maternal lineage (determined from chloroplast DNA trees, Popp et al. 2005; Petri and Oxelman, unpublished data) different from that of Silene involucrata (S.i) and S.sa. Last, but not the least, it hints at an ancestor of Silene linnaeana and Silene ajanensis (S.a) being the parental lineage to all the tetraploids included in the study and also suggests that the S.a lineage was involved in the formation of hexaploids.
(a) A possible binary MUL tree obtained by Petri and Oxelman (unpublished data). The labels S.a, S.s, S.i, and S.u are the plant taxa given in figure 1. In addition, S.l is Silene linnaeana, S.sa is Silene sachalinensis, S.t is Silene tolmachevii, S.n is Silene nigrescens, and S.uM is Silene uralensis (from Mongolia). (b) The unique phylogenetic network for that MUL tree produced by the Padre software package described at the end of Methods.
Note that our construction is especially well suited to cases involving allopolyploidy because the ploidy levels of the extant taxa serve as a “control” in the resulting network. In particular, on assigning ploidy level 2x to the root of the network, in case allopolyploidy exclusively occurs, the network nodes retain the parent's ploidy level for tree nodes and attain the sum of the parents' ploidy levels in case of interaction nodes. For example, in figure 1, S.a and Silene uralensis both have ploidy level 2x and Silene sorensenis/ostenfeldii and S.i have ploidy level 6x and 4x, respectively, which are precisely the ploidy levels that get assigned to the nodes in the network.
Although for small examples such as those in figures 1 and 5 it is probably possible to intuitively infer plausible networks, our method has the advantage of providing an optimal network, thus providing lower bounds on the number of hybridization events required to interpret the data. Moreover, considering the widespread occurrence of allopolyploidy in plants, it is easy to imagine more complex data sets. For example, Stebbins (1956) put forward a hypothesis explaining the origins of polyploids in Bromus (ranging from 4x to 12x), and Lidén (1986) visualized a hypothesis on the origins of some of the allopolyploids in Fumaria (ranging from 4x to 14x). With the aid of modern molecular methods, we anticipate that hypotheses like theirs can now be tested and that our proposed method will prove useful in this context due to its ability to formally construct optimal solutions.
Discussion
We have presented a construction that, for a given MUL tree, can produce all possible optimal binary phylogenetic networks exhibiting the evolutionary scenarios encoded in the tree. The resulting method is easy to perform by hand for small examples, can be computed efficiently in general, and is implemented in freely available software. Furthermore, we have illustrated its applicability to plant data.
The method is particularly useful for reconstructing the evolutionary past of allopolyploid species. The reasons for this are two-fold. First, as described above, the ploidy levels of the taxa serve as a control for the expected evolutionary patterns. Second, it is anticipated that robust MUL trees can be obtained for relatively recently derived allopolyploids as long as the homologous genes are not severely affected by silencing and similar processes (Soltis et al. 2004). In particular, the approach described in Popp et al. (2005) for inferring majority-rule consensus MUL trees from multiple gene trees may prove useful for many groups.
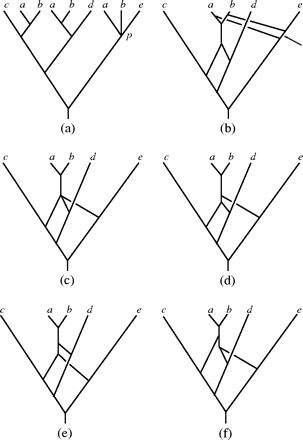
The network construction method does have certain limitations. For example, if a MUL tree contains “soft” polytomies (i.e., nodes that are unresolved and, therefore, may be interpreted as uncertainties with regards to the order of speciation), then applying the network construction method to the MUL trees obtained from different resolutions of the polytomies might result in networks postulating different numbers of combination events. For example, consider the unresolved MUL tree 𝒯 depicted in figure 6a, where the node p represents a polytomy. If p is resolved so that either b and e are grouped together versus a or a and e are grouped together versus b, then the phylogenetic networks obtained by our construction exhibiting these resolutions of 𝒯 both contain 3 interaction nodes (see fig. 6b for the network obtained for the grouping of b and e versus a). If, however, p is resolved so that a and b are grouped together versus e, then the network arrived at by our construction (fig. 6c) contains 1 node that is at the end of 3 edges, and each of the 3 possible resolutions of that node results in a binary phylogenetic network (fig. 6d–f) containing only 2 interaction nodes.
Constructing networks for MUL trees containing soft polytomies. (a) A MUL tree with node p representing a soft polytomy. (b) The (unique) phylogenetic network resulting in case p is resolved so that the leaves labeled b and e are grouped together versus the leaf labeled a. (c) The (unique) phylogenetic network resulting if p is resolved so that the leaves labeled a and b are grouped together versus the leaf labeled e. (d)–(f) The 3 binary phylogenetic networks obtained by resolving the degree 4 node in the network pictured in (c).
Although different in topology, the evolutionary scenario suggested by all 3 phylogenetic networks depicted in figure 6d–f is that putative ancestors of species a and b combined after species e had split away from one of them as opposed to the scenario supported by the network depicted in figure 6b. Therefore, all 3 phylogenetic networks are equally good solutions to the original problem of recovering a phylogenetic network from an input MUL tree, making it impossible to establish which resolution to take without external information. For polyploids, this information could be, for example, the inclusion of some measure of relative time the genomes have been coexisting (e.g., relative amount of recombination detected between the combining genomes). In consequence, the possibility of alternative evolutionary scenarios should be kept in mind when applying the method to MUL trees that contain soft polytomies (note that in case p represents a “hard” polytomy, the network associated to 𝒯 by our construction is the network depicted in figure 6b with the indicated edge contracted, which represents a reasonable evolutionary scenario).
More importantly, more work needs to be done concerning the inference of MUL trees from a set of gene trees and, in particular, how to root such trees as the network construction heavily relies on the position of the root. Because polyploidization can be expected to be an irreversible process, obtaining such a root does not pose too great a problem for small gene families (see, e.g., Popp et al. 2005). For large gene families, however, combining a set of gene trees into a MUL tree may be a difficult problem, especially if not all orthologues are present for each paralogue and if single genes have duplicated and/or have been transferred laterally. Attempting to reconstruct the evolutionary past of taxa for which, for example, lateral gene transfer is suspected using the proposed approach might therefore be difficult. An approach using multiple unlinked genes potentially has the ability to sort whole-genome processes (hybridization) from single-gene horizontal transfers, sorting, and population-level events, but this needs to be modeled explicitly (Linder and Rieseberg 2004).
In general, there remains much to be done on reconstructing evolutionary histories for polyploids, which will at least require some solutions to the following problems.
Distinguishing between Hybridization Events and Phylogenetic Sorting
Perhaps the most difficult problem when interpreting gene trees that are discordant with “species” trees is to determine whether the discordance is due to hybridizations between lineages or because of phylogenetic sorting (i.e., duplication in an ancestral lineage followed by random extinction in descendant lineages). The problem is analogous to the classical biogeographical dilemma on how to weight dispersal versus speciation/extinction events (Ronquist 1997). For whole-genome processes such as allopolyploidy and endosymbiosis, it seems reasonable to expect that unlinked genes should express similar gene trees, whereas there is no reason to expect that sorting events occur simultaneously.
Distinguishing between Additive and Nonadditive Hybridization Events
Hybridization events can be classified into 2 distinct categories. These are acquisition of paralogues of existing genes and xenologous gene displacement, whereby a gene is displaced by a horizontally transferred orthologue from another lineage (xenolog). The defining feature of the proposed approach of subdividing (and identifying and pruning) appropriately chosen edges in a MUL tree implies that it is only applicable to evolutionary processes that fall into the first category. On the other hand, the approach proposed by Hallett and Lagergren (2001) is only applicable to data sets that fall into the second category. Because it is reasonable to expect that phylogenetic sorting and hybridization events are both present in a data set (especially for recently evolved groups), it is desirable that methods be developed that can simultaneously handle both situations.
The problem of recovering network-like evolutionary histories has recently attracted a considerable amount of attention in the literature. We complement the existing approaches with a network construction technique based on the knowledge of a MUL tree, which should provide a useful additional tool for network construction. In particular, we anticipate that our method will stimulate the generation of new data types that bear the telltale signs of reticulate evolution (such as multiple low–copy number nuclear genes) and, ultimately, greatly improve the understanding of the phylogenetics of plants, as well as other organismal groups in which polyploidy occurs.
Arndt von Haeseler, Associate Editor
The authors thank K. Bremer for bringing them together. K.T.H. and B.O. thank The Swedish Research Council Vetenskapsrådet for supporting parts of this work. The authors thank the anonymous referees for their helpful comments, especially the referee who indicated how the efficient algorithm described in Methods could be obtained.
References
Adams KL, Wendel JF.
Álvarez I, Wendel JF.
Cronn RC, Small RL, Haselkorn T, Wendel JF.
Doyle JJ, Doyle JL, Rauscher JT, Brown AHD.
Hallett MT, Lagergren J.
Huber KT, Moulton V.
Huson DH, Bryant D.
Knuth DE.
Lidén M.
Linder CR, Rieseberg LH.
Martin W.
Morrison DA.
Müntzing A.
Müntzing A.
Page RDM.
Popp M, Erixon P, Eggens F, Oxelman B.
Popp M, Oxelman B.
Posada D, Crandall KA.
Ronquist F.
Small RL, Cronn RC, Wendel JF.
Smedmark JEE, Eriksson T, Bremer B.
Smedmark JEE, Eriksson T, Evans RC, Campbell CS.
Soltis DE, Soltis PS, Tate JA.
Spring J.
Author notes
*School of Computing Sciences, University of East Anglia, Norwich, United Kingdom; and †Department of Systematic Botany, Evolutionary Biology Centre, Uppsala University, Uppsala, Sweden




![Constructing the network 𝒩(𝒯) for a MUL tree 𝒯. (a) A MUL tree 𝒯 with 3 equivalent maximal inextendible subtrees \batchmode \documentclass[fleqn,10pt,legalpaper]{article} \usepackage{amssymb} \usepackage{amsfonts} \usepackage{amsmath} \pagestyle{empty} \begin{document} \(\mathrm{\mathcal{T}}_{(u)},\mathrm{\mathcal{T}}_{(v)},\) \end{document} and \batchmode \documentclass[fleqn,10pt,legalpaper]{article} \usepackage{amssymb} \usepackage{amsfonts} \usepackage{amsmath} \pagestyle{empty} \begin{document} \(\mathrm{\mathcal{T}}_{(w)}\) \end{document} enclosed by dashed lines. (b) The (unique) phylogenetic network obtained by applying the subdivide, identify, and prune operations described in the text to the equivalent subtrees indicated in (a) plus the leaves labeled by a and e, respectively. (c) The (unique) phylogenetic network resulting from applying the subdivide, identify, and prune operations to the equivalent maximal inextendible subtrees enclosed by dashed lines in (b). (d) A binary phylogenetic network obtained by resolving the degree 4 node of the network pictured in (c). (e) An alternative representation of the network depicted in (d).](https://oup.silverchair-cdn.com/oup/backfile/Content_public/Journal/mbe/23/9/10.1093/molbev/msl045/2/m_molbiolevolmsl045f03_lw.gif?Expires=1716618346&Signature=ZPnZ2WTbOSvZOYZKfBcR65CJJQ5hUQx64NjnTTlUGvVHuvTK6DBaMTFDfPEfpaD83zDTpQ5RyF13riGJnilgQpXIKsYHz1N1Qkqx~iUPBJdIIZNUPfXS5HIi6PYYo4bDt13to3IxtGMTx7fL6PIozeROMeuuYwurTnmKH6lg4gqQ1InyNVz8k9j87iO08sgbVuN8A-xcxCTj2ZbmaHoFtIUh7GgwM5BzUbB4vg1eAmnSRJVytZRR4o34CEsByUO26whWSamwnRcSFPlFcWllrW~cTGHroqEgZSwiAMaxOSj9d01p~zGT2vTRWNoiehgmZ6rUjS4BlAgoR8CL5nbGgg__&Key-Pair-Id=APKAIE5G5CRDK6RD3PGA)
