


Abstract
Based on molecular data three major clades have been recognized within Bilateria: Deuterostomia, Ecdysozoa, and Spiralia. Within Spiralia, small-sized and simply organized animals such as flatworms, gastrotrichs, and gnathostomulids have recently been grouped together as Platyzoa. However, the representation of putative platyzoans was low in the respective molecular phylogenetic studies, in terms of both, taxon number and sequence data. Furthermore, increased substitution rates in platyzoan taxa raised the possibility that monophyletic Platyzoa represents an artifact due to long-branch attraction. In order to overcome such problems, we employed a phylogenomic approach, thereby substantially increasing 1) the number of sampled species within Platyzoa and 2) species-specific sequence coverage in data sets of up to 82,162 amino acid positions. Using established and new measures (long-branch score), we disentangled phylogenetic signal from misleading effects such as long-branch attraction. In doing so, our phylogenomic analyses did not recover a monophyletic origin of platyzoan taxa that, instead, appeared paraphyletic with respect to the other spiralians. Platyhelminthes and Gastrotricha formed a monophylum, which we name Rouphozoa. To the exclusion of Gnathifera, Rouphozoa and all other spiralians represent a monophyletic group, which we name Platytrochozoa. Platyzoan paraphyly suggests that the last common ancestor of Spiralia was a simple-bodied organism lacking coelomic cavities, segmentation, and complex brain structures, and that more complex animals such as annelids evolved from such a simply organized ancestor. This conclusion contradicts alternative evolutionary scenarios proposing an annelid-like ancestor of Bilateria and Spiralia and several independent events of secondary reduction.
Introduction
Molecular data have profoundly changed the view of the bilaterian tree of life by recognizing three major clades: Deuterostomia, Ecdysozoa, and Spiralia (Halanych 2004; Edgecombe et al. 2011). The term Spiralia is occasionally used as a synonym for Lophotrochozoa (Halanych 2004). However, the term Lophotrochozoa is actually reserved for all descendants of the last common ancestor of Annelida, Mollusca, and the three lophophorate taxa (Halanych 2004), whereas the more comprehensive taxon Spiralia includes all animals with spiral cleavage and, hence, also Platyhelminthes (Edgecombe et al. 2011). Herein, we use Spiralia in the terms of the more inclusive definition.
Previous results of the molecular phylogenetic analyses initiated a still on-going debate about the evolution of complexity in Bilateria. It was proposed that the last common ancestor of Deuterostomia, Ecdysozoa and Spiralia had a segmented and coelomate body organization resembling that of an annelid, and that morphologically more simply organized taxa such as nematodes or flatworms (Platyhelminthes) evolved by secondary reductions (Brinkman and Philippe 2008; De Robertis 2008; Couso 2009; Tomer et al. 2010; Chesebro et al. 2013). This is in stark contrast to the traditional “acoeloid–planuloid” hypothesis favoring evolution of Bilateria from a simple body organization toward more complex forms with a last common ancestor resembling a flatworm without segmentation and coelomic cavities (Hyman 1951; Halanych 2004; Hejnol et al. 2009). Unraveling the phylogenetic relationships within Bilateria is crucial to resolve this controversy (Halanych 2004; Edgecombe et al. 2011).
While recent phylogenomic studies recovered most of the relations of the major branches within Deuterostomia and Ecdysozoa, the internal phylogeny of Spiralia is still unclear (Edgecombe et al. 2011). Indeed, spiralian animals exhibit a wide variety and plasticity in development and morphology including body organization (Nielsen 2012) which gave rise to the distinction of two major taxa: Lophotrochozoa and Platyzoa (Halanych 2004; Edgecombe et al. 2011). As mentioned above, Lophotrochozoa comprises at least annelids (ringed worms), lophophorates, and mollusks (Halanych 2004) and hence animals with a more complex morphology. In contrast, Platyzoa subsumes more simple appearing taxa such as flatworms, hairy backs (Gastrotricha), wheel animals (classical Rotifera), thorny-headed worms (Acanthocephala), and jaw worms (Gnathostomulida) (Cavalier-Smith 1998). Although some authors regard Platyzoa as sister to Lophotrochozoa (Edgecombe et al. 2011), others place Platyzoa within Lophotrochozoa, thus rendering Spiralia synonymous with Lophotrochozoa (Halanych 2004). Importantly, unique morphological autapomorphies supporting the monophyly of Platyzoa are lacking (Giribet 2008) and phylogenetic analyses of nuclear and mitochondrial data failed to resolve the question as well (Paps et al. 2009a, 2009b; Bernt et al. 2013). Nevertheless, there seems to be a tendency for a weakly supported monophylum Platyzoa as long as larger data sets were analyzed (Halanych 2004; Hausdorf et al. 2007; Struck and Fisse 2008; Hejnol et al. 2009; Paps et al. 2009a; Witek et al. 2009). However, across all these analyses placement of platyzoan taxa appeared unstable, probably due to low data and taxa coverage (Edgecombe et al. 2011). Moreover, parallel evolution of character states on long branches (also known as LBA) might also have confounded these analyses (Edgecombe et al. 2011). In summary, monophyly of Platyzoa and the phylogenetic positions of the platyzoan taxa within Spiralia are still contentious although their positions have major implications for bilaterian evolution. In particular, monophyly of Platyzoa and a placement within Lophotrochozoa would be in line with the theory of a more complex ancestry (Brinkman and Philippe 2008), whereas paraphyletic Platyzoa with respect to Lophotrochozoa would support the “acoeloid–planuloid” hypothesis.
Results and Discussion
To address the major outstanding issues of bilaterian phylogeny with respect to spiralian and more specifically platyzoan relationships, we applied a phylogenomic approach, generating transcriptome sequence data for 10 putative platyzoan and two nemertean species using second-generation sequencing technology and a modified RNA amplification method, which allowed the generation of sequencing libraries from as few as 10 specimens of microscopic species of Gnathostomulida, Gastrotricha, and classical Rotifera (supplementary table S1, Supplementary Material online). These data were complemented with transcriptomic or genomic data of 53 other spiralian and ecdysozoan species, including additional representatives of Platyzoa (supplementary table S2, Supplementary Material online). Hereby, the taxon coverage of Platyzoa increased 3.5-fold and for individual platyzoan taxa such as Syndermata (wheel animals and thorny-headed worms) and Gastrotricha even 5-fold in comparison to previous large-scale analyses of spiralian relationships (Dunn et al. 2008; Hejnol et al. 2009). After orthology assignment (Ebersberger et al. 2009), the data were further screened for sequence redundancy (Kvist and Siddall 2013), potentially paralogous sequences (Struck 2013) and contamination (Struck 2013) resulting in a pruning of about 7% of sequence data (supplementary tables S3–S8, Supplementary Material online).
Brute-Force Approach: More Taxa and Data
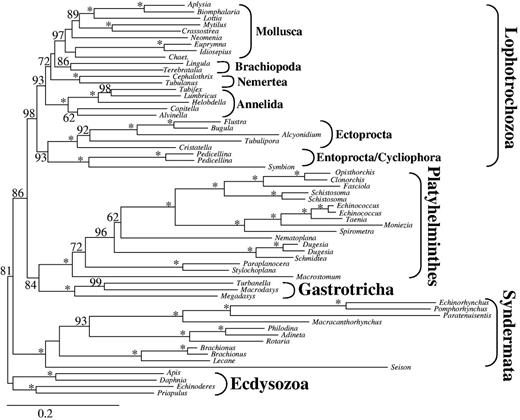
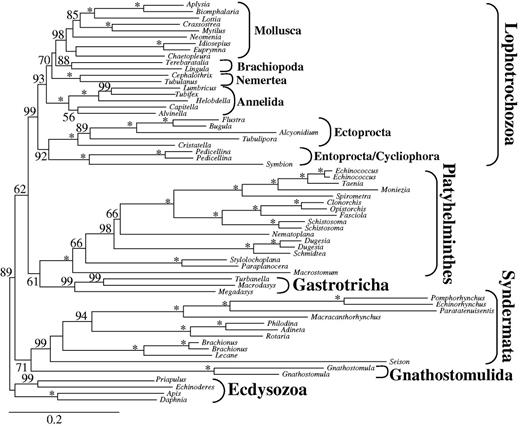
Phylogenetic reconstructions based on the largest data sets d01 with 82,162 amino acid positions and 38.3% sequence coverage (supplementary table S9, Supplementary Material online) recovered monophyly of both Platyzoa and Lophotrochozoa with strong bootstrap support (BS) of 99 for both (fig. 1). Within Platyzoa, monophyly of Platyhelminthes, of Syndermata, as well as of Gnathostomulida was maximally supported, whereas monophyly of Gastrotricha was not recovered. The chaetonotid gastrotrich Lepidodermella squamata appeared as sister to Platyhelminthes (BS 46), whereas the macrodasyidan gastrotrichs formed a monophylum (BS 74) as sister to all other platyzoan taxa (BS 68). Finally, Gnathostomulida was sister to Syndermata (BS 61) consistent with the Gnathifera hypothesis (Ahlrichs 1997; Herlyn and Ehlers 1997).
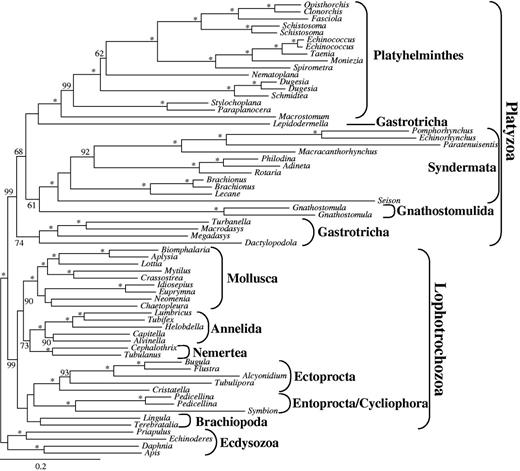
Maximum-likelihood (ML) tree obtained by analysis of data set d01 with 65 taxa and 82,162 amino acid positions. Only BS values ≥50 are shown at the branches. *Maximal support of 100. Higher taxonomic units are indicated.
To study the influence of unstable taxa, leaf stability analyses were performed. With a leaf stability index of 0.876, the gastrotrich Lep. squamata was the most unstable species within the sampled platyzoans, followed by the two gnathostomulid species (0.941) and the macrodasyidan gastrotrich Dactylopodola baltica (0.969) (fig. 2 and supplementary table S10, Supplementary Material online). Excluding these four platyzoan taxa from data set d01 and conducting a new phylogenetic reconstruction did not influence the remaining topology, but led to an increased BS value of 99 for a clade uniting Platyhelminthes and Syndermata and decreased values for the monophyly of both Platyzoa and Lophotrochozoa (BS 82 and 86, table 1). Thus, the four unstable taxa showed some influence on support for the phylogenetic placement of other platyzoan taxa. Therefore, we excluded these four taxa from the following analyses, which addressed the potential role of LBA on platyzoan phylogeny in more detail.
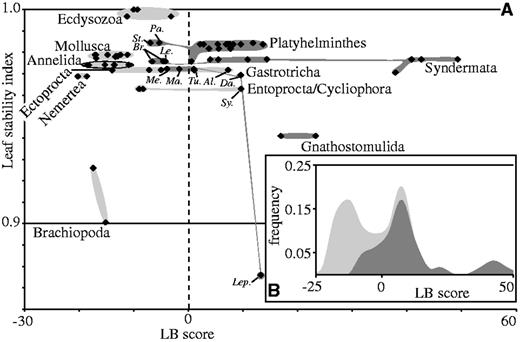
Leaf stability indices and LB scores based on the ML analysis of data set d01 with 65 taxa and 82,162 amino acid positions. (A) Plot of leaf stability indices against LB scores. (B) Distribution of LB scores. The dashed line in A indicates LB score = 0. Shades distinguish ecdysozoan and lophotrochozoan species (light gray) from putative platyzoan species (dark gray). Some species are also labeled: Pa, Paraplanocera; St, Stylochoplana; Br, Brachionus; Le, Lecane; Me, Megadasys; Ma, Macrodasys; Da, Dactylopodola; Lep, Lepidodermella; Sy, Symbion; Tu, Tubulipora; Al, Alcyonidium.
Bootstrap Support (BS) for Monophyly and Paraphyly of Platyzoa as well as Monophyly of Rouphozoa.
| Data Set | Excl. Taxa | # Pos. | # Taxa | Platyzoa | Rouphozoa | |
|---|---|---|---|---|---|---|
| Mono. | Para. | Mono. | ||||
| d01 (all data) | None | 82,162 | 65 | 99a | 0 | 3 |
| Unstable | 82,162 | 61 | 82b | 1 | 1 | |
| LB | 82,162 | 34 | 3 | 95a | 96a | |
| d02 (high coverage) | Unstable | 36,513 | 61 | 3 | 86b | 84b |
| LB | 36,513 | 34 | 0 | 100a | 93b | |
| d07 (low base frequency heterogeneity) | Unstable | 37,907 | 61 | 19 | 75b | 71b |
| LB | 37,907 | 34 | 0 | 100a | 97a | |
| d08 (low branch length heterogeneity) | Unstable | 29,133 | 61 | 18 | 72b | 76b |
| LB | 29,133 | 34 | 10 | 50 | 54 | |
Excl., excluded; # pos., number of positions; # taxa, number of taxa; LB, long-branched taxa.
aSupport values are part of the 95% confidence set.
bSupport values are part of the 70% confidence set.
LBA Accounts for Monophyly of Platyzoa
Monophyletic Platyzoa as sister to Lophotrochozoa gained strong support in the analyses described above. However, thorough inspection of the topology (fig. 1) revealed considerable branch length heterogeneity, with long branches in the analyzed platyzoan lineages and rather short branches in lophotrochozoan and ecdysozoan lineages. Hence, the observed strong support for monophyletic Platyzoa might originate from artificial rather than phylogenetic signal (Bergsten 2005; Edgecombe et al. 2011; Kück et al. 2012). For the tree derived from data set d01 and shown in figure 1, the LB scores showed a bimodal distribution with a minimum between the two highest optima at an LB score value of 0 (fig. 2B). Putative platyzoan species had generally higher LB score values than lophotrochozoan and ecdysozoan species (fig. 2 and supplementary table S11, Supplementary Material online). Only the LB scores inferred for Stylochoplana and Paraplanocera within Platyhelminthes, the two Brachionus species and Lecane in Syndermata, and Megadasys and Macrodasys in Gastrotricha approximated those of most lophotrochozoans and ecdysozoans. On the other hand, Symbion (Cycliophora), Alcyonidium, and Tubulipora (Ectoprocta) showed values >0, resembling those of most of the platyzoan species sampled (fig. 2).
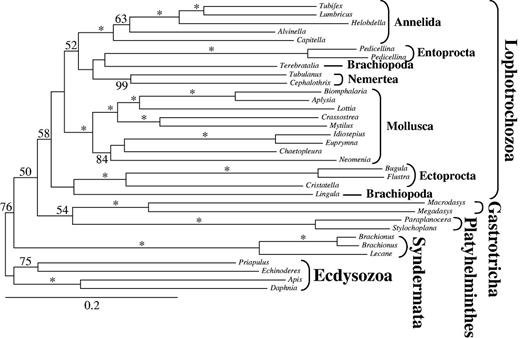
To assess the effect of long branches on tree reconstruction, all species with LB scores above 0 were excluded from data set d01 (82,162 positions). Interestingly, monophyly of Platyzoa was no longer recovered (fig. 3). Gastrotricha now emerged as sister to Platyhelminthes (BS 96; table 1), and this clade was sister to monophyletic Lophotrochozoa (BS 95; table 1), whereas Syndermata was sister to all other spiralian taxa. Thus, exclusion of long-branched species had a tremendous effect on the analyses rendering a strongly supported monophyly of Platyzoa with BS values >95 into a paraphyletic assemblage, in which the clade consisting of Gastrotricha + Platyhelminthes and Lophotrochozoa obtained strong support with a BS value of 95.
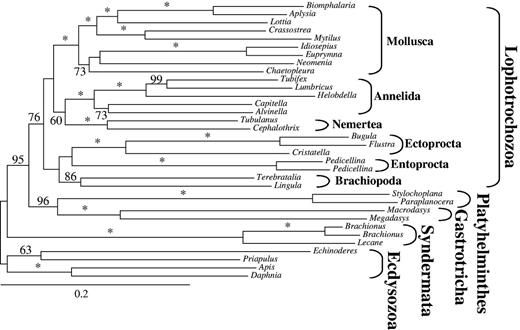
ML tree obtained by analysis of data set d01 with 34 taxa and 82,162 amino acid positions. All taxa exceeding LB scores >0 in tree of figure 1 were excluded. Only BS ≥50 are shown at the branches. *Maximal support of 100. Higher taxonomic units are indicated.
Biases Causing Monophyletic Platyzoa
To gain further insights into the issue of mono- versus paraphyletic Platyzoa, we analyzed the data with respect to the different properties of individual genes. In detail, we studied the effect of gene-specific proportions of hydrophobic amino acids and missing data, base composition and branch length heterogeneity, and evolutionary rates on tree reconstruction. A common procedure is to choose one of these properties as the most influential one either based a priori on literature or a posteriori on the obtained results (e.g., Brinkman and Philippe 2008; Simmons 2012b; Nesnidal et al. 2013; Nosenko et al. 2013; Roure et al. 2013; Salichos and Rokas 2013). Herein, we used another procedure based on the variability exhibited in the data itself prior to analyses of alternative data sets reflecting different degrees of data reduction. According to the principal component analysis (Alexe et al. 2008), the first principal component explained 31.0% of the variance between the different genes. It was mainly derived from the proportion of missing data and base composition heterogeneity with eigenvectors pointing into opposite directions (supplementary fig. S3 and Supplementary Data, Supplementary Material online). Branch length heterogeneity and evolutionary rate were the largest factors in the second component, which explained 26.8% of the variance. Correlation analyses showed that in our case evolutionary rate, which is often used as a proxy for branch length heterogeneity (Brinkman and Philippe 2008), did not correlate with actual measurements of branch length heterogeneity (R2 = 0.0324 and 0.0635; supplementary fig. S4, Supplementary Material online).
As we wanted to test for LBA, we used the direct measurement of branch length heterogeneity instead of evolutionary rate. Thus, we generated data sets with either different degrees of missing data (d02–d06), proportion of low base composition heterogeneity (d07), or low branch length heterogeneity (d08) as well as genes being part of the 70% or 95% confidence intervals of the first two principal components (d09 and d10) (supplementary tables S9 and Supplementary Data, Supplementary Material online). Based on the results of the principal component analysis, we present in detail the results of three data sets d07 (low base composition heterogeneity), d08 (low branch length heterogeneity), and d02. The latter combines a low degree of missing data with a high number of positions.
Analyses of these three data sets excluding the four above-mentioned unstable platyzoan taxa consistently resulted in paraphyletic Platyzoa (fig. 4 and table 1) as observed before when excluding long-branched taxa from the large data set d01. Once more, Platyhelminthes was sister to Gastrotricha (BS 76, 84, and 71, Rouphozoa in table 1) and Lophotrochozoa was recovered as a monophyletic group (BS 98, 47, and 95). The clade of Gastrotricha/Platyhelminthes was sister to Lophotrochozoa (BS 72, 86, and 75, table 1) and Syndermata was sister to the all other spiralian taxa again. Thus, either by increasing the coverage (d02) or decreasing base composition or branch length heterogeneity (d07 and d08) paraphyletic Platyzoa was recovered (table 1), as a clade comprising Gastrotricha, Platyhelminthes and Lophotrochozoa gained strong branch support exceeding values of 70.
ML tree obtained by analysis of data set d02 with 61 taxa and 36,513 amino acid positions. Only partitions with low to medium up to low degrees of missing data were included and the four unstable taxa (Lepidodermella squamata, Dactylopodola baltica, and the two Gnathostomulida species) were excluded. Only BS ≥ 50 are shown at the branches. *Maximal support of 100. Higher taxonomic units are indicated.
Additional exclusion of long-branched species (figs. 2 and 3) reproduced paraphyly of Platyzoa in all analyses, even with maximum BS in some analyses. Again Platyhelminthes was sister to Gastrotricha (BS 93, 97, and 54, fig. 5, Rouphozoa in table 1) and both were more closely related to the lophotrochozoan taxa than to Syndermata (BS 100, 100, and 50, fig. 5, Platyzoa Para. in table 1). Moreover, comparing the trees without long-branched species (figs. 3 and 5) to the one with all species (fig. 1) shows that now similar branch lengths lead to the “platyzoan” and lophotrochozoan species (figs. 3 and 5). Additionally, the standard deviation of the species-specific LB scores for the trees shown in figures 3 and 5 are 10.3 and 9.3, respectively, and, hence, lower than the standard deviation of 15.4 for the tree of figure 1. This means that the latter exhibits much stronger branch length heterogeneity across all taxa than the former two. Similarly, the standard deviations for the classical tip-to-root distances are lower for the trees of figures 3 and 5 with 0.054 and 0.143 than for the tree of figure 1 with 0.202.
ML tree obtained by analysis of data set d08 with 34 taxa and 29,133 amino acid positions. Only partitions with low degrees of branch length heterogeneity were included and all taxa exceeding LB scores >0 in tree of figure 1 were excluded. Only BS ≥50 are shown at the branches. *Maximal support of 100. Higher taxonomic units are indicated.
We also used a Bayesian approach with the GTR+CAT model, as this is known to be more robust toward LBA than classical ML models such as LG (Lartillot et al. 2007). Due to computational time restrictions and high memory requirements, we were not able to use the large data set d01 (82,162 positions). Instead, we chose data set d02 (low to medium-low degree of missing data; 36,513 positions; 46.1% coverage; supplementary table S9, Supplementary Material online) as the principal component analysis indicated coverage as the most influential property in the first component. Importantly, the Bayesian approach did not recover monophyletic Platyzoa, but instead a clade including Gastrotricha + Platyhelminthes and monophyletic Lophotrochozoa (posterior probability [PP] = 1.00, fig. 6) and again Gnathostomulida + Syndermata was sister to this clade (PP = 1.00, fig.6).
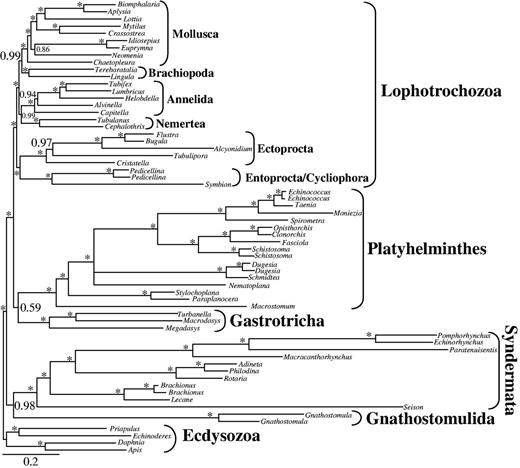
BI tree obtained by analysis of data set d02 with 63 taxa and 36,513 amino acid positions. Only partitions with low to medium up to low degrees of missing data were included and only the two unstable gastrotrich taxa Lepidodermella squamata and Dactylopodola baltica were excluded. Only PPs ≥ 0.50 are shown at the branches. *Maximal support of 1.00. Higher taxonomic units are indicated.
Thus, combining Bayesian and maximum-likelihood analyses with different data and taxa exclusion strategies could not recover monophyletic Platyzoa in contrast to analyses using only large numbers of data (figs. 1, 3–6 and table 1). Considering all 10 data sets (i.e., d01–d10), BS for monophyletic Platyzoa substantially increased with additional amino acid positions (dark gray line in fig. 7A), whereas support for paraphyly decreased (black line in fig. 7A). In contrast, support for monophyly of Lophotrochozoa was not strongly affected by the number of positions analyzed (light gray line in fig. 7A). It is a well-known phenomenon of LBA that it is positively misleading; that is, with increasing numbers of positions the artificial group is more robustly recovered (Felsenstein 1978; Huelsenbeck 1997; Bergsten 2005). On the other hand, excluding long-branched species from analyses did not lead to such correlations. In particular, support for the monophyly of Platyzoa remained low irrespective of the number of alignment positions (dark gray line in fig. 7B).
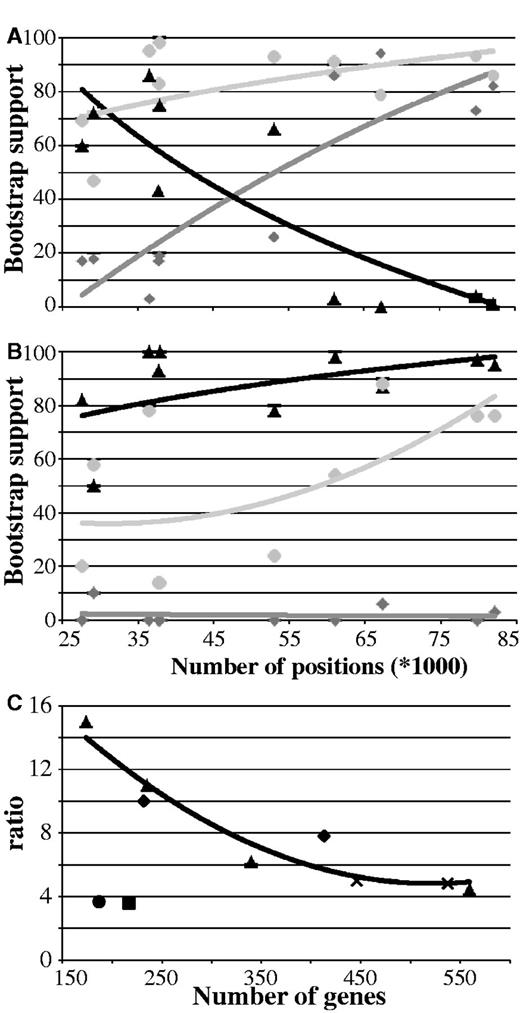
BS and the ratio of single-genes supporting paraphyly over monophyly relative to the number of alignment positions or genes. (A and B) BS for monophyly and paraphyly of Platyzoa as well as monophyly of Lophotrochozoa relative to the number of positions. (A) Analyses based on 61 taxa, from which the four unstable taxa (Lepidodermella squamata, Dactylopodola baltica, and the two Gnathostomulida species) were excluded. (B) Analyses based on 34 taxa, from which all taxa exceeding LB scores >0 in tree of figure 1 were excluded. Light gray = monophyly of Lophotrochzoa, dark gray = monophyly of Platyzoa, black = paraphyly of Platyzoa. Best-fitting trend lines generated by Excel are also shown in the same colors. (C) Ratio of the percentage of single-gene trees supporting paraphyly of Platyzoa to the percentage of single-gene trees supporting monophyly of Platyzoa relative to the number of genes. Diamonds = data sets d02 and d03 with reduced missing data; triangles = data sets d01, d04–d06 generated using MARE; circle = data set d07 with reduced base heterogeneity; square = data set d08 with reduced branch length heterogeneity; crosses = data sets d09 and d10 based on confidence intervals of PCA. The best-fitting trend line generated by Excel for the data sets d01–d06 with decreasing degrees of missing data is shown in black.
Additionally, we determined for each data set the number of single-gene trees supporting monophyly or paraphyly of Platyzoa. Across all data sets the percentage of single genes supporting platyzoan paraphyly ranged from 8.6% to 11.7% and, thus, was higher than the percentage supporting monophyletic Platyzoa, ranging from 0.5% to 3.2% (table 2). Interestingly, decreasing the degree of missing data (i.e., d01–d06) and, hence, increasing the number of taxa per gene, the ratio of the percentage of trees supporting paraphyly relative to the percentage of trees supporting monophyly strongly increased (black line in fig. 7C). Directly addressing biases in the data such as base or branch length heterogeneity did not have such an effect on the ratio. In the case of LBA only strategies as used herein, which are able to attenuate its misleading effect by excluding either biased data or species or by increasing taxon coverage per gene, can reveal whether or not an assembly of long-branched taxa is artificially grouped together (Bergsten 2005). In conclusion, our analyses support platyzoan paraphyly, whereas recovery of monophyletic “Platyzoa” is most probably due to LBA.
Percentage of Single-Genes Supporting Monophyly or Paraphyly of Platyzoa.
| Degree of Missing Data | Heterogeneity | PCA | ||||||||
|---|---|---|---|---|---|---|---|---|---|---|
| Data Set | d01 | d02 | d03 | d04 | d05 | d06 | d07 | d08 | d09 | d10 |
| # Genes | 559 | 232 | 413 | 340 | 235 | 174 | 217 | 187 | 446 | 537 |
| % Mono. | 2.1 | 0.9 | 1.2 | 1.5 | 0.9 | 0.6 | 3.2 | 3.2 | 2.0 | 2.0 |
| % Para. | 9.7 | 8.6 | 9.4 | 9.1 | 9.4 | 8.6 | 11.5 | 11.8 | 10.1 | 9.9 |
| % Lack | 88.2 | 90.5 | 89.3 | 89.4 | 89.8 | 90.8 | 85.3 | 85.0 | 87.9 | 88.1 |
| Para./Mono. | 4.5 | 10 | 7.8 | 6.2 | 11 | 15 | 3.6 | 3.7 | 5 | 4.8 |
# Genes, number of genes in data set; % Mono., percentage of single-gene trees supporting monophyly of Platyzoa; % Para., percentage of single-gene trees supporting paraphyly of Platyzoa; % Lack, percentage of single-gene trees lacking resolution regarding this question; Para./Mono., ratio of the percentage of single-gene trees supporting paraphyly of Platyzoa to the percentage of single-gene trees supporting monophyly of Platyzoa; PCA, principal component analysis.
Position of Gnathostomulida
In addition to LBA, the inference of a stable topology was hampered by the inclusion of Gnathostomulida and the two gastrotrichs Lepidodermella and Dactylopodola. In order to elucidate the phylogenetic position of Gnathostomulida within Spiralia, we reincluded the two formerly excluded gnathostomulid species into different data sets. Importantly, their inclusion did not alter the topology with respect to platyzoan paraphyly in any tree reconstruction (e.g., cf. figs. 4 and 8). Analysis of data set d07 excluding unstable taxa except Gnathostomulida (i.e., Lepidodermella and Dactylopodola) and of data set d02 excluding all long-branched taxa recovered Gnathostomulida as part of a clade with Gastrotricha and Platyhelminthes (table 3). However, all other analyses placed Gnathostomulida as sister to Syndermata with BS values of up to 91, even though overall BS remained low (fig. 8 and table 3). Moreover, the Bayesian analysis also recovered a sister group-relationship of Gnathostomulida and Syndermata with strong support (PP = 0.98, fig. 6). This position of Gnathostomulida as sister to Syndermata is consistent with the Gnathifera hypothesis (Ahlrichs 1997; Herlyn and Ehlers 1997). Monophyly of Gnathifera has also been found in previous studies based on ribosomal protein data (Witek et al. 2009; Hausdorf et al. 2010) and is also strongly supported by the likely homology of gnathostomulidan jaws and rotiferan trophi (Rieger and Tyler 1995; Haszprunar 1996; Ahlrichs 1997; Herlyn and Ehlers 1997; Jenner 2004a). For a thorough analysis of the phylogenetic relations within Syndermata and the implication for their evolution, we refer to a recent transcriptome-based study (Wey-Fabrizius et al. 2014).
ML tree obtained by analysis of data set d02 with 63 taxa and 36,513 amino acid positions. Only partitions with low to medium up to low degrees of missing data were included and only the two unstable gastrotrich taxa Lepidodermella squamata and Dactylopodola baltica were excluded. Only BS ≥50 are shown at the branches. *Maximal support of 100. Higher taxonomic units are indicated.
BS for Monophyly of Gnathifera.
| Data Set | Excl. Taxa | # Taxa | Gnathifera |
|---|---|---|---|
| d01 (all data) | None | 65 | 61 |
| Unstable | 63 | 91a | |
| LB | 36 | 67 | |
| d02 (high coverage) | Unstable | 63 | 71a |
| LB | 36 | 10b | |
| d07 (low base frequency heterogeneity) | Unstable | 63 | 48b |
| LB | 36 | 86a | |
| d08 (low branch length heterogeneity) | Unstable | 63 | 24 |
| LB | 36 | 12 |
Excl., excluded (same as in table 1 except for Gnathostomulida); # Taxa., number of taxa; LB, long-branched taxa.
aSupport values are part of the 70% confidence set.
bGnathostomulida not placed as sister to Syndermata in the ML tree, but in a clade with Gastrotricha and Platyhelminthes.
A Novel View on Spiralian Phylogeny
In summary, our analyses support the monophyly of Lophotrochozoa and of a clade combining Gastrotricha and Platyhelminthes. Gnathifera is sister to a clade comprising the aforementioned taxa (fig. 9). No morphological apomorphy is known to date supporting either a monophyletic origin of Platyhelminthes and Gastrotricha or of Platyhelminthes, Gastrotricha, and Lophotrochozoa (Jenner 2004a; Rothe and Schmidt-Rhaesa 2009) and, hence, could be used for naming these two clades. However, whereas most of the other spiralian taxa exhibit additional structures for food gathering in their ground pattern (e.g., palps in annelids, proboscis in nemerteans, filter feeding apparatuses in lophophorates, entoprocts, and cycliophorans, as well as jaw-like elements in rotifers, gnathostomulids, and mollusks), gastrotrichs and most flatworm species ingest food without such extra-structures, just by dilating their rather simple pharynx. The respective pharynx simplex is part of the ground pattern of Platyhelminthes and enables the swallowing of prey by either sucking action or engulfment (Doe 1981). Gastrotricha possess a Y-shaped or inverted Y-shaped sucking pharynx (Kieneke et al. 2008). Although gathering food by sucking is not necessarily an autapomorphy of these two taxa, this common characteristic can nonetheless be utilized for naming the clade. We therefore suggest the name Rouphozoa (derived from the Greek word rouphao for ingesting by sucking) to define the last common ancestor of Platyhelminthes and Gastrotricha and all its descendants. The clade of Rouphozoa + Lophotrochozoa can be named Platytrochozoa, reflecting that it comprises Platyhelminthes and taxa with a trochophore larva and all extant descendants of the last common ancestor of Platyhelminthes and Lophotrochozoa. Spiralia then comprises Gnathifera (Syndermata + Gnathostomulida) and Platytrochozoa.
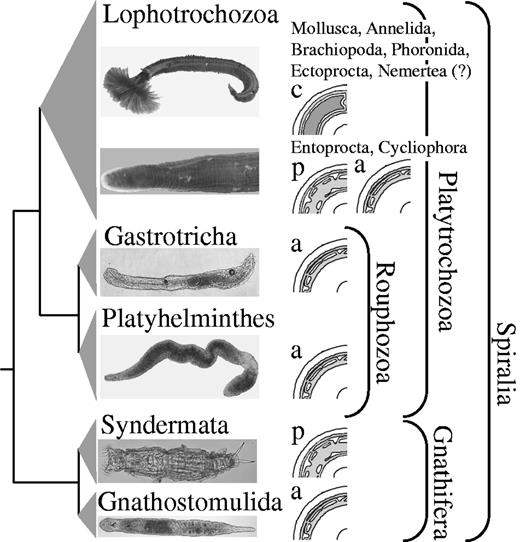
Proposed phylogeny of Spiralia. Higher taxonomic units and names are given. Drawings depict the acoelomate (=a), pseudocoelomate (=p), and coelomate (=c) body organization. Picture of Rotaria neptunoida (Syndermata) was courtesy of Michael Plewka. (?) means that it is still discussed if the lateral vessels of the nemertean circulatory system are homologous to coelomic cavities of other lophotrochozoan taxa (Turbeville 1986).
Implications for bilaterian evolution
The paraphyly of Platyzoa with respect to Lophotrochozoa is more in line with the traditional “acoeloid–planuloid” hypothesis than with the scenario of a last common ancestor of Deuterostomia, Ecdysozoa, and Spiralia with a segmented and coelomate body organization resembling an annelid. Within Spiralia the non-coelomate, small-sized taxa successively branch off first (fig. 9). Both Gnathostomulida and Gastrotricha comprise small interstitial organisms with an acoelomate body organization and <4 or 2 mm of length, respectively (Nielsen 2012). Within Syndermata only the highly modified, parasitic Acanthocephala are larger than a few millimeters and all exhibit a pseudocoelomate organization (Herlyn and Röhrig 2003; Nielsen 2012). Similarly, in Platyhelminthes, the ancestral condition is also a small-sized, acoelomate organization as seen today in Catenulida and Macrostomorpha, which are <5 mm in length (Nielsen 2012). Within Spiralia, animals with a coelomate body organization are, according to our analyses, only found in Lophotrochozoa (fig. 9). Thus, it is epistemologically more parsimonious to assume that the last common ancestor of Spiralia was an animal lacking a coelomic body cavity. Although many relationships within Lophotrochozoa are still unresolved in our study and warrant further investigations, our analyses suggest that within Spiralia coelomic cavities with a lining epithelium might have originated at the earliest in the stem lineage of Lophotrochozoa. Additionally, recent investigations of development and formation of coelomic cavities using a comparative anatomical approach revealed considerable differences between Annelida and Panarthropoda already in the earliest steps of coelomogenesis (for review, see Koch et al. 2014). Hence, segmental coeloms in annelids and arthropods are not necessarily homologous structures (Koch et al. 2014). In addition, the developmental origins of coelomic cavities in deuterostomes differ from those in lophotrochozoans and panarthropods (Nielsen 2012). Considering these differences and our results, it is more probable that coelomic cavities evolved independently within the major bilaterian clades Deuterostomia, Ecdysozoa, and Spiralia. Clearly, further analyses of the underlying genetic regulatory networks in coelom formation across a wide variety of coelomate and non-coelomate taxa are necessary to substantiate or reject this conclusion.
The position of coelomate Chaetognatha within Bilateria is also of interest in this aspect, but still enigmatic based on both molecular and morphological data. Deuterostome as well as protostome affinities including a sister group relationship to Spiralia have been proposed (Marletaz et al. 2006; Matus et al. 2006; Dunn et al. 2008; Perez et al. 2014). Moreover, Chaetognatha possess a unique type of coelom formation, heterocoely, which exhibits no strong similarities to the other types of coelom formation (Kapp 2000; Perez et al. 2014) and, hence, might be indicative of a convergent evolution of coelomic cavities in Chaetognatha. However, ultrastructural studies of coelom formation are lacking at the moment (Perez et al. 2014).
The alternative scenario whereupon evolution progressed from complex to simple in Bilateria is mainly based on similarities in segmentation in vertebrates, arthropods, and annelids (De Robertis 2008; Couso 2009; Chesebro et al. 2013). However, in our analyses, Annelida was always deeply nested within Lophotrochozoa. Thus, similar to the evolution of coelomic cavities, a segmented ancestry of Spiralia would imply several independent losses of this organization, which we regard as less parsimonious. Moreover, Annelida and Arthropoda exhibit high plasticity in segmentation and, on the other hand, other spiralian and ecdysozoan taxa exhibit varying degrees of repetitive organization in organ systems. This includes Kinorhyncha, Monoplacophora and Polyplacophora, Eucestoda and other platyhelminths, some nematodes and nematomorphs, and a nemertean (Hannibal and Patel 2013; Struck 2012). In addition, segmentation is mostly restricted to tissue derived from the ectoderm in arthropods, from the mesoderm in vertebrates, and from both germ layers in annelids (Nielsen 2012). A possible explanation for similarities in segment formation including developmental pathways like the notch oscillation could be that these gene regulatory networks have been co-opted from ancestral networks involved in the organization of repetitive organ systems (Davidson and Erwin 2006; Chipman 2010). However, this hypothesis cannot be conclusively proven due to a current lack of data on developmental gene pathways in taxa with such repetitive organ systems (Chesebro et al. 2013). Nonetheless, the spiralian phylogeny derived herein provides additional support for the hypothesis that segmentation evolved independently within Deuterostomia, Ecdysozoa, and Spiralia.
Support for a complex bilaterian ancestor also arose from the observation of neuronal structures called mushroom bodies that were consistently present in arthropods and some annelids, as well as similar gene expression patterns noted in these bodies and in the vertebrate pallium (Heuer et al. 2010; Tomer et al. 2010). However, within annelids, mushroom bodies occur exclusively in five families of the subgroup Errantia, which are all characterized by a high vagility (Heuer et al. 2010; Struck et al. 2011), while they are not known for any other annelid or spiralian taxa (Rothe and Schmidt-Rhaesa 2009; Heuer et al. 2010; Nielsen 2012; Loesel 2014). Thus, if such distinct higher brain centers are taken as an ancestral condition of a complex last common spiralian ancestor (Heuer et al. 2010), several losses within Spiralia, including even several ones within Annelida, have to be assumed. On the other hand, the gastrotrich nervous system consists of a brain with a solid arch-like dorsal commissure with laterally positioned cell somata and a fine ventral commissure as well as a pair of longitudinal, lateroventral nerve cords joining posteriorly (Rothe and Schmidt-Rhaesa 2009). This organization is similar to the organization of the nervous system of Acoelomorpha. Hence, in comparison to the net-like plexus without a cerebral ganglion in non-bilaterian animals, both Gastrotricha and Acoelomorpha express a certain degree of condensation at the anterior end to form a more or less condensed commissural brain, but to a lesser degree than other bilaterian taxa (Rothe and Schmidt-Rhaesa 2009). Thus, Gastrotricha might still exhibit the ancestral bilaterian condition indicative that also the last common ancestor of Spiralia showed that characteristic. Moreover, also, for example, platyhelminths, syndermatans, gnathostomulids, or entoprocts show anterior condensations of the central nervous system, but not to the same degree as in elaborate brains, which can be found in some mollusks or annelids (Northcutt 2012; Loesel 2014). Such a condensation is in general agreement with a small-sized, noncoelomate ancestor for Spiralia showing no complex body organization. On the other hand, the observed similarities in the expression profiles of mushroom bodies of arthropods and annelids as well as the vertebrate pallium support the view that the evolution of more complex brain centers occurred early on in Bilateria (Heuer et al. 2010; Tomer et al. 2010). However, all three organs are part of the olfaction system. Analyses of these expression profiles in the brains of other bilaterian taxa are lacking in the moment. Hence, instead of being indicative of elaborative morphological structures, the observed similar expression profiles could be part of ancestral gene regulatory networks involved in the integration of chemosensory input in clusters of cells of more simply organized brains. However, developmental biological studies of the olfaction system of other bilaterian taxa such as Gastrotricha or Platyhelminthes are required to substantiate either hypothesis.
In conclusion, paraphyly of “Platyzoa” with respect to Lophotrochozoa and the spiralian phylogeny presented herein provide support for the view that the last common ancestor of Spiralia was an organism without coelomic cavity, segmentation, and elaborate brain structures, which probably inhabited the marine interstitial realm. This implies that evolution in Bilateria progressed most likely from a simple ancestor to more complex descendants independently within the three major bilaterian clades. However, we cannot rule out that miniaturization or a progenetic origin of the discussed taxa lead to loss of their morphological complexity. Several such examples are known from annelids and arthropods as in these cases it was more parsimonious to assume secondary simplification than convergent evolution (Jenner 2004b; Bleidorn 2007). However, the above discussion also shows that besides a robust phylogeny of Spiralia and Bilateria developmental biological studies of gene regulatory networks and expression profiles beyond the few standard model organisms are necessary to understand the evolution of Spiralia.
Material and Methods
Data Generation
Supplementary table S1, Supplementary Material online, lists species (four gastrotrich, two flatworms, two wheel animals, one acanthocephalan, one gnathostomulid, as well as two nemertean species) collected for this study. As deeply sequenced transcriptome libraries were lacking for nemerteans, we additionally constructed them for representatives of this taxon. Upon collection, samples were either snap-frozen at −80 °C or stored in RNAlater. Total RNA was isolated using the NucleoSpin RNA XS Kit (Macherey-Nagel) for Rotaria rotatoria and Lecane inermis (both Syndermata, classical Rotifera); the peqGOLD MicroSpin Total RNA kit (peqlab) for Gnathostomula paradoxa (Gnathostomulida), Megadasys sp., Macrodasys sp., Dac. baltica, and Lep. squamata (all Gastrotricha); or the peqGOLD Total RNA kit (peqlab) for Tubulanus polymorphus, Cephalothrix linearis (both Nemertea), Nematoplana coelogynoporoides and Stylochoplana maculata (both Platyhelminthes), and Macracanthorhynchus hirudinaceus (Syndermata, Acanthocephala).
For all species, except the nemerteans, total RNA was reverse-transcribed to double-stranded cDNA with the MINT UNIVERSAL cDNA synthesis kit (Evrogen) to produce amplified cDNA libraries. For R. rotatoria, Gnathostomulida and Gastrotricha a modified amplification protocol, which included an in-vitro transcription step, had been used. For this protocol, the cDNA synthesis was modified to contain 1 mM T7-PlugOligo (5′-C AATT GTAA TAC GAC TCA CTA TAGG GAGAACGGGGG-3′) comprising a T7 promotor sequence instead of 1 mM PlugOligo-3 M in combination with CDS-3 M adapter for the first strand synthesis and 0.1 mM T7-primer (5′-AATT GTAA TAC GAC TCA CTA TAGG-3′) plus 0.1 mM M1-primer instead of 0.2 mM M1-primer for the second strand synthesis. Amplified cDNA was purified using the peqGOLD Cycle-Pure Kit (peqlab), digested with SfiI and size-fractioned using CHROMA SPIN-1000 (Clontech). Purified cDNA was vacuum-concentrated to 15.5 µl and 13 µl was used for the generation of mRNA by in vitro transcription (over night; 37 °C) employing T7 RNA polymerase (reaction conditions: 40 µl with 0.075 mM of each NTP, 1 u/µl RNase inhibitor, 0.5 mM DTT, and 5 u/µl T7 RNA polymerase [Invitrogen]). Messenger RNA was purified using peqGOLD Total RNA kit (peqlab).
The amplified cDNA libraries prepared from platyhelminths and Lec. inermis were sequenced by GENterprise GmbH (Mainz) or the Max Planck Institute for Molecular Genetics (Berlin) by 454 pyrosequencing using standard protocols. Illumina sequencing libraries for Nemertea, Gnathostomulida, and Gastrotricha were prepared with double indices following the protocol described by Meyer and Kircher (2010) and Kircher et al. (2011) starting either with totalRNA (Nemertea) or amplified mRNA (Gnathostomulida and Gastrotricha) as described by Hering et al. (2012). The libraries were sequenced at the Max Planck Institute of Evolutionary Anthropology (Leipzig), using an Illumina Genome Analyzer IIx (GAIIx) with 76 cycles paired end. Total RNA of M. hirudinaceus and amplified mRNA of R. rotatoria were sequenced using an Illumina HiSeq 2000 (100 bp paired end) at the Institute of Molecular Genetics, Johannes Gutenberg University (Mainz). The sequencing library of M. hirudinaceus was additionally run on an Illumina MiSeq machine (150 bp paired end) by GENterprise GmbH (Mainz). Publically available transcriptomes (ESTs and RNA-Seq) and genomic data from 49 spiralian species complemented these data (supplementary table S2, Supplementary Material online). For the choice of outgroup taxa, different considerations have to be taken into account given that platyzoan taxa are eventually affected by LBA. First of all, the outgroup taxa should not introduce additional long branches themselves (Bergsten 2005). Hence, distantly related outgroup taxa should be avoided as well as outgroups exhibiting increased substitution rates (Milinkovitch et al. 1996; Philippe et al. 2011). Therefore, we used only representatives of Ecdysozoa, the sister group of Spiralia, and did not consider nematodes and nematomorphs, which are known to possess long branches themselves. Moreover, more than a single outgroup taxon should be used and the diversity of outgroup taxa should be reflected (Milinkovitch et al. 1996; Bergsten 2005). Thus, we chose representative species of priapulids, kinorhynchs, and pancrustaceans as it has been previously shown that three to four outgroup taxa are sufficient to resolve difficult phylogenies when one also takes into account the computational limitations of phylogenomic studies (Rota-Stabelli and Telford 2008). Finally, the properties of the outgroup taxa sequence data should be similar to the ones of the ingroup taxa (Rota-Stabelli and Telford 2008) and in the case of LBA being more similar to short-branched ingroup taxa than to the long-branched ones. The LB scores show that the chosen ecdsyozoan species are similar to the short-branched spiralian taxa (fig. 2). For other properties, such as proportion of missing data and especially base composition heterogeneity, ecdysozoan taxa are similar to the ingroup taxa (supplementary fig. S5, Supplementary Material online).
Data Assembly
Processing of M. hirudinaceus and R. rotatoria data was performed using the FastX toolkit and included trimming of (I) 12 bp at the 5′-end, (II) adapter sequences, and (III) low-quality bases (cutoff 25). Reads longer than 20 bp after trimming were sorted into intact pairs and singletons using a custom perl script and were subsequently assembled using the CLC Genomics Workbench 5.5 (CLC Bio).
For the GAIIx databases were called with IBIS 1.1.2 (Kircher et al. 2009), adaptor and primer sequences removed and reads with low complexity as well as mispaired indices discarded. Raw data of all libraries were trimmed, discarding all reads with more than 5 bases below a quality score of 15. For 454 pyrosequencing data, sequences were thinned and quality filtered as implemented by Roche. In contrast to those data that were retrieved from the NCBI nr database (i.e., Moniezia expansa) as well as the genomic data present in the lophotrochozoan core ortholog set of HaMStR (i.e., Schistosoma mansoni, Lottia gigantea, Helobdella robusta, Capitella teleta, and Apis mellifera), the other data were further trimmed, quality-filtered and assembled as described in either Hausdorf et al. (2007) or in Riesgo et al. (2012) using the CLC Genomics Workbench with 0.05 as the limit for thinning and the scaffolding option in the assembly.
Sets of orthologous genes were determined using a profile hidden Markov model-based, reciprocal hit triangulation search using a modified version of HaMStR version 8 (Ebersberger et al. 2009) (called HaMStRad and the modified files are available at https://github.com/mptrsen/HaMStRad, last accessed April 24, 2014). As a core set we used the Lophotrochozoa set of 1,253 genes derived from the Inparanoid database (http://inparanoid51.sbc.su.se, last accessed April 24, 2014) for the primer-taxa Cap. teleta, H. robusta, Lo. gigantea, S. mansoni, Daphnia pulex, Ap. mellifera, and Caenorhabditis elegans. Modifications of HaMStR included the usage of Exonerate (Slater and Birney 2005) instead of Genewise (Birney et al. 2004) to provide frameshift-corrected, corresponding nucleotide sequences. We used the representative option with all primer taxa, the relaxed option and a cutoff e value of e−05. Using the representative option might result in the assignment of the same sequence into different sets of orthologous genes. Such redundantly assigned sequences were removed using custom perl scripts, and the responsible bug in HaMStR fixed for future analyses. Each set of orthologous genes was individually aligned using MAFFT-Linsi (Katoh et al. 2005) followed by the determination of questionably aligned positions with AliScore (Kück et al. 2010) and masking with AliCut using default parameters. The 1,253 genes were concatenated into a super-matrix using FASconCAT (Kück and Meusemann 2010) and the super-matrix was reduced based on the phylogenetic signal in a gene by assessing the tree-likeness by quartet-mapping using extended geometry mapping as implemented in MARE (Meusemann et al. 2010). We excluded the species of the core ortholog set S. mansoni, Lo. gigantea, H. robusta, Cap. teleta, Dap. pulex, and Ap. mellifera prior to matrix reduction and used a d value of 0.5 generating the large data set d01 (supplementary fig. S6, Supplementary Material online).
Paralogy and Contamination Screening
The 559 genes present in data set d01 were further screened for paralogous sequences and contamination within single-gene data sets. For this purpose, a screening based on bootstrap maximum-likelihood (ML) analyses of the individual genes (Philippe et al. 2011; Struck 2013) was conducted using TreSpEx (www.annelida.de, last accessed April 24, 2014). Initially, ML analyses were conducted for the unmasked individual genes (supplementary fig. S6, Supplementary Material online). All bipartitions supported by a bootstrap value ≥95 were extracted from the resulting topologies. As a first step all bipartitions congruent with clades for which independent a priori evidence of monophyly exist were masked for the following steps (Struck 2013). The columns “group” and “subgroup” in supplementary table S2, Supplementary Material online, as well as genera with more than one representative indicate these a priori clades. To be conservative, only sequences of bipartitions that exhibited a conflict with these a priori clades were pruned (supplementary tables S4 and Supplementary Data, Supplementary Material online). A conflict in this case meant that species of an a priori clade as well as other species were present in both groups of the bipartition. For example, Platyhelminthes was such an a priori clade and, if in a bipartition platyhelminth as well as other spiralian and/or ecdysozoan species were present in both clades of the bipartition, this was regarded as a strong conflict. Thus, there was a strong conflict in these cases regarding the monophyly of a clade with a priori independent evidence of monophyly. At the group level all, but one clade fulfilled this criterion, that is, showed strong conflicts. The single exception was a clade comprising only all gnathiferan species in that data set eventually reflecting true phylogenetic signal. Previous studies have shown that such a pattern is characteristic for phylogenies of paralogous sequences reflecting the gene tree rather than the species tree (Rodríguez-Ezpeleta et al. 2007; Philippe et al. 2009, 2011; Struck 2013). However, other sources of artificial signal like shared missing data, compositional biases, contamination, or LBA (Bergsten 2005; Lemmon et al. 2009; Simmons and Freudenstein 2011; Simmons 2012a, 2012b; Struck 2013) can also result in such a pattern. In any case, potentially strong misleading signal with significant BS in single gene analyses has been masked by this procedure.
The paralogy screening was followed by a screening procedure for contamination in the libraries of our study. Therefore, the 18 S rRNA sequence of Lineus bilineatus (DQ279932) was blasted against each assembled library (supplementary fig. S6, Supplementary Material online) using BlastN and a cutoff value of e−20. All detected contigs were then blasted against the NCBI nr database using BlastN. If the best hit represented a species from a different supra-specific taxon with the traditional rank of a phylum than the query species, this was taken as an indication of possible contamination (supplementary table S6, Supplementary Material online). For example, for some of the contigs of the Alvinella pompejana (Annelida) library, blast searches resulted in best hits linking the query sequence to the nematod Tripylella sp., the arthropod Ptinus fur, or an uncultured acaulosporan fungus. To prune eventually contaminated sequences from the sets of 559 genes, reference databases were specifically generated for each affected species based on the blast results against the NCBI database. For the Alvinella example, a reference database consisted of the non-redundant proteome information retrieved from the genomes of Ap. mellifera (Arthropoda), Cae. elegans (Nematoda), Schizosaccharomyces cerevisiae (Fungi), and the transcriptome of Dap. pulex (Arthropoda) as negative references as well as from the genomes of Cap. teleta, H. robusta (Annelida), Lo. gigantea (Mollusca), and Schmidtea mediterranea (Platyhelminthes) as positive references. Each of the 559 genes present for that species (e.g., Al. pompejana) was blasted against this species-specific reference database. Three pruning strategies were tested: a sequence was pruned when (I) the best hit was a negative reference sequence, (II) the best hit was a negative reference sequence and in addition the E value was at least one order of a magnitude better than that of the best hit for a positive reference, or (III) the best hit was a negative reference sequence and in addition the E value was at least four orders better than that of the best hit for a positive reference. As ML analyses of the data set d01 with 65 taxa and 82,162 amino acid positions using the three different pruning strategies resulted in no significant differences of the topologies inferred, we chose the most conservative first pruning strategy for subsequent analyses. Custom Perl scripts were written for all these steps.
Phylogenetic Analyses
The most appropriate substitution model was LG+I+Γ as determined using the ProteinModelSelection script for RAxML (Stamatakis 2006). Before the time-consuming Bayesian Inference (BI), we conducted a series of ML analyses as part of the sensitivity analyses and screening procedures (see supplementary fig. S6, Supplementary Material online). In total, 1,129 ML analyses were conducted with RAxML 7.3 (Stamatakis 2006) using 300 and 100 bootstrap replicate searches for concatenated and individual gene data sets, respectively. The bootstrap searches were followed by a search of the best tree. Preliminary analyses using the automatic bootstopping option (Pattengale et al. 2009) (-# autoMRE) in RAxML obtained a maximum of 240 bootstrap replicates for different tested concatenated data sets and, hence, we used 300 replicates for all analyses for reasons of comparability. Moreover, these preliminary analyses showed that a bootstrap search followed by a best tree search always found a tree with an equal or better likelihood score than independent searches for the best tree using 100 replicate searches starting from randomized maximum-parsimony trees.
For the BI analysis, we used PhyloBayes MPI 1.4f (Lartillot and Philippe 2004; Lartillot et al. 2013) using the GTR+CAT model and the data set d02 generated by excluding genes with high degrees of missing data (see sensitivity analyses below). For the analysis, four chains ran in parallel for 13,669 cycles on average (ranging from 12,164 to 14,217). Convergence of likelihood values, alpha parameter, and tree length of the four chains was assessed using Tracer v1.5 (http://tree.bio.ed.ac.uk/software/tracer, last accessed April 24, 2014). Upon convergence the average standard deviation of split frequencies was <0.1 with a value of 0.055. The first 6,000 cycles of each chain were discarded as burnin and the majority rule consensus tree containing the posterior probabilities was calculated from the remaining trees of the chain with the best average likelihood score sampling every second tree.
Sensitivity Analyses
Leaf stability indices of species were determined using Phyutility (Smith and Dunn 2008) and the bootstrap trees of ML analyses of the data set d01 comprising all species sampled. To assess the branch length heterogeneity, we used the herein newly developed LB score using TreSpEx (www.annelida.de, last accessed April 24, 2014), which we also used to calculate classical tip-to-root distances. Taxa were excluded from the data sets d01–d10 in accordance with these results and the phylogenetic reconstructions repeated.
In specific, the score measures for each taxon the percentage deviation from the average and is independent of the root of the tree. The latter is also the reason for not using the traditional tip-to-root distance (Bergsten 2005). When using tip-to-root distances, the recognition of long-branched taxa heavily depends on the root of the tree. For example, in the reconstruction of the individual gene with the ID 111427 in our analyses below the ecdysozoan outgroup species are not monophyletic. Whereas tip-to-root distances based on an Apis-rooted tree and LB scores indicate the same taxa as long-branched, rooting the tree with either Echinoderes or Priapulus some of these species would be indicated as short-branched (supplementary fig. S1, Supplementary Material online). Given the automatic process pipelines in phylogenomic analyses due to the vast amount of genes detection of long-branched taxa should be robust against changes in the root of the tree. Moreover, in the search for the best tree in phylogenetic reconstructions only unrooted trees are used and rooting is an a posteriori procedure. Thus, notwithstanding that outgroup species might be long-branched the artificial grouping of species due to LBA in phylogenetic reconstructions is not directly due to the root by itself (Bergsten 2005). Hence, detection of LBA should be independent of the root. Fortunately, either using the large data set d01 in our analyses below or the 559 individual genes of this data set LB scores and tip-to-root distances are highly and positively correlated with a R2 value of 0.91543 or an average R2 of 0.85684, respectively (supplementary fig. S2, Supplementary Material online).
For data partitioning, we analyzed the 559 genes of the data set d01 generated with the MARE setting “all taxa included” and a d value of 0.5. We determined both alignment- and tree-based properties. Using BaCoCa (Kück and Struck 2014), the proportion of hydrophobic and polar amino acids, the proportion of missing data as well as the compositional heterogeneity as measured by the RCFV values (Zhong et al. 2011) were determined from the pruned and masked alignments across all species in each gene (supplementary fig. S6, Supplementary Material online). ML trees from these alignments were used to determine the evolutionary rate for each gene, calculated as the average pairwise PD between two species in the tree, as well as the mean of the upper quartile of LB scores (i.e., the upper 25% of all LB scores) and the standard deviation of all LB scores as measurements of branch length heterogeneity with the aid of TreSpEx (www.annelida.de). Correlation studies of these properties were conducted in Excel (supplementary figs. S2 and Supplementary Data, Supplementary Material online). Principal component analyses were conducted in R with scaled values (supplementary fig. S3, Supplementary Material online). The determination of the branch length heterogeneity within a gene was based on either the mean of the upper quartile of LB scores or the standard deviation of all LB scores within a gene. However, both approaches led to a strong linear correlation (R2 = 0.8363, supplementary fig. S4, Supplementary Material online) and, thus, we used solely the standard deviation of LB scores as a measure of branch length heterogeneity in the principal component analysis. Similarly, the proportions of hydrophobic and polar amino acids were also strongly correlated (R2 = 0.6481, supplementary fig. S4, Supplementary Material online) and, hence, we excluded the proportion of polar amino acids.
Genes with either high degrees of missing data or high base composition heterogeneity were excluded based on the results of heat map analyses in combination with hierarchical clustering without scaling the values in R (Bapteste et al. 2005; Susko et al. 2006). Four clusters of proportion of missing data were found ranging from low to high degrees of missing data (supplementary fig. S7, Supplementary Material online). From data set d01 genes belonging to the groups with medium-high to high degrees of missing data were excluded to generate data set d02 characterized by only low degrees of missing data. We also generated a data set d03, where we excluded only high degrees of missing data from data set d01. Alternatively, the data set d01 was condensed using MARE (Meusemann et al. 2010) with d values of 1.0, 1.5, or 2.0 instead of 0.5 used above resulting in the data sets d04, d05, and d06, respectively.
For compositional heterogeneity, the heatmap revealed three clusters with low, medium, and high compositional heterogeneity (supplementary fig. S8, Supplementary Material online). Only genes, which were part of the cluster with low compositional heterogeneity, were kept for data set d07. The tree-based property branch length heterogeneity was ranked and divided into three equal parts. To generate data set d08 only the genes from the third with the lowest heterogeneity values were not excluded (supplementary fig. S6 and Supplementary Data, Supplementary Material online). Moreover, we excluded all genes from data set d01, which were not part of the 70% or 95% confidence interval of the first two principal components (supplementary fig. S3, Supplementary Material online) resulting in data sets d09 and d10, respectively. Finally, for each data set we determined the number of single-gene trees, which found a monophyletic or paraphyletic Platyzoa using custom perl scripts. For the latter at least one platyzoan taxon (i.e., Platyhelminthes, Gastrotricha, Gnathostomulida, or Syndermata) had to be placed more closely to the outgroup than at least one other platyzoan taxon.
Acknowledgments
This work was supported by the priority program “Deep Metazoan Phylogeny” of the Deutsche Forschungsgemeinschaft DFG-STR 683/5-2 and DFG-STR 683/8-1 to T.H.S., DFG-Ha2103/4 to T.H., DFG-HA 2763/5 to B.H., and DFG-BL 787/5-1 to C.B. T.H. wishes to thank the Center for Computational Sciences Mainz (CSM) for additional financial support. T.H.S. also acknowledges the support of the Regional Computing Centre of Cologne (RRZK) by, among others, providing access to the HPC cluster CHEOPS for the parallel PhyloBayes analyses. The authors gratefully acknowledge Edyta Fialkowska (Institute of Environmental Sciences, Jagiellonian University, Poland) for providing Lecane specimens, László Sugár (Faculty of Animal Science, Kaposvár University, Hungary) for collecting and providing Macracanthorhynchus specimens, Sanja Ramljak (Institute of Clinical Research and Development, Mainz, Germany) for helping with collecting Seison specimens and Michael Plewka (http://plingfactory.de/) for the picture of Rotaria neptunoida. They also thank Birgit Nickel and Matthias Meyer (Max Planck Institute for Evolutionary Anthropology, Leipzig, Germany) for their assistance in sequencing using Illumina GAIIx and Steffen Rapp (Institute of Molecular Genetics, Johannes Gutenberg University, Mainz) for operating the Illumina HiSeq 2000. Sequence data have been deposited in the NCBI short read archive. All other data and trees used in this study are available at DataDryad (doi:10.5061/dryad.n435p).
References
Author notes
Associate editor: Gregory Wray
