


Abstract
With a combination of adaptive optics imaging and a multi-epoch common proper motion search, we have conducted a large volume-limited (D ≤ 75 pc) multiplicity survey of A-type stars, sensitive to companions beyond 30 au. The sample for the Volume-limited A-STar (VAST) survey consists of 435 A-type stars: 363 stars were observed with adaptive optics, 228 stars were searched for wide common proper motion companions and 156 stars were measured with both techniques. The projected separation coverage of the VAST survey extends from 30 to 45 000 au. A total of 137 stellar companions were resolved, including 64 new detections from the VAST survey, and the companion star fraction, projected separation distribution and mass ratio distribution were measured. The separation distribution forms a log-normal distribution similar to the solar-type binary distribution, but with a peak shifted to a significantly wider value of |$387^{+132}_{-98}$| au. Integrating the fit to the distribution over the 30 to 10 000 au observed range, the companion star fraction for A-type stars is estimated as 33.8 ± 2.6 per cent. The mass ratio distribution of closer (<125 au) binaries is distinct from that of wider systems, with a flat distribution for close systems and a distribution that tends towards smaller mass ratios for wider binaries. Combining this result with previous spectroscopic surveys of A-type stars gives an estimate of the total companion star fraction of 68.9 ± 7.0 per cent. The most complete assessment of higher order multiples was estimated from the 156 star subset of the VAST sample with both adaptive optics and common proper motion measurements, combined with a thorough literature search for companions, yielding a lower limit on the frequency of single, binary, triple, quadruple and quintuple A-type star systems of |$56.4_{-4.0}^{+3.8}$|, |$32.1_{-3.5}^{+3.9}$|, |$9.0_{-1.8}^{+2.8}$|, |$1.9_{-0.6}^{+1.8}$| and |$0.6_{-0.2}^{+1.4}$| per cent, respectively.
1 INTRODUCTION
Binary stars represent the most common product of the star formation process and a key environmental factor for planet formation. Investigating the properties of binary systems, and dependences on age (e.g. Ghez et al. 1997; Duchêne 1999; Patience et al. 2002), environment (e.g. Köhler et al. 2006; King et al. 2012; Sana et al. 2013) and primary mass (e.g. Abt 1983; Lada 2006; Lafrenière et al. 2008; Kraus et al. 2011; Sana & Evans 2011) is therefore crucial to our understanding of star formation. Theoretical binary formation models (e.g. Boss & Bodenheimer 1979; Adams, Ruden & Shu 1989; Bonnell et al. 1991; Bonnell 1994; Clarke 1996; Bate & Bonnell 1997; Kratter et al. 2010a; Stamatellos et al. 2011) and the results of large numerical simulations of star formation within stellar clusters (e.g. Sterzik & Durisen 2003; Moeckel & Bate 2010; Bate 2012; Krumholz, Klein & McKee 2012) require large-scale surveys for empirical comparison.
Previous volume-limited surveys utilizing a range of companion detection techniques, collectively sensitive to all possible binary orbits, have provided observational constraints on the frequency and properties of the binary companions to nearby field FGKM stars and field L and T brown dwarfs (e.g. Duquennoy & Mayor 1991; Fischer & Marcy 1992; Burgasser et al. 2006; Reid et al. 2008; Raghavan et al. 2010). For stars more massive than F-type stars, there are no comparable comprehensive surveys covering the full range of binary orbits. A large number of O- and B-type stars have been observed with speckle interferometry (e.g. Mason et al. 1997; Hartkopf et al. 1999; Mason et al. 2009); however, the samples typically consist of stars at large distances and the technique is limited in magnitude difference sensitivity and separation range coverage. Greater sensitivity to fainter companion has been achieved using adaptive optics (AO) surveys (e.g. Roberts, Turner & ten Brummelaar 2007); however, the sample was magnitude limited, introducing a potential selection bias. For field A-type stars, spectroscopic work has identified systems with short orbital periods (e.g. Abt 1965; Abt & Levy 1985; Carrier et al. 2002; Carquillat et al. 2003). More recently, A-type stars have been the subject of deep AO imaging searches for extreme mass ratio planetary companions (e.g. Vigan et al. 2012; Nielsen et al. 2013), with several planetary systems discovered (Kalas et al. 2008; Marois et al. 2008; Lagrange et al. 2009; Marois et al. 2010; Carson et al. 2013; Rameau et al. 2013). As the planetary population around A-type stars is revealed, the properties of A-type star binaries will serve as an essential comparison.
This paper is the third in a series on the properties of the Volume-limited A-STar (VAST) survey of A-type stars within 75 pc. The survey was designed to have companion mass ratio sensitivity limits (M2/M1 ≳ 0.1) comparable to previous volume-limited multiplicity surveys and to cover projected separations extending from the peak of the solar-type distribution (∼40 au). In previous papers, subsets of the VAST survey were investigated to study the unexpected X-ray emission of A-type stars (De Rosa et al. 2011) and orbital motion of known binaries (De Rosa et al. 2012). In this paper, the comprehensive binary statistics are presented. The full sample is defined in Section 2, followed by the data acquisition of both new AO and literature wide field imaging in Section 3. Data analysis techniques applied to identify and characterize the candidate companions and detection limits in both types of images are detailed in Section 4, and the overall survey completeness is quantified in Section 5. The survey results, including the A-type star binary separation distribution, mass ratio distribution and companion star fraction (CSF), are reported in Section 6. Comparisons of the VAST results with previous survey and theoretical models are made in the discussion, Section 7, along with a combination of the VAST results and previously known binary companions to investigate the higher order multiple systems. Finally, Appendix A describes the procedures employed to estimate the mass and age of the VAST sample members.
2 SAMPLE
To measure the frequency of stellar binary companions, and the distribution of their separations and mass ratios, we have obtained observations of a sample of 435 nearby A-type stars. The sample is composed of two overlapping sets of A-type stars within 75 pc: a 363 star sample observed with AO instrumentation and a 228 star sample investigated with astrometry obtained from all-sky photographic surveys, with an overlap of 156 stars. The 435 observed targets, listed in Tables 1 and 2, were drawn from a volume-limited sample of A-type stars selected from the Hipparcos catalogue (ESA 1997; van Leeuwen 2007). The sample was limited to targets within 75 parsecs, corresponding to an Hipparcos parallax of π ≥ 13.3 mas. High-quality parallax uncertainties (σπ/π ≤ 0.05) are required to place the targets on the colour–magnitude diagram, determine accurate distances to the targets and, consequently, determine the absolute magnitude of any resolved companion candidate. Using the optical magnitudes of each target from the Tycho2 catalogue (Høg et al. 2000), the sample was limited to targets within the A-type star colour range (0.0 ≤ BT − VT ≤ 0.33; Gray 1992). Finally, an absolute magnitude cut-off of MV < 4 was imposed to remove two faint white dwarfs that have colours consistent with A-type stars. Due to their brightness exceeding the magnitude limit of the Tycho2 catalogue (VT ≲ 2.1; Høg et al. 2000), seven nearby A-type stars were not listed within the catalogue – α CMa (Sirius), α Gem, β Leo, α Oph, α Lyr (Vega), α Aql (Altair) and α PsA (Fomalhaut) – and were therefore excluded by the sample selection process.
The VAST sample. Complete table is available in the online version of the article.
| HIP | Spectral | Distance | BT | VT | J | H | KS | Agea | Age | Mass | Separation coverage | |
|---|---|---|---|---|---|---|---|---|---|---|---|---|
| type | (pc) | (mag) | (mag) | (mag) | (mag) | (mag) | (Myr) | ref. | (M⊙) | Adaptive optics | CPM search | |
| 128 | Am... | 70.8 ± 1.7 | 6.73 ± 0.01 | 6.52 ± 0.01 | 6.10 ± 0.02 | 6.06 ± 0.04 | 6.02 ± 0.02 | 180 | 1 | 1.84 | 1.50 ≤ log a < 2.90 | 3.60 ≤ log a < 4.65 |
| 159 | A3 | 62.5 ± 2.1 | 7.26 ± 0.01 | 6.96 ± 0.01 | 6.33 ± 0.02 | 6.27 ± 0.02 | 6.21 ± 0.02 | 60 | 1 | 1.59 | 1.50 ≤ log a < 2.90 | – |
| 1473 | A2V | 41.3 ± 0.4 | 4.59 ± 0.01 | 4.51 ± 0.01 | 4.34 ± 0.27 | 4.42 ± 0.18 | 4.46 ± 0.29 | 200 | 1 | 2.26 | 1.50 ≤ log a < 2.55 | 3.60 ≤ log a < 4.65 |
| 2355 | A7III | 62.8 ± 1.7 | 5.52 ± 0.01 | 5.25 ± 0.01 | 4.86 ± 0.25 | 4.69 ± 0.19 | 4.46 ± 0.03 | 710 | 1 | 2.20 | 1.50 ≤ log a < 2.90 | 3.60 ≤ log a < 4.65 |
| 2381 | A3V | 53.1 ± 0.8 | 5.32 ± 0.01 | 5.18 ± 0.01 | 5.28 ± 0.24 | 4.88 ± 0.08 | 4.83 ± 0.02 | 450 | 1 | 2.09 | 1.50 ≤ log a < 2.90 | – |
aAge rounded to nearest isochrone value. Age estimates from: 1 – this work (CMD), 2 – Zuckerman et al. (2011), 3 – Tetzlaff et al. (2010), 4 – Rhee et al. (2007), 5 – Su et al. (2006), 6 – Rieke et al. (2005), 7 – Perryman et al. (1998), 8 – Barrado y Navascués (1998), 9 – Song et al. (2001), 10 – Westin (1985), 11 – Gerbaldi et al. (1999), 12 – Zuckerman & Song (2004), 13 – Laureijs et al. (2002), 14 – Stauffer et al. (1995), 15 – Paunzen (1997), 16 – Janson et al. (2011), 17 – Torres et al. (2008).
Alternative catalogue identifiers. Complete table is available in the online version of the article.
| HIP | Name | Bayer | Flamsteed | HR | HD | ADS | WDS |
|---|---|---|---|---|---|---|---|
| 128 | 224890 | ||||||
| 159 | 224945 | ||||||
| 1473 | σ And | 25 And | 68 | 1404 | |||
| 2355 | 28 And | 114 | 2628 | 409 AB | J00301+2945 | ||
| 2381 | 118 | 2696 |
| HIP | Name | Bayer | Flamsteed | HR | HD | ADS | WDS |
|---|---|---|---|---|---|---|---|
| 128 | 224890 | ||||||
| 159 | 224945 | ||||||
| 1473 | σ And | 25 And | 68 | 1404 | |||
| 2355 | 28 And | 114 | 2628 | 409 AB | J00301+2945 | ||
| 2381 | 118 | 2696 |
Observing run details.
| Telescope | Instrument | Programme ID | Narrow | Wide | Observed |
|---|---|---|---|---|---|
| filter | filter | starsa | |||
| CFHT | KIR | 2008AC22 | Fe ii | H | 31 |
| 2008AC22 | H2(v = 1 − 0) | K′ | 8 | ||
| 2009BC06 | H2(v = 1 − 0) | K′ | 46 | ||
| 2010AC14 | H2(v = 1 − 0) | K′ | 42 | ||
| 2011AC11 | H2(v = 1 − 0) | K′ | 5 | ||
| Gemini North | NIRI | GN-2008A-Q-74 | Brγ | K′ | 36 |
| GN-2008B-Q-119 | Brγ | K′ | 78 | ||
| GN-2009B-Q-120 | Brγ | K′ | 3 | ||
| GN-2010A-Q-75 | Brγ | K′ | 39 | ||
| Lick | IRCAL | – | Brγ | KS | 81 |
| 2012 SO16 | H2(v = 1 − 0) | KS | 13 | ||
| Palomar | PHARO | – | CH4S | (H)b | 34 |
| – | Brγ | (K)b | 31 | ||
| – | KS | (K)b | 8 |
aThese totals include targets with multiple epochs of observations.
bThe wide-band filter was not used for data obtained with PHARO.
KIR – Doyon et al. (1998).
NIRI (Near InfraRed Imager and Spectrometer) – Hodapp et al. (2003).
IRCAL (IR Camera for Adaptive Optics at Lick) – Lloyd et al. (2000).
PHARO (Palomar High Angular Resolution Observer) – Hayward et al. (2001).
Sources of archive observations.
| CFHT archive | ESO archive | ||
|---|---|---|---|
| Programme ID | PI | Programme ID | PI |
| 97IIH06 | Simon | 070.C-0565(A) | Mouillet |
| 98IF12 | Corcoran | 272.D-5068(A) | Ivanov |
| 98IH02 | Simon | 073.C-0469(A) | Chauvin |
| 99IF59 | Perrier | 074.D-0180(A) | Ivanov |
| 00BF1 | Gerbaldi | 076.C-0270(A) | Galland |
| 01AF11 | Gerbaldi | 076.D-0108(A) | Ivanov |
| 01AH11A | Jewitt | 077.D-0147(A) | Ivanov |
| 01BF21 | Catala | 079.C-0908(A) | Zuckerman |
| 02AF03 | Catala | 080.D-0348(A) | Ivanov |
| 03BH59A | Ftaclas | 081.C-0653(A) | Lagrange |
| 06BF07 | Galland | 382.D-0065(A) | Kervella |
| 07BF04 | Lagrange | 383.C-0847(A) | Schmidt |
| 08AF02/F07 | Beuzit | ||
| 08AF07 | Lagrange | ||
Sources of photographic plates.
| Survey | Filter | Declination range | Date range |
|---|---|---|---|
| ESO | R | −90.0 < δ < −17.5 | 1979–1990 |
| POSS-I | R | −20.5 < δ < +2.5 | 1949–1957 |
| POSS-I | R | +2.5 < δ < +90.0 | 1949–1957 |
| POSS-II | B | +2.5 < δ < +90.0 | 1986–2002 |
| POSS-II | R | +2.5 < δ < +90.0 | 1986–1999 |
| POSS-II | I | +2.5 < δ < +90.0 | 1989–2000 |
| UKST | B | −90.0 < δ < +2.5 | 1974–1993 |
| UKST | R | −90.0 < δ < +2.5 | 1984–1999 |
| UKST | I | −90.0 < δ < +2.5 | 1978–2002 |
Binary companions identified within the AO observations.
| HIP | WDS | ρ | aproj | θ | Band | Δm | M1 | M2 | q | Date |
|---|---|---|---|---|---|---|---|---|---|---|
| desig. | (arcsec) | (au) | (deg) | (mag) | (M⊙) | (M⊙) | ||||
| HIP 128 | AC | 0.98 | 68.9 | 80.6 | K | 3.52 | 1.84 | 0.58 | 0.32 | 20-09-2008 |
| HIP 1473 | a | 6.91 | 285.5 | 146.3 | K | 6.95 | 2.26 | 0.14 | 0.06 | 31-08-2009 |
| HIP 2355 | AB | 2.01 | 126.3 | 15.9 | K | 4.26 | 2.20 | 0.71 | 0.32 | 16-10-2008 |
| HIP 2381 | – | 1.77 | 93.9 | 279.1 | K | 6.23 | 2.09 | 0.23 | 0.11 | 26-09-2007 |
| HIP 2852 | – | 0.93 | 45.4 | 260.6 | K | 5.00 | 1.66 | 0.30 | 0.18 | 17-10-2008 |
| HIP 3277 | – | 13.06 | 875.4 | 252.5 | K | 2.89 | 2.14 | 0.81 | 0.38 | 29-09-2007 |
| HIP 4979 | a,b | 14.50 | 872.0 | 250.0 | K | 5.74 | 1.80 | 0.25 | 0.14 | 16-10-2008 |
| HIP 4979 | a,b | 15.89 | 955.6 | 254.4 | K | 2.72 | 1.80 | 0.81 | 0.45 | 16-10-2008 |
| HIP 5300 | – | 0.11 | 5.8 | 126.7 | K | 0.57 | 2.10 | 1.64 | 0.78 | 20-09-2007 |
| HIP 5310 | – | 0.36 | 16.0 | 175.0 | K | 3.72 | 1.83 | 0.39 | 0.21 | 16-10-2008 |
| HIP 8847 | a | 11.58 | 820.4 | 262.7 | K | 3.66 | 1.87 | 0.54 | 0.29 | 31-08-2009 |
| HIP 9480 | AB | 0.67 | 24.2 | 297.4 | K | 1.20 | 1.93 | 1.17 | 0.61 | 01-09-2009 |
| HIP 9480 | AC | 23.16 | 816.5 | 52.5 | K | 4.31 | 1.93 | 0.31 | 0.16 | 01-09-2009 |
| HIP 11102 | – | 2.28 | 138.8 | 153.8 | K | 5.19 | 1.77 | 0.34 | 0.19 | 07-11-2005 |
| HIP 11569 | AaAb | 0.58 | 23.4 | 43.5 | K | 1.91 | 2.19 | 1.15 | 0.53 | 16-10-2008 |
| HIP 11569 | AB | 2.74 | 111.8 | 230.6 | K | 1.22 | 2.19 | 1.27 | 0.58 | 16-10-2008 |
| HIP 11569 | AC | 7.25 | 295.2 | 115.3 | K | 2.06 | 2.19 | 1.01 | 0.46 | 16-10-2008 |
| HIP 12706 | AB | 2.31 | 56.3 | 298.5 | K | 1.54 | 2.09 | 1.20 | 0.57 | 17-10-2008 |
| HIP 13133 | AC | 7.30 | 473.1 | 71.6 | K | 4.27 | 2.59 | 0.20 | 0.08 | 16-10-2008 |
| HIP 15353 | – | 4.91 | 269.7 | 17.4 | K | 3.91 | 1.71 | 0.40 | 0.23 | 07-11-2005 |
| HIP 16292 | AB | 14.59 | 888.6 | 159.6 | K | 2.76 | 2.32 | 0.93 | 0.40 | 16-10-2008 |
| HIP 17954 | – | 0.20 | 10.5 | 194.8 | K | 0.23 | 1.94 | 1.69 | 0.87 | 14-11-2008 |
| HIP 18217 | – | 1.03 | 52.3 | 65.0 | K | 2.41 | 1.75 | 0.77 | 0.44 | 12-11-2008 |
| HIP 18907 | a | 16.05 | 575.5 | 182.5 | K | 6.12 | 2.35 | 0.28 | 0.12 | 05-02-2010 |
| HIP 20542 | a | 9.98 | 493.9 | 85.4 | K | 6.28 | 2.09 | 0.26 | 0.13 | 17-11-2007 |
| HIP 20648 | AB | 1.82 | 83.1 | 341.4 | K | 2.56 | 2.11 | 1.03 | 0.49 | 04-02-2010 |
| HIP 20713 | a | 10.38 | 509.8 | 146.9 | K | 8.39 | 2.24 | 0.12 | 0.05 | 31-08-2009 |
| HIP 21036 | a | 4.76 | 215.2 | 313.6 | K | 4.73 | 1.87 | 0.43 | 0.23 | 05-02-2010 |
| HIP 21036 | a | 4.96 | 224.3 | 311.3 | K | 4.43 | 1.87 | 0.48 | 0.26 | 05-02-2010 |
| HIP 23179 | AB | 4.87 | 254.8 | 3.5 | K | 1.58 | 2.39 | 1.10 | 0.46 | 17-10-2008 |
| HIP 23296 | AD | 9.17 | 454.7 | 328.2 | K | 7.64 | 1.59 | 0.09 | 0.06 | 05-11-2008 |
| HIP 28614 | AB | 0.40 | 19.1 | 22.0 | K | 1.00 | 2.19 | 1.68 | 0.77 | 19-12-2009 |
| HIP 29711 | – | 4.31 | 280.4 | 239.6 | K | 2.62 | 1.80 | 0.73 | 0.41 | 04-11-2007 |
| HIP 29852 | – | 0.22 | 13.4 | 210.8 | K | 2.00 | 1.95 | 0.94 | 0.48 | 10-11-2005 |
| HIP 30419 | AB | 12.19 | 456.9 | 28.8 | K | 1.87 | 2.05 | 1.19 | 0.58 | 01-09-2009 |
| HIP 31167 | – | 4.50 | 188.2 | 89.8 | K | 3.83 | 1.68 | 0.52 | 0.31 | 24-01-2002 |
| HIP 33018 | a | 2.37 | 137.6 | 295.3 | K | 5.43 | 2.50 | 0.70 | 0.28 | 05-02-2010 |
| HIP 33018 | a | 21.13 | 1224.8 | 297.8 | K | 8.46 | 2.50 | 0.19 | 0.08 | 05-02-2010 |
| HIP 35350 | – | 9.80 | 303.1 | 33.8 | K | 4.09 | 2.39 | 0.61 | 0.26 | 12-04-2008 |
| HIP 41375 | a | 10.58 | 529.1 | 95.7 | K | 6.27 | 1.83 | 0.20 | 0.11 | 08-12-2011 |
| HIP 42313 | AB | 2.71 | 133.3 | 262.7 | K | 5.56 | 2.59 | 0.44 | 0.17 | 27-01-2007 |
| HIP 43584 | AB | 5.17 | 333.2 | 275.5 | K | 4.03 | 2.03 | 0.62 | 0.31 | 09-12-2011 |
| HIP 44127 | AB | 2.39 | 34.7 | 78.4 | K | 4.35 | 1.69 | 0.43 | 0.25 | 05-02-2010 |
| HIP 44127 | AC | 1.89 | 27.5 | 86.7 | K | 4.39 | 1.69 | 0.43 | 0.25 | 05-02-2010 |
| HIP 45001 | AB | 17.72 | 1151.1 | 146.8 | K | 2.84 | 2.07 | 0.90 | 0.43 | 12-01-2005 |
| HIP 45001 | AC | 17.51 | 1137.9 | 147.6 | K | 2.67 | 2.07 | 0.95 | 0.46 | 12-01-2005 |
| HIP 45688 | ABc | 2.62 | 100.4 | 224.5 | K | 1.23 | 2.19 | 1.61 | 0.74 | 12-04-2008 |
| HIP 47204 | – | 0.70 | 50.4 | 9.1 | K | 0.05 | 1.91 | 1.89 | 0.99 | 18-01-2006 |
| HIP 47479 | – | 0.10 | 5.7 | 300.2 | K | 0.08 | 2.18 | 2.10 | 0.96 | 15-02-2008 |
| HIP 48319 | – | 11.78 | 419.8 | 295.4 | K | 5.78 | 2.20 | 0.44 | 0.20 | 12-04-2008 |
| HIP 48763 | – | 3.63 | 244.8 | 153.0 | K | 2.47 | 1.82 | 0.86 | 0.47 | 08-06-2010 |
| HIP 51200 | – | 2.44 | 161.3 | 304.4 | K | 3.18 | 1.96 | 0.72 | 0.37 | 04-02-2010 |
| HIP 51384 | – | 2.08 | 84.3 | 212.4 | K | 4.54 | 1.69 | 0.38 | 0.23 | 12-04-2008 |
| HIP 51907 | a | 6.92 | 425.9 | 95.8 | H | 5.74 | 1.64 | 0.23 | 0.14 | 14-06-2008 |
| HIP 51907 | a | 7.16 | 440.6 | 95.1 | H | 5.66 | 1.64 | 0.25 | 0.15 | 14-06-2008 |
| HIP 55266 | –d | 0.90 | 52.9 | 145.0 | K | 5.61 | 2.33 | 0.43 | 0.18 | 23-07-2010 |
| HIP 55705 | – | 4.98 | 125.6 | 93.1 | K | 2.94 | 1.81 | 0.75 | 0.41 | 05-02-2010 |
| HIP 56034 | AB | 5.46 | 356.1 | 354.2 | K | 1.87 | 2.32 | 1.14 | 0.49 | 23-07-2010 |
| HIP 56083 | a | 9.17 | 616.4 | 232.4 | H | 6.78 | 1.88 | 0.13 | 0.07 | 14-06-2008 |
| HIP 57013 | a | 8.44 | 552.4 | 182.4 | K | 4.52 | 2.35 | 0.49 | 0.21 | 07-02-2005 |
| HIP 57562 | ADd | 2.98 | 176.2 | 293.4 | K | 5.90 | 2.24 | 0.25 | 0.11 | 04-01-2006 |
| HIP 59923 | – | 8.45 | 464.1 | 281.8 | H | 3.34 | 1.94 | 0.68 | 0.35 | 14-06-2008 |
| HIP 61498 | AB | 7.82 | 569.3 | 225.3 | K | 2.73 | 2.53 | 0.45 | 0.18 | 07-03-2005 |
| HIP 64979 | a | 10.54 | 663.8 | 167.4 | K | 8.17 | 1.86 | 0.10 | 0.05 | 05-02-2010 |
| HIP 65241 | – | 0.33 | 20.8 | 197.0 | K | 3.06 | 2.05 | 0.64 | 0.31 | 08-02-2005 |
| HIP 65477 | CaCb | 1.07 | 26.9 | 208.9 | H | 5.80 | 2.30 | 0.33 | 0.14 | 11-04-2008 |
| HIP 66223 | AaAb | 1.38 | 94.7 | 187.7 | K | 5.66 | 1.84 | 0.23 | 0.13 | 13-07-2008 |
| HIP 66249 | – | 1.79 | 41.0 | 154.1 | K | 6.53 | 2.14 | 0.17 | 0.08 | 05-02-2010 |
| HIP 66458 | AB | 1.76 | 107.0 | 101.7 | H | 1.81 | 2.23 | 1.58 | 0.71 | 05-05-2001 |
| HIP 67782 | a | 5.28 | 347.0 | 122.0 | K | 5.37 | 1.97 | 0.34 | 0.17 | 05-02-2010 |
| HIP 69483 | – | 13.55 | 678.7 | 235.5 | H | 2.42 | 2.38 | 1.17 | 0.49 | 11-04-2008 |
| HIP 69592 | – | 4.06 | 243.2 | 174.7 | H | 5.25 | 1.75 | 0.20 | 0.11 | 12-07-2008 |
| HIP 69995 | a | 3.80 | 279.1 | 226.7 | K | 3.46 | 2.16 | 0.66 | 0.31 | 30-06-2004 |
| HIP 70022 | a | 1.84 | 116.3 | 53.4 | H | 6.45 | 1.84 | 0.18 | 0.10 | 07-06-2001 |
| HIP 70400 | a | 3.42 | 166.6 | 244.1 | K | 5.39 | 2.07 | 0.34 | 0.16 | 08-02-2005 |
| HIP 70931 | a | 0.60 | 37.6 | 169.6 | K | 4.63 | 1.77 | 0.23 | 0.13 | 30-06-2004 |
| HIP 76878 | AB | 2.39 | 126.8 | 85.9 | K | 5.48 | 1.84 | 0.27 | 0.15 | 13-07-2008 |
| HIP 76952 | – | 0.68 | 29.8 | 112.7 | H | 1.11 | 2.50 | 1.77 | 0.71 | 11-04-2008 |
| HIP 77660 | – | 0.25 | 11.7 | 71.9 | K | 1.49 | 2.05 | 1.15 | 0.56 | 30-06-2004 |
| HIP 80170 | a | 8.33 | 491.8 | 176.1 | K | 6.95 | 2.50 | 0.46 | 0.18 | 05-02-2010 |
| HIP 80628 | AaAb | 0.67 | 28.7 | 22.6 | K | 2.07 | 1.92 | 0.92 | 0.48 | 12-04-2008 |
| HIP 80953 | – | 16.30 | 1129.8 | 195.6 | K | 2.36 | 2.13 | 1.02 | 0.48 | 24-07-2008 |
| HIP 82321 | AB | 2.08 | 115.1 | 37.8 | H | 2.69 | 2.31 | 1.01 | 0.44 | 12-07-2008 |
| HIP 82321 | AC | 1.83 | 101.4 | 33.7 | H | 3.07 | 2.31 | 0.91 | 0.39 | 12-07-2008 |
| HIP 84012 | AB | 0.58 | 15.6 | 239.8 | K | 0.50 | 2.52 | 2.21 | 0.88 | 12-04-2008 |
| HIP 84379 | ABd | 12.18 | 280.6 | 285.5 | K | 4.56 | 2.15 | 0.46 | 0.21 | 25-07-2008 |
| HIP 85822 | a | 4.50 | 237.4 | 67.3 | K | 7.56 | 2.55 | 0.16 | 0.06 | 01-09-2009 |
| HIP 87813 | a | 1.88 | 138.8 | 60.2 | K | 6.66 | 2.11 | 0.17 | 0.08 | 27-06-2004 |
| HIP 88726 | – | 1.75 | 73.4 | 3.6 | K | 0.12 | 1.43 | 1.41 | 0.99 | 02-07-2009 |
| HIP 88771 | AB | 24.88 | 662.6 | 297.7 | K | 6.35 | 2.08 | 0.21 | 0.10 | 05-02-2010 |
| HIP 90156 | AB | 3.77 | 212.9 | 348.3 | H | 2.05 | 2.23 | 1.10 | 0.49 | 12-07-2008 |
| HIP 91919 | AB | 2.36 | 117.3 | 347.6 | K | 0.57 | 2.13 | 1.76 | 0.83 | 19-06-2008 |
| HIP 91926 | CDe | 2.36 | 112.4 | 259.0 | K | 0.00 | 1.99 | 1.99 | 1.00 | 19-06-2008 |
| HIP 93506 | AB | 0.19 | 5.3 | 31.1 | H | 1.49 | 2.51 | 1.74 | 0.69 | 14-06-2008 |
| HIP 93747 | AB | 7.27 | 185.1 | 46.6 | K | 4.87 | 2.93 | 0.50 | 0.17 | 17-11-2007 |
| HIP 95077 | a | 4.67 | 258.7 | 326.6 | K | 7.07 | 1.87 | 0.15 | 0.08 | 27-06-2008 |
| HIP 95077 | a | 4.74 | 262.5 | 321.8 | K | 6.98 | 1.87 | 0.16 | 0.09 | 27-06-2008 |
| HIP 96313 | a | 15.30 | 927.7 | 101.5 | H | 1.39 | 1.42 | 0.97 | 0.68 | 12-07-2008 |
| HIP 97423 | a | 4.64 | 303.7 | 189.7 | K | 4.20 | 1.93 | 0.49 | 0.25 | 18-06-2008 |
| HIP 98103 | – | 2.83 | 190.4 | 184.4 | K | 5.27 | 2.39 | 0.40 | 0.17 | 18-06-2008 |
| HIP 103298 | AaAb | 0.22 | 13.3 | 115.7 | K | 2.96 | 2.06 | 0.81 | 0.39 | 08-09-2008 |
| HIP 104521 | AB | 0.80 | 29.2 | 257.4 | H | 2.78 | 1.89 | 0.87 | 0.46 | 14-06-2008 |
| HIP 106711 | – | 6.89 | 453.6 | 57.0 | K | 8.62 | 2.20 | 0.12 | 0.05 | 08-09-2008 |
| HIP 107302 | a | 4.29 | 227.4 | 229.0 | K | 4.09 | 1.77 | 0.49 | 0.28 | 24-07-2008 |
| HIP 109667 | – | 1.10 | 69.8 | 284.4 | K | 4.04 | 1.86 | 0.51 | 0.27 | 25-06-2010 |
| HIP 109667 | a | 5.14 | 326.1 | 181.4 | K | 7.49 | 1.86 | 0.10 | 0.05 | 10-09-2008 |
| HIP 109857 | AaAb | 0.44 | 11.5 | 84.0 | H | 3.95 | 1.87 | 0.57 | 0.30 | 14-06-2008 |
| HIP 110787 | – | 0.29 | 18.1 | 211.1 | K | 3.89 | 2.00 | 0.51 | 0.26 | 17-09-2008 |
| HIP 111674 | a | 14.74 | 776.0 | 214.8 | K | 5.64 | 2.20 | 0.45 | 0.21 | 08-09-2008 |
| HIP 113048 | AB | 0.82 | 46.4 | 234.9 | K | 0.89 | 1.83 | 1.32 | 0.72 | 31-08-2009 |
| HIP 116611 | AaAb | 0.95 | 66.6 | 173.1 | K | 5.93 | 2.34 | 0.28 | 0.12 | 29-09-2008 |
| HIP 117452 | ABc | 3.64 | 153.4 | 237.5 | K | 3.75 | 2.47 | 0.58 | 0.23 | 30-08-2009 |
| HIP 118092 | a | 0.35 | 23.4 | 328.8 | K | 3.05 | 2.04 | 0.71 | 0.35 | 04-01-2006 |
aA newly resolved binary without a designation assigned within the WDS catalogue.
bHIP 4979 B is resolved into a binary system itself.
cThe secondary in this pair is a known binary which is unresolved within the AO observations.
dThe primary in this pair is a known binary which is unresolved within the AO observations.
eHIP 91926 CD is a wide CPM companion to HIP 91919 AB.
Binary companions identified within the astrometric search.
| HIP | CPM companion | WDS | ρ | aproj | log a | θ | ΔK | M1 | M2 | q |
|---|---|---|---|---|---|---|---|---|---|---|
| desig. | (arcsec) | (au) | (deg) | (mag) | (M⊙) | (M⊙) | ||||
| HIP 2355 | 2M J00300625+2948173 | a | 192.1 | 12 057.2 | 4.08 | 355.8 | 8.04 | 2.20 | 0.14 | 0.06 |
| HIP 12489 | BD+26 443B | AB | 28.9 | 2048.9 | 3.31 | 0.8 | 2.87 | 2.32 | 0.93 | 0.40 |
| HIP 19990 | HD 284336 | AB | 180.0 | 5209.7 | 3.72 | 118.4 | 2.45 | 1.41 | 0.47 | 0.33 |
| HIP 21547 | GJ 3305 | AC | 66.5 | 1956.8 | 3.29 | 162.5 | 1.88 | 1.39 | 0.62 | 0.45 |
| HIP 22300 | TYC 3737-1375-1 | a | 669.1 | 35 033.6 | 4.54 | 142.4 | 2.44 | 1.61 | 0.75 | 0.47 |
| HIP 23585 | 2M J05041356+4547206 | AB | 44.5 | 2724.4 | 3.44 | 321.8 | 3.37 | 1.42 | 0.25 | 0.17 |
| HIP 23875 | 2M J05074827−0508303 | a | 203.5 | 5575.9 | 3.75 | 11.6 | 5.98 | 2.44 | 0.43 | 0.18 |
| HIP 45688 | 2M J09185718+3649084 | a | 98.7 | 3778.4 | 3.56 | 53.1 | 6.82 | 2.19 | 0.25 | 0.11 |
| HIP 51200 | 2M J10273634+4135220 | a | 102.1 | 6750.9 | 3.83 | 114.2 | 6.31 | 1.96 | 0.20 | 0.10 |
| HIP 55266 | HIP 55316 | a | 500.1 | 29 417.5 | 4.47 | 127.5 | 1.72 | 2.33 | 1.37 | 0.59 |
| HIP 63320 | 2M J12585275+2809512 | a | 612.6 | 43 143.2 | 4.63 | 155.9 | 5.62 | 1.69 | 0.10 | 0.06 |
| HIP 65728 | HIP 65756 | CA | 182.6 | 13 033.3 | 4.12 | 110.2 | 1.05 | 2.37 | 1.55 | 0.65 |
| HIP 69713 | HD 234121 | AB | 39.0 | 1133.7 | 3.05 | 32.8 | 1.97 | 1.81 | 0.80 | 0.44 |
| HIP 74000 | 2M J15071551+1827568 | a | 110.3 | 7967.2 | 3.90 | 321.3 | 2.92 | 2.09 | 0.73 | 0.35 |
| HIP 76878 | 2M J15413725+1828082 | AC | 249.1 | 13 220.0 | 4.12 | 274.1 | 2.77 | 1.84 | 0.74 | 0.40 |
| HIP 80883 | BD+02 3118C | AC | 119.0 | 6316.1 | 3.80 | 169.5 | 4.78 | 2.42 | 0.64 | 0.26 |
| HIP 85829 | HIP 85819 | AB | 62.2 | 1895.9 | 3.28 | 311.2 | 0.08 | 1.70 | 1.67 | 0.98 |
| HIP 85922 | 2M J17332793−0546538 | a | 135.6 | 6524.5 | 3.81 | 192.1 | 5.05 | 1.84 | 0.33 | 0.18 |
| HIP 86263 | 2M J17383714−1514293 | a | 1,059.4 | 34 197.7 | 4.53 | 57.8 | 7.63 | 2.20 | 0.17 | 0.08 |
| HIP 90156 | HD 238865 | AC | 88.7 | 5007.3 | 3.70 | 19.5 | 1.77 | 2.23 | 1.18 | 0.53 |
| HIP 93747 | 2M J19065609+1340323 | a | 1,494.5 | 38 048.5 | 4.58 | 116.9 | 8.14 | 2.93 | 0.14 | 0.05 |
| HIP 97421 | CD-56 7835 | AB | 101.9 | 5049.6 | 3.70 | 333.3 | 2.10 | 1.96 | 0.97 | 0.50 |
| HIP 106786 | 2M J21372826−0755550 | a | 375.6 | 20 567.9 | 4.31 | 221.8 | 6.54 | 2.39 | 0.28 | 0.12 |
| HIP 111674 | TYC 3632-1527-1 | a | 832.6 | 43 822.0 | 4.64 | 190.7 | 4.11 | 2.20 | 0.72 | 0.33 |
aA newly resolved binary without a designation assigned within the WDS catalogue.
Companion star and multiplicity fractions from various surveys.
| Spectral | Type | Separation range | Companion mass | Value |
|---|---|---|---|---|
| type | log (au) | range | (per cent) | |
| A | CSF | 1.5 ≤ log aproj < 2.9 | q ≥ 0.10 | 21.9 ± 2.6 |
| A | CSF | 1.5 ≤ log aproj < 2.9 | q ≥ 0.05 | ≥26.0 |
| A | CSF | 1.5 ≤ log aproj < 4.0 | q ≥ 0.10 | 33.8 ± 2.6 |
| A | CSF | all | M2 ≥ 0.08 M⊙ | 68.9 ± 7.0 |
| A | MF | all | M2 ≥ 0.08 M⊙ | ≥43.6 ± 5.3 |
| BA (ScoCen) | CSF | 1.5 ≤ log aproj < 2.9 | q ≥ 0.10 | 25.1 ± 3.6 |
| BA (ScoCen) | CSF | 1.5 ≤ log aproj < 2.9 | q ≥ 0.05 | ≥28.1 |
| FGK | CSF | 1.5 ≤ log aproj < 2.9 | q ≥ 0.10 | 19.6 ± 2.1 |
| FGK | CSF | 1.5 ≤ log aproj < 4.0 | q ≥ 0.10 | 27.8 ± 2.5 |
| FGK | CSF | all | M2 ≥ 0.08 M⊙ | 61.0 ± 3.7 |
| FGK | MF | all | M2 ≥ 0.08 M⊙ | 46.0 ± 2.0 |
| M | CSF | 1.5 ≤ log aproj < 2.9 | M2 ≥ 0.08 M⊙ | 17.1 ± 5.4 |
| M | CSF | 1.5 ≤ log aproj < 4.0 | M2 ≥ 0.08 M⊙ | 24.6 ± 6.5 |
| M | MF | all | M2 ≥ 0.08 M⊙ | 42.0 ± 9.0 |
| LT | CSF | log aproj ≥ 1.6 | M2 ≥ 0.03 M⊙ | ≤2.3 |
| LT | MF | all | q ≥ 0.20 | 12.5 ± 3.0 |
Companions listed within the literature used in the calculation of the lower limit of the multiplicity fraction.
| HIP | WDS | log Pd | ρ | Reference | HIP | WDS | log Pd | ρ | Reference |
|---|---|---|---|---|---|---|---|---|---|
| desig. | (arcsec) | desig. | (arcsec) | ||||||
| 128 | AB | 0.98 | – | Carquillat et al. (2003) | 54746 | – | – | 3.80 | Tokovinin (2012) |
| 2578 | AaAb | – | 0.10 | van den Bos (1927) | 55266 | – | 0.41 | – | Lloyd (1981) |
| 3414 | – | 0.29 | – | Mannino & Grubissich (1955) | 57562 | AaAb | – | 0.40 | McAlister et al. (1989) |
| 6514 | – | 1.55 | – | Fekel et al. (2011) | 57606 | – | 4.69 | – | Brendley & Mason (2006) |
| 6686 | – | 2.88 | – | Samus, Durlevich & al (2009) | 57646 | – | 0.44 | – | Petrie (1926) |
| 8588 | AB | – | 178.00 | Tokovinin & Lépine (2012) | 58001 | AB | – | 20276.12 | Shaya & Olling (2010) |
| 8903 | – | 2.03 | – | Pourbaix (2000) | 58758 | – | 1.39 | – | Moore (1931) |
| 9153 | AB | – | 37.10 | Halbwachs (1986) | 61932 | AB | 4.49 | 0.50 | Malkov et al. (2012) |
| 9480 | AC | – | 23.20 | Mason et al. (2001) | 61932 | AD | – | 2719.24 | Shaya & Olling (2010) |
| 9836 | – | 1.18 | – | Jones (1931) | 61937 | AC | – | 5590.10 | Shaya & Olling (2010) |
| 10064 | – | 1.50 | – | Pourbaix (2000) | 62983 | – | – | <0.10 | Africano et al. (1975) |
| 11486 | – | – | 0.10 | Horch et al. (2008) | 64692 | – | – | 0.60 | McAlister et al. (1993) |
| 11569 | CaCb | – | 0.40 | Christou & Drummond (2006) | 69483 | BaBb | 3.25 | – | Kiyaeva (2006) |
| 12706 | AC | – | 843.10 | Alden (1924) | 69483 | AC | – | 108.80 | Tokovinin & Lépine (2012) |
| 12828 | – | 3.08 | – | Abt (1965) | 69974 | – | 2.32 | – | Stickland (1990) |
| 13133 | AaAb | 0.08 | – | Duerbeck & Haenel (1979) | 70931 | Aa1Aa2 | 1.07 | – | Kaufmann & Klippel (1973) |
| 15197 | – | 1.25 | – | Abt & Levy (1985) | 71075 | AaAb | – | 0.10 | Morgan et al. (1978) |
| 15197 | – | – | 1383.23 | Shaya & Olling (2010) | 72622 | AD | – | 8977.46 | Shaya & Olling (2010) |
| 16591 | – | −0.04 | – | Rucinski et al. (2005) | 74000 | – | 3.47 | 0.10 | Eggen (1946) |
| 19893 | – | – | – | Samus et al. (2009) | 75695 | – | 3.58 | – | Neubauer (1944) |
| 20087 | – | 3.62 | – | Pourbaix (2000) | 76852 | AB | 3.90 | 0.10 | Muterspaugh et al. (2010) |
| 20713 | – | 3.72 | – | Abt (1965) | 76996 | AB | – | 65.90 | Mason et al. (2001) |
| 20894 | – | 2.15 | – | Torres, Stefanik & Latham (1997) | 77233 | AD | – | 1643.04 | Shaya & Olling (2010) |
| 21029 | – | – | 249.80 | Peterson et al. (1981) | 80628 | – | 1.43 | – | Gutmann (1965) |
| 21039 | – | 1.77 | – | Debernardi et al. (2000) | 80628 | AB | – | 18227.26 | Shaya & Olling (2010) |
| 21273 | 2.69 | – | Abt (1965) | 80883 | AB | 4.67 | – | Heintz & Strom (1993) | |
| 21402 | Aa1Aa2 | 0.55 | – | Lane et al. (2007) | 84379 | AaAb | – | 0.10 | Bonneau & Foy (1980) |
| 21402 | Ab1Ab2 | 0.90 | – | Lane et al. (2007) | 84606 | – | – | 0.92 | Horch et al. (2011) |
| 21402 | AaAb | 3.82 | – | Lane et al. (2007) | 85829 | AaAb | 1.58 | – | Margoni, Munari & Stagni (1992) |
| 21547 | CaCb | – | 0.20 | Kasper et al. (2007) | 86263 | AaAb | – | 0.30 | Isobe et al. (1990) |
| 21644 | – | – | 0.10 | Horch, Meyer & van Altena (2004) | 86263 | Aa1Aa2 | 0.36 | – | Young (1910) |
| 21673 | – | 1.59 | – | Abt & Levy (1985) | 87212 | AaAb | – | 0.10 | McAlister et al. (1987) |
| 22287 | AaAb | – | 0.40 | Horch et al. (2011) | 87212 | AB | – | 209.10 | Lépine & Bongiorno (2007) |
| 23296 | AaAb | 0.91 | – | Fekel et al. (2006) | 89925 | – | 0.74 | – | Fekel, Tomkin & Williamson (2009) |
| 23983 | – | 2.19 | – | Debernardi et al. (2000) | 90156 | AaAb | – | – | Frost (1924) |
| 24340 | – | – | 0.10 | Mason et al. (1999) | 90156 | CaCb | 0.43 | – | Halbwachs, Mayor & Udry (2012) |
| 26309 | AB | – | 1211.97 | Shaya & Olling (2010) | 91919 | ABCD | – | 208.80 | Shaya & Olling (2010) |
| 26563 | – | 2.65 | – | Abt (1965) | 91971 | AaAb | 0.63 | – | Abt & Levy (1985) |
| 28614 | AaAb | 0.65 | – | Muterspaugh et al. (2008) | 91971 | AD | – | 41.10 | Shaya & Olling (2010) |
| 28614 | BaBb | 0.68 | – | Muterspaugh et al. (2008) | 92024 | BaBb | – | 0.20 | Biller et al. (2007) |
| 29850 | AaAb | 3.53 | – | Hartkopf, Mason & McAlister (1996) | 92024 | AB | – | 71.40 | Mason et al. (2001) |
| 30060 | – | – | – | Samus et al. (2009) | 98103 | AB | 0.52 | – | Lucy & Sweeney (1971) |
| 33202 | AB | 5.85 | 7.40 | Hopmann (1974) | 101093 | – | 2.92 | – | Abt (1962) |
| 33202 | AD | – | 152.50 | Tokovinin & Lépine (2012) | 101800 | – | 1.04 | – | Harper (1935) |
| 41081 | AB | – | 1119.82 | Shaya & Olling (2010) | 106786 | – | 3.90 | – | Abt (1965) |
| 42806 | AaAb | – | – | Lee (1910) | 107556 | – | 0.01 | – | Batten & Fletcher (1992) |
| 43970 | AB | – | 975.90 | Shaya & Olling (2010) | 113048 | AaAb | 1.38 | – | Margoni et al. (1992) |
| 45688 | BaBb | – | 0.20 | McAlister et al. (1993) | 113996 | AB | 3.90 | – | Hartkopf et al. (1996) |
| 54214 | – | – | 0.60 | Tokovinin (2012) | 116611 | Aa1Aa2 | −0.30 | – | Rucinski et al. (2005) |
Drawn from the 636 stars which satisfy these selection criteria, the VAST sample consists of 435 A-type stars within 75 pc. The positions of the VAST targets on the colour–magnitude diagram are shown in Fig. 1, and span the full range of A-type stars. A histogram of the distances to the observed targets is shown in Fig. 2, with the VAST sample nearly complete within a distance of 50 pc. In order to convert the measured magnitude difference between an A-type star primary and a resolved companion into a mass ratio for the system, an estimate of the age is required. This is due to the age dependence of the mass–magnitude relation used within this study for A-type stars, and for low-mass M-dwarfs at ages ≲100 Myr. The procedure used for estimating the age and mass of each target is given in Appendix A, with the resulting distribution of ages and masses of the sample given in Figs 3 and 4.
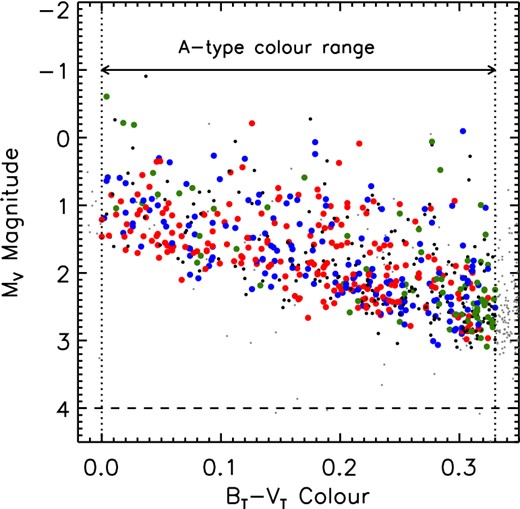
A colour–magnitude diagram demonstrating the selection criteria used to define the volume-limited sample of A-type stars. Of the Hipparcos stars within 75 pc (small grey filled points), those with a parallax uncertainty of σπ/π ≤ 0.05 and with a BT − VT colour consistent with A-type stars were selected (dotted vertical lines) with a magnitude cut-off to remove contamination from faint white dwarfs (dashed horizontal line). Of the 636 stars satisfying these criteria, 156 were observed with adaptive optics and are included within the photographic plate search for common proper motion companions (blue points), 207 targets were only observed with adaptive optics (red points) and 72 were only included within the photographic plate sample (green points). The remaining 201 targets without observations, which otherwise satisfied the selection criteria, are plotted for reference (small black points).
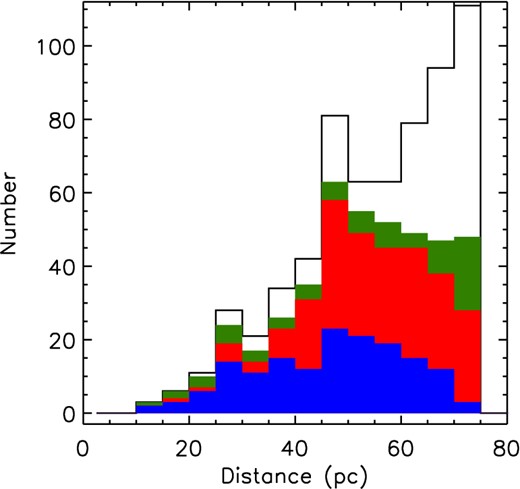
The distribution of distance estimates for the 636 A-type stars within the volume-limited sample. The shading of the histogram indicates whether the target was within both the adaptive optics and photographic plates sample (blue histogram), only the adaptive optics sample (red histogram), only the photographic plates sample (green histogram) or was not within either sample (open histogram). The distance distribution of the observed stars is complete up to approximately 50 pc, beyond which a significant proportion of the volume-limited sample remains unobserved. Targets at close distances were preferentially observed in order to increase the sensitivity to binary companions at small physical separations.
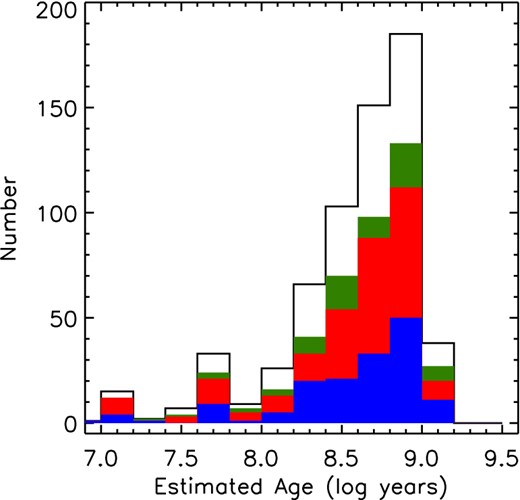
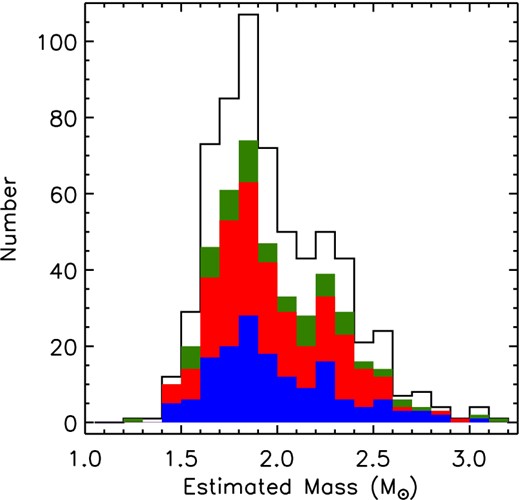
3 DATA ACQUISITION
3.1 Adaptive optics observations
High-resolution AO images of a sample of 363 A-type stars were obtained through a combination of new observations of 257 stars obtained between 2008 and 2011 and archive images of an additional 106 targets. The details of the new AO observations are reported in Table 3, and the archive AO data included in the sample are summarized in Table 4. For the new observations, images were obtained using a near-infrared filter, decreasing the contrast between the bright A-type star primary and any faint companion candidate relative to optical wavelengths. The observational strategy was designed such that the images would be sensitive to companions at the bottom of the main sequence (ΔK ≈ 7–10, depending on the primary), at angular separations of ρ ≥ 1 arcsec. Unsaturated exposures of each target were taken to detect high mass ratio companions at close separations and calibrate the photometry. Longer saturated exposures were also obtained and provided sensitivity to low-mass companions beyond the saturated point spread function of the bright target. A typical unsaturated sequence included exposures obtained with a low-transmission narrow-band filter at a number of dither positions, removing the effect of bad pixels and cosmic ray events. For the observations involving CFHT/KIR, Lick/IRCAL and Gemini/Near InfraRed Imager and Spectrometer (NIRI), saturated exposures were then taken using a wide-band filter at a number of dither positions, significantly increasing the sensitivity of the observations to faint companions at the bottom of the main sequence. Saturated exposures were not obtained using Palomar/Palomar High Angular Resolution Observer (PHARO); instead, a large number of short exposures were combined to achieve sensitivity to faint companions.
In addition to the new observations presented within this study, VLT/NaCo (Lenzen et al. 2003; Rousset et al. 2003) and CFHT/KIR data taken in similar AO snapshot modes were obtained from the ESO and CFHT science archives. Archived observations which were obtained using complex imaging techniques such as angular differential imaging, primarily used to search for extremely faint planetary-mass companions (Marois et al. 2006), are not included in this study. AO images of 184 of the sample members were obtained from the two science archives, providing measurements of an additional 106 targets not observed as a part of our dedicated observing programme.
3.2 Digitized photographic plates
The high angular resolution AO component of the survey was augmented with a search of astrometric catalogues for wide common proper motion (CPM) companions, confirmed with a visual inspection of digitized photographic plates. Astrometric data were obtained from a number of sources: bright CPM companions were identified from a previous analysis of the Hipparcos catalogue (Shaya & Olling 2010), while fainter CPM companions were selected from a union of the SuperCosmos Sky Survey (SSS) Science Archive (Hambly et al. 2001), the PPMXL catalogue (Roeser, Demleitner & Schilbach 2010) and the Fourth US Naval Observatory CCD Astrograph Catalog (UCAC4; Zacharias et al. 2012). In order to estimate the innermost separation at which these catalogues were sensitive to all stellar companions, and to select a subsample of stars with a high apparent motion, digitized scans of photographic plates from the UK Schmidt (UKST), ESO Schmidt and Palomar Oschin Schmidt (POSS) sky surveys (Table 5) were obtained from the SSS Science Archive (Hambly et al. 2001) for each of the 636 stars within the sample.
4 DATA REDUCTION AND CANDIDATE IDENTIFICATION AND CHARACTERIZATION
4.1 Adaptive optics observations
Each science image was processed through the standard near-infrared data reduction process, beginning with a dark frame subtraction, and division by a flat-field. The sky background for each target was estimated from a median combination of the science images obtained at different dither positions, unless dedicated sky frames were taken, and was scaled to and subtracted from each science image. Bad pixels and cosmic ray events were flagged and interpolated over, using both a bad pixel map, generated from the flat-field analysis, and a search for pixel outliers within each image. To increase sensitivity to faint companions and increase the signal-to-noise ratio of any detection, the individual science images obtained for each target were aligned to a common centre and combined through a median combination.
The registration of the unsaturated images was achieved by determining the Gaussian centroid of the target within each image; close companions were masked before centroiding. The images of each target were then shifted using cubic interpolation. Prior to performing a median combination of the images, a radial profile was calculated and subtracted. The median of these aligned images was then calculated to create the final science image. For the saturated images, an estimate of the centroid of the target was determined through an analysis of the diffraction spikes from the secondary mirror supports on each telescope. By cross-correlating the position of the diffraction spikes within each individual saturated exposure of a given target, the offsets required to register each image to a common centre were calculated (Lafrenière et al. 2007). As with the unsaturated exposures, a radial profile was calculated and subtracted from each aligned image, and a final science image was created through a median combination.
Companion candidates were identified through a visual inspection of the final science images. The centroid of each companion candidate was compared with the centroid of the target in order to measure the separation and position angle of the companion. These measurements were converted into an on-sky separation and position angle (ρ, θ) using the pixel scale and angle of North of the detector, estimated from observing an astrometric field (the Trapezium; McCaughrean & Stauffer 1994) or a calibration binary. The magnitude difference measured between each companion candidate and the central target was estimated using aperture photometry, with the flux of the central target scaled as a function of the filter transmission and exposure time for companions resolved within the saturated exposures. The aperture was twice the full width at half-maximum (FWHM) measured within the final science frame, with a sky annulus between six and eight times the FWHM. The uncertainties of the separation, position angle and magnitude difference were estimated from the standard deviation of the astrometric and photometric measurements obtained from each individual exposure prior to combination.
The angular separation of each companion was converted to a projected separation (aproj) using the distance to the primary obtained from the Hipparcos catalogue (van Leeuwen 2007). The magnitude difference between each primary and companion was converted to both a secondary mass (M2) and mass ratio (q = M2/M1), using the absolute magnitude of the primary obtained from 2MASS and theoretical solar-metallicity isochrones (Siess et al. 2000; Baraffe et al. 1998). For candidates at close separations (≲5 arcsec), the absolute magnitude of the primary obtained from the 2MASS catalogue is based on the sum of the flux from both primary and companion. The contamination of the magnitude of the primary caused by the presence of a bright companion was removed using the magnitude difference measured within this study, prior to the estimation of the mass of the companion and the mass ratio of the system. With only one epoch for most targets, the assessment of physical association was based on a statistical cut-off estimated using 2MASS source counts. The spatial distribution of the targets, superimposed on the surface density of 2MASS point sources, is shown in Fig. 5. Using the 2MASS catalogue, a power law was fit to the cumulative number of 2MASS J, H and KS point sources per square arcsecond as a function of magnitude (De Rosa et al. 2011). For each companion candidate resolved within this study, the corresponding probability of finding a 2MASS point source of the same magnitude or brighter within the same radius was calculated. Only companion candidates with less than 5 per cent chance of being a chance superposition were included in the final results and discussion.
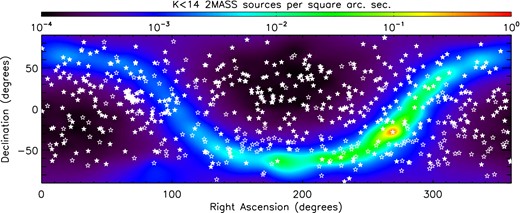
The sample target members are distributed evenly throughout the celestial sphere (open and filled star symbols), with the exception of the Hyades open cluster. The observed and unobserved VAST sample members are shown as filled and open stars, respectively. The surface density of 2MASS point sources with a magnitude of KS < 14, within an area of 1 square arc second surrounding each member of the VAST sample, is depicted by the coloured surface. The path of the Galaxy through the sky is apparent, with the Galactic Centre showing a significant increase in the surface density of 2MASS point sources N(KS < 14) > 10−1.
4.2 Digitized photographic plates
In order to ensure that the CPM companion detections were reliable, a subsample was designed to remove those targets with very small proper motions. As the astrometric data obtained from the SSS Science Archive represent the data set with the shortest time baseline over which to measure proper motions, a lower limit on the total expected proper motion of a bound CPM of 4 pixels (>2.7 arcsec) was applied to the complete sample. Using the longest time baseline between the photographic plates obtained from the SSS Science Archive, and the annual proper motions reported within the Hipparcos catalogue, a sample of 228 stars was selected. As the level of sensitivity to faint stellar companions varies as a function of separation, and the brightness of target itself, the innermost separation to which the astrometric catalogues were sensitive to all stellar companions was estimated from the photographic plates. For each of the 228 targets, the innermost separation was estimated as the separation at which the flux of the primary reduced to 75 per cent of its peak value, a conservative estimate based on an analysis of the magnitudes of the background objects within each field.
Bright (V ≲ 8) CPM companions were drawn from an analysis of the Hipparcos catalogue, taking into account both the proper motions and parallax measurements (Shaya & Olling 2010). Companions below the limiting magnitude of the Hipparcos catalogue were identified based on their proper motion from the three astrometric catalogues described previously; the SSS Science Archive (Hambly et al. 2001), the PPMXL catalogue (Roeser et al. 2010) and the UCAC4 catalogue (Zacharias et al. 2012). Only those objects with a proper motion within 1.5σ of the motion of the primary stated within the Hipparcos catalogue were selected. In order to ensure a CPM companion was not missed during this automated procedure, the position of each source within the astrometric catalogues were marked within the mosaic of each target, revealing the presence of any source not included within the astrometric catalogues.
The relative position and brightness of each identified CPM companion was determined from the astrometry and photometry within the 2MASS catalogue, from which the projected separation and position angle were calculated. The magnitude difference between the target and the comoving companion was converted into a secondary mass and a mass ratio using theoretical solar-metallicity isochrones (Baraffe et al. 1998; Siess et al. 2000), in the same manner as the AO companions. Finally, the CPM companions were plotted on a colour–magnitude diagram (Fig. 6), to reject background objects with similar proper motions but an unphysical location on the colour–magnitude diagram, assuming the primary and companion are at the same distance.
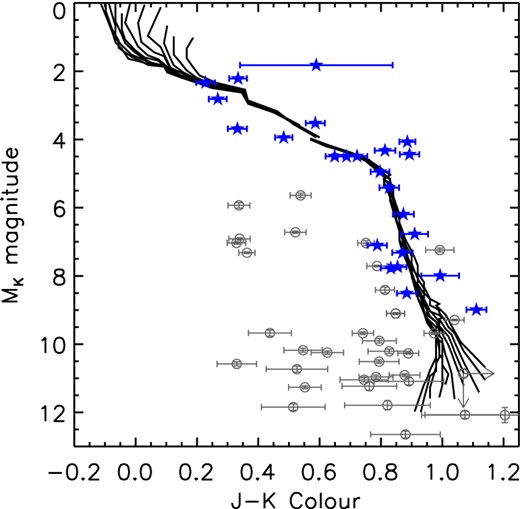
The position of each common proper motion candidate on the colour–magnitude diagram was compared with theoretical isochrones (black lines, Baraffe et al. 1998; Siess et al. 2000) in order to reject background objects with the same apparent motion. Those candidates thought to be physically associated based on their proper motion and position on the colour–magnitude diagram are highlighted (blue stars). Candidates with mass ratios of q < 0.05, but otherwise consistent with being physically associated, were excluded.
5 SURVEY COMPLETENESS
The completeness of the observations was estimated in order to minimize any bias within the distribution of companion properties measured within the survey. For the AO data, a one-dimensional sensitivity curve was created for each image, with the sensitivity limit at radius r calculated as the standard deviation of the image pixel values within a circular annulus of width 2λ/D. The faintest companion to which the data were sensitive was estimated as a signal five times this standard deviation. The largest separation considered for each target was the radius at which at least 90 per cent of the position angles were sampled by the images. For targets with multiple observations, the best contrast achieved at a given separation was used as the formal detection limit at that separation. The average detection limits for observations obtained using each instrument are shown in Fig. 7, while the overall completeness of the survey is given in terms of both observable (ρ, Δm) and physical quantities (aproj, q) in Fig. 8.
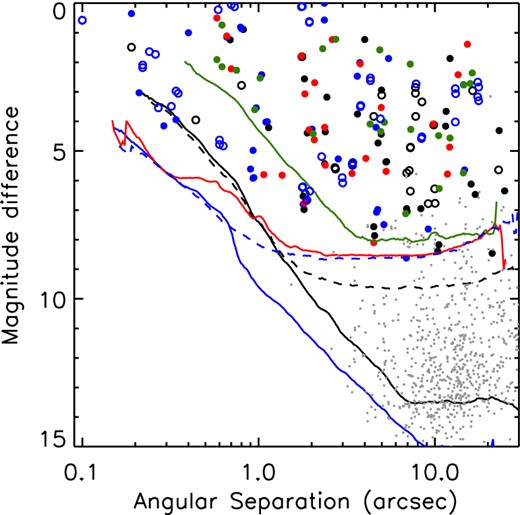
The average sensitivity of the observations obtained using KIR at the CFHT (black solid curve), NIRI at Gemini North (blue solid curve), PHARO at Palomar (red solid curve), IRCAL at the Lick Observatory (green solid curve), and observations obtained from the CFHT/KIR (black dashed curve), and ESO/NaCo (blue dashed curve) science archives. Companion candidates have been coloured corresponding to the instrument with which they were detected, with open circles corresponding to the two archive sources. Those companion candidates which fail the statistical criterion described in this section, or have mass ratios of q < 0.1 are denoted by small grey points. Duplicate observations of the same companion have not been removed from this figure.
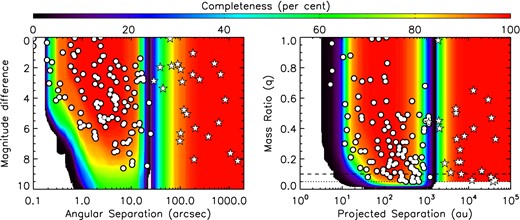
The completeness of the adaptive optics observations (N = 363, ρ ≲ 15 arcsec, aproj ≲ 2000 au) and the analysis of the photographic plates (N = 228, ρ ≳ 15 arcsec, aproj ≳ 2000 au), expressed in terms of (left-hand panel) angular separation and magnitude difference, and (right-hand panel) projected separation and mass ratio. The companion candidates identified within the adaptive optics data set (white filled points) and CPM companions identified within the photographic plates (white filled stars) are plotted. The regions of phase space not sampled by the observations are shown in white for clarity.
6 RESULTS
6.1 Identified companion candidates
The companions identified both within the AO observations and from a search for CPM companions, are plotted as a function of projected physical separation and mass ratio in Fig. 8. A total of 108 companion candidates satisfying the 5 per cent statistical criterion with mass ratios of q ≥ 0.05, corresponding to a companion mass of 0.08 M⊙ around a 1.5 M⊙ primary, were identified within the high-resolution AO observations. The observed and derived parameters of each resolved companion is listed in Table 6. The companions span a range of separations between 0.08 and 23.2 arcsec, and secondary masses spanning from A-type companions (q ≈ 1) to late M-type companions at the bottom of the main sequence (q ≈ 0.05). Of the 113 identified companions within the AO observations, 51 were newly resolved as a part of the VAST survey (De Rosa et al. 2011, 2012), 33 of which are presented for the first time within this paper. These 113 AO imaging companions were complemented by an additional 24 CPM companions, the observed and derived parameters of which are listed in Table 7.
6.2 Separation distribution
The binary separation distribution was constructed over eight equally wide bins in log aproj – four bins spanning log aproj = 1.5-2.9 (∼30–800 au) for the AO companions, and four bins spanning log aproj = 3.25-4.65 (∼1800–45 000 au) for the wide CPM companions. For each bin, the subsample of targets used to determine the frequency of companions within that bin is the set of targets with sensitivity covering 95 per cent of the companion phase space. Within each bin, this companion phase space is defined by the inner and outer edge of the bin, and a mass ratio range of q ≥ 0.1. The frequency within each bin was thus determined from the number of companions with separations within the inner and outer edges of the bin, resolved around targets within the subsample described previously. As the majority of the orbital parameters for each resolved system are not known, the separations within this study are expressed as projected separations, without applying a correction factor to estimate the true semimajor axis (Kuiper 1935; Couteau 1960).
The A-type star binary separation distribution is shown in Fig. 9, with the number of targets used to determine the frequency within each bin listed. Similar to previous multiplicity surveys (Duquennoy & Mayor 1991; Raghavan et al. 2010), a log-normal function was fitted to the measured separation distribution. The resulting fit has a peak located at log aproj = 2.59 ± 0.13, corresponding to |$a_{\rm proj}=387^{+132}_{-98}$| au, and a width of |$\sigma _{\log a_{\rm proj}}=0.79\pm 0.12$|. The measured separation distribution is fit well by a log-normal function, with a slight over-abundance of CPM companions at separations of 4.25 ≤ log aproj < 4.65.
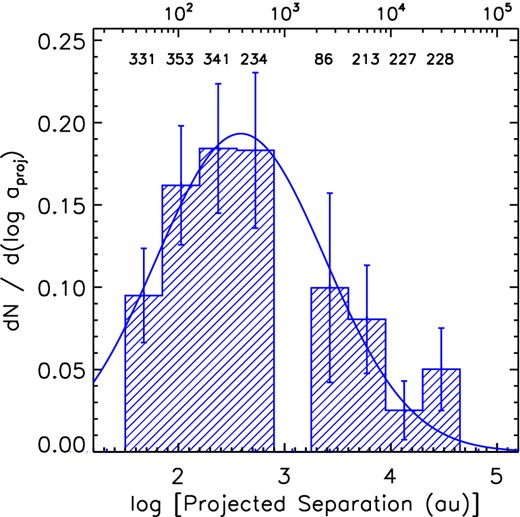
The final separation distribution was created from a synthesis of six subsamples, minimizing the biases introduced by a non-uniform level of completeness to companions within the adaptive optics observations and photographic plates. The separation distribution is constructed from two distinct data sets, the companion candidates resolved within the adaptive optics observations (30–800 au), and the common proper motion companions detected within the photographic plates (1800–45 000 au). The number of stars comprising the subsample used to estimate the frequency of companions within each bin of the distribution are given above the corresponding bin of the histogram. The gap in the distribution is caused by the lack of sensitivity within the adaptive optics observations to wide binary systems (aproj ≳ 103 au), and the saturation of the bright targets within the digitized photographic plates (aproj ≲ 103 au). Assuming a log-normal distribution, as measured in the separation distribution for companions to solar-type stars (Raghavan et al. 2010), the location of the peak of the distribution was estimated as log aproj = 2.59 ± 0.13, corresponding to |$a_{\rm proj}=387^{+132}_{-98}$| au, with a width of |$\sigma _{\log a_{\rm proj}}=0.79\pm 0.12$|.
6.3 Mass ratio distribution
The mass ratio of each companion resolved within this study is shown as a function of projected separation in Fig. 8. The apparent deficiency of q > 0.7 companions resolved beyond ∼100 au suggests that the shape of the mass ratio (q-) distribution may be dependent on the projected separation range over which it is constructed. In order to test this, two q-distributions were constructed from the AO-resolved companions between 30 and 800 au. An inner and an outer q-distribution were constructed, with the dividing separation marched from 30 to 800 au in steps of log aproj = 0.05. The statistical similarity of the two distributions at each dividing separation was determined using a two-sided Kolmogorov–Smirnov (KS) test. A minimum value of the KS statistic was found at a separation of log aproj = 2.1 (125 au), with the inner (30–125 au) and outer (125–800 au) q-distributions being statistically distinct with a KS statistic of 3.47; 10−3. To minimize bias introduced by contamination from background stars falsely identified as companions, which will be most significant at the lowest mass ratios, only those companions with a mass ratio of q ≥ 0.15 were considered when constructing the q-distributions.
The two resulting q-distributions, an inner distribution consisting of companions with separations of log aproj = 1.5–2.1 (30–125 au) and an outer distribution with log aproj = 2.1-2.9 (125–800 au) are shown in Fig. 10. The inner q-distribution, comprising 18 companions resolved around 341 targets, is consistent with a flat distribution, while the outer q-distribution, comprising 35 companions resolved around 266 targets, shows a significant increase in companion fraction as a function of decreasing mass ratio.
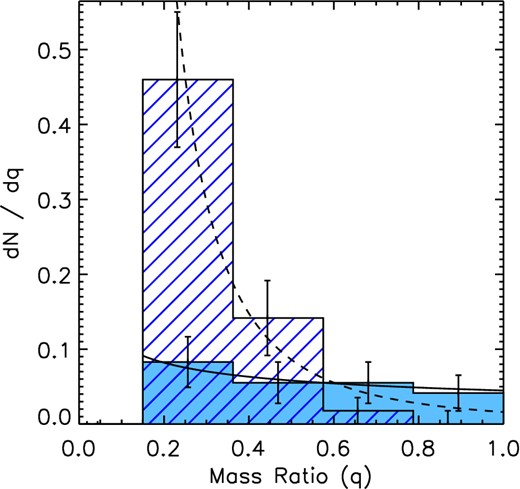
The q-distribution of companions resolved within this study with separations of 30–125 au (filled histogram) and 125–800 au (line-filled histogram). A power law has been fit to the two cumulative distributions, with a power-law index of |$\Gamma = -0.5^{+1.2}_{-1.0}$| for the inner distribution (solid curve), and |$\Gamma = -2.3^{+1.0}_{-0.9}$| for the outer distribution (dashed curve). The distribution shows a greater abundance of lower mass companions within the outer distribution, with the inner distribution relatively flat for companions with q ≥ 0.15.
6.4 Companion star and multiplicity fractions
The total CSF for A-type stars, considering companions at all possible separations, can be estimated by combining the CSF|$_{\rm 30{\rm -}10\,000\,au}$| measurement from this study with the results of previous spectroscopic surveys. These surveys typically measured the frequency of companions to three categories of A-type stars; normal (30.9 ± 7.5 per cent; Abt 1965), metallic lined (63.7 ± 8.4 per cent; Carquillat & Prieur 2007) and chemically peculiar (43.0 ± 6.0 per cent; Carrier et al. 2002). When weighted according to the fraction of the VAST sample within each of these categories (normal – 85.3 per cent, Am – 11.5 per cent, Ap – 3.2 per cent), the weighted frequency becomes 35.1 ± 6.5 per cent. The total CSF for A-type stars was then calculated as the sum of the CSF|$_{\rm 30{\rm -}10\,000\,au}$| measurement from this study, and the weighted frequency from the spectroscopic surveys, a total of 68.9 ± 7.0 per cent (Table 8). Although not significantly higher than the value for solar-type primaries, measured to be 61.0 ± 3.7 per cent (Raghavan et al. 2010), the completeness of the spectroscopic surveys has not been assessed, and binaries with separations of the order of 10 au may have been missed due to their small radial velocity variations over the time period in which they were observed spectroscopically.
Additionally, a lower limit of the MF over all companion separations was estimated for the sample of 156 A-type stars which both have AO observations and were searched for wide CPM companions, providing sensitivity to companions over the widest separation range, and crucial for the best assessment of the frequency of higher order multiples (described in Section 7.6). This lower limit of 43.6 ± 5.3 per cent, listed in Table 8, was calculated using the companions reported within Tables 6 and 7, combined with physically associated binaries recorded within the Washington Double Star Catalog (WDS; Mason et al. 2001), the Ninth Catalogue of Spectroscopic Binary Orbits (SB9; Pourbaix et al. 2004) and eclipsing binaries within the General Catalogue of Variable Stars (GCVS; Samus et al. 2009), which are all listed in Table 9.
7 DISCUSSION
7.1 Comparison samples of different masses and ages
In order to place the results of this volume-limited multiplicity of A-type stars into context, it is necessary to consider samples against which the results will be compared. The results of the VAST survey are compared to volume-limited multiplicity surveys of lower mass solar-type, M-dwarf and brown dwarf primaries (Fischer & Marcy 1992; Reid et al. 2008; Raghavan et al. 2010), allowing for an investigation of the various multiplicity statistics as a function of primary mass. The results cannot be easily compared to more massive stars within the field given the very small number of stars with spectral type earlier than B7 within 75 pc (Abt 2011). The VAST results are also compared with B- and A-type stars within the nearby ScoCen OB association (Kouwenhoven et al. 2005), allowing for a comparison of the multiplicity statistics between cluster and field populations. For each of these comparison samples, the separation and mass ratio of each companion is known, so a fair comparison can be made between the various surveys over a common range of companion separation and mass ratios (Table 8). More recent studies of M-dwarf multiplicity have not been included as comparison samples as these surveys do not have sensitivity to companions with separations ≳200 au (Bergfors et al. 2010; Janson et al. 2012).
7.2 Multiplicity as a function of primary mass
7.2.1 Observed trend
The A-type star CSF was calculated and compared with other samples over two separation ranges – the 30–800 au range continuously covered by the AO data, and the 30–10 000 au range which was estimated from the fit to the separation distribution shown in Fig. 9. The CSF|$_{\rm 30{\rm -}800\,au}$| measured within the VAST survey is plotted alongside the observed CSF30-800 au for solar-type (Raghavan et al. 2010), M-dwarf (Fischer & Marcy 1992) and B- and A-type Sco OB2 (Kouwenhoven et al. 2005) primaries in Fig. 11. The CSF|$_{\rm 30{\rm -}800\,au}$| values for these three literature surveys were restricted to only include companions with a mass ratio of q ≥ 0.1, and projected separations between 30 and 800 au, ensuring a fair comparison between all surveys with a uniform mass ratio limit. For the surveys of nearby solar-type stars and Sco OB2 primaries, the CSF|$_{\rm 30{\rm -}800\,au}$| value could be calculated directly from the table of companions presented within each study. For the survey of nearby M-dwarfs, the CSF|$_{\rm 30{\rm -}800\,au}$| value was estimated from an integration of the frequency of companions per primary per au given over several discrete separation ranges (Fischer & Marcy 1992). In addition to the stellar results, the upper limit to the L-dwarf CSF beyond 40 au is plotted (Allen et al. 2007). The measured CSF for A-type primaries is similar to that of early-type stars within the young Sco OB2 stellar association (Kouwenhoven et al. 2005), when limited to a common separation and mass ratio range (Fig. 11).
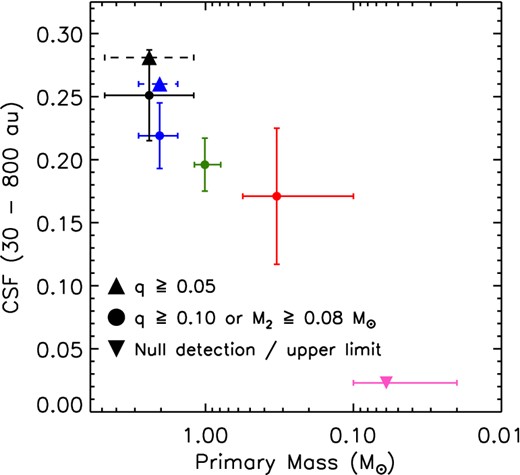
The CSF|$_{\rm 30{\rm -}800\,au}$| measured within the separation range 30–800 au measured for, from left to right, Sco OB2 primaries (black point, Kouwenhoven et al. 2005), field A-type stars (blue point, this study), field solar-type stars (green point, Raghavan et al. 2010), field M-dwarf primaries (red point, Fischer & Marcy 1992). The upper limit for companions to brown dwarfs within this separation range is also shown (pink downward triangle, Allen et al. 2007). A lower limit on the CSF|$_{\rm 30{\rm -}800\,au}$| including all stellar companions to A-type stars (q ≳ 0.05) was estimated by including companions resolved within this study with mass ratios within the range 0.05 ≤ q < 0.1 (blue upward pointing triangle, dashed error bars). Similarly, for the study of Sco OB2 primaries, the CSF including all stellar companions is plotted (black upward pointing triangle, dashed error bars).
While the uniform q ≥ 0.1 limit reaches the bottom of the main sequence for the solar-type and lower mass samples, this limit does not include all stellar companions to A-type stars. To compare the CSF|$_{\rm 30{\rm -}800\,au}$| values with a common companion mass limit, the q limit for the A-type stars needs to be extended to include systems with q ≥ 0.05. For the VAST and Sco Cen OB2 samples, the CSF|$_{\rm 30{\rm -}800\,au}$| was calculated with a limit of q ≥ 0.05, and the values are listed in Table 8 and plotted in Fig. 11. These values represent lower limits to the CSF|$_{\rm 30{\rm -}800\,au}$|, since the data are not uniformly sensitive to companions at these extreme mass ratios.
Extending the range of companion separations considered, the CSF|$_{\rm 30{\rm -}10\,000\,au}$| values were estimated from the fit to the observed companions to solar-type (Raghavan et al. 2010) and M-dwarf (Fischer & Marcy 1992) primaries, and are listed in Table 8 and plotted in Fig. 12. A similar value was not calculated for the Sco OB2 primaries, as the observations were only sensitive to companions with separations within 1600 au. The increase in the CSF as a function of increasing primary mass is apparent over both separation ranges, albeit within the large uncertainty of the CSF for M-dwarf primaries (Figs 11 and 12).
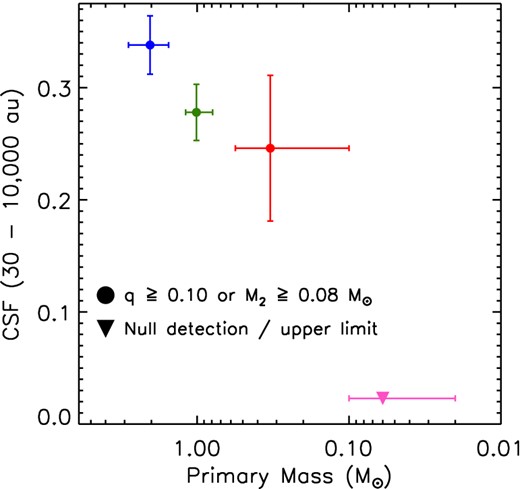
The CSF|$_{\rm 30{\rm -}10\,000\,au}$| is estimated from the log-normal fit to the separation distribution within the range 30–10 000 au for, from left to right, field A-type stars (this study, blue point), solar-type stars (green point, Raghavan et al. 2010) and field M-dwarf primaries (red point, Fischer & Marcy 1992). The upper limit for companions to brown dwarfs within this separation range is also shown (pink downward triangle, Allen et al. 2007).
7.2.2 Theoretical predictions
Hydrodynamical (Bate 2009, 2012) and numerical N-body (Durisen, Sterzik & Pickett 2001; Sterzik & Durisen 2003; Hubber & Whitworth 2005) simulations of stellar clusters predict that the total multiplicity increases with increasing primary mass with different functional forms, as shown in Fig. 13. Both types of models reproduce the observed trend of multiplicity; however, some discrepancies are present when the predictions are examined over a specific mass range. For example, the tight constraint on the measurement of the MF of solar-type primaries is lower than the predictions emerging from the barotropic hydrodynamical simulation (Bate 2009), and numerical N-body interactions (Sterzik & Durisen 2003; Hubber & Whitworth 2005), while being consistent with the radiation hydrodynamical simulation (Bate 2012). As there was not uniform sensitivity to stellar companions to A-type primaries over the full range of companion separations, only a lower limit to the MF was estimated. Combining the results of the VAST survey with known binaries resolved in previous interferometric, spectroscopic and AO imaging surveys, leads to a lower limit on the total MF shown in Fig. 13. The comparison to the various simulations would suggest a significant number of companions interior to ∼30 au remain unresolved.
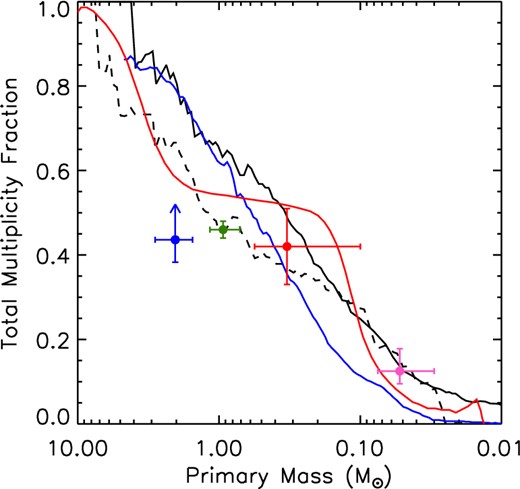
The measured multiplicity fraction of four stellar clusters simulations as a function of primary mass. The results of barotropic and radiation hydrodynamical simulations are plotted as black solid and dashed lines, respectively (Bate 2009, 2012), a numerical Monte Carlo calculation looking at small-N interactions are plotted as a solid blue line (clusters with N < 10 stars; Sterzik & Durisen 2003), and an ensemble of small N-body clusters are plotted as a solid red line (a ring of N = 6 stars, with mass dispersion of σlog M = 0.2; Hubber & Whitworth 2005). Overplotted for reference are, from left to right, the lower limit on the multiplicity fraction of A-type stars measured within this survey, and the observed multiplicity fraction of nearby solar-type (Raghavan et al. 2010), M-dwarf (Fischer & Marcy 1992) and brown dwarf (Reid et al. 2008) primaries.
7.3 Separation distribution
7.3.1 Comparison with previous observations
The trend of a wider separation peak to the distribution as a function of increasing primary mass is consistent with previous multiplicity surveys of brown dwarf (Burgasser et al. 2006) and M-dwarf (Fischer & Marcy 1992) primaries (Figs 14 and 15). The log-normal fit to the measured distribution is also significantly narrower than the solar-type companion separation distribution, with a standard deviation of σlog a = 0.79 ± 0.12 compared to σlog a ≈ 1.68 for solar-type companions (Fig. 14), although the fit to the solar-type separation distribution included companions at all separations. Extrapolating the fit to the A-type star companion separation distribution to closer separations suggests a complete lack of companions with separations of log aproj < 0, inconsistent with known spectroscopic companions to normal and metallic-lined A-type stars (Abt 1965; Carquillat et al. 2003). These spectroscopic systems are not included within the separation distribution plotted in Fig. 9, as the companion mass ratio sensitivity limits are not quantified. It is evident that further investigations are required in order to fully constrain the shape of the separation distribution, with wide-field direct imaging filling the gap in the separation distribution between the AO observations and photographic plates presented within this work, and observations with high-order AO systems providing sensitivity to companions of mass ratio q ≥ 0.1 with projected separations between 10 and 100 au. For companions at separations interior to the angular resolution of AO instruments, radial velocity monitoring provides the only method sensitive enough to detect companion with mass ratios as extreme as q = 0.1, with current-generation interferometric techniques restricted by their limited dynamical range.
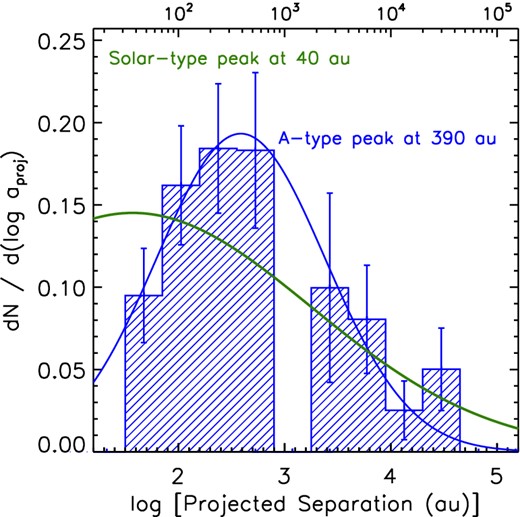
The separation distribution (blue histogram) and corresponding log-normal fit (blue curve), are plotted alongside the log-normal fit to the separation distribution of companions resolved within the Raghavan et al. (2010) survey (green curve).
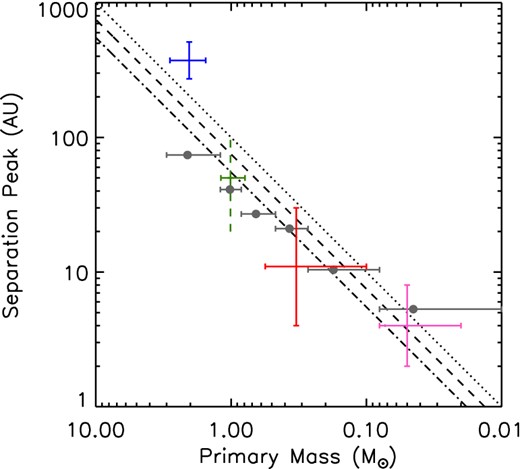
The location of the peak of the separation distribution as a function of primary mass for, black data points from left to right; A-type (this study), solar-type (Raghavan et al. 2010), M-dwarf (Fischer & Marcy 1992) and brown dwarf (Burgasser et al. 2006) primaries. As the uncertainty in the location of the peak of the separation distribution was not provided by Raghavan et al. (2010), the corresponding vertical error bar is dashed. The observations show a clear trend of an increase in the peak of the distribution as a function of primary mass, similar to the theoretical predictions from dynamical simulations (grey points; Sterzik & Durisen 2003) and from models of secondary fragmentation (black lines; Whitworth & Stamatellos 2006).
7.3.2 Comparison with theoretical models
Simulations of dynamical interactions within stellar clusters and numerical calculations of companion formation through disc fragmentation both predict an increase in the location of the peak of the separation distribution as a function of increasing primary mass, and the different predictions are shown in Fig. 15 (Sterzik & Durisen 2003; Whitworth & Stamatellos 2006). These results are consistent with hydrodynamical simulations showing stellar binaries have a wider median separation (∼26 au) than brown dwarf binaries (∼10 au), although the latter result may be affected by the resolution limit of the calculation (Bate 2009).
Measurements of the position of the peak of the companion separation distribution for lower mass primaries are consistent with these predictions (Fischer & Marcy 1992; Burgasser et al. 2006; Raghavan et al. 2010), while the A-type star separation peak occurs at a wider separation than expected (Fig. 15). Although this peak occurs at a significantly wider separation than that of resolved planetary-mass companions to nearby A-type stars (Kalas et al. 2008; Marois et al. 2008; Lagrange et al. 2009), the dynamical interaction between a disc and a companion at the typical separation of ∼390 au may lead to a truncation of the disc to a radius as small as ∼50 au (Artymowicz & Lubow 1994). Interior to the disc truncation radius, the perturbations induced by the companion may significantly affect the planet formation process (Nelson 2000; Kley & Nelson 2008). This would suggest that a majority of A-type star binaries, and as such a significant minority of A-type stars in general, may not be amenable to the formation of planetary-mass companions.
7.4 Mass ratio distribution
7.4.1 Comparison with previous observations
Determining how the q-distribution changes as a function of separation for different primary masses will allow for a greater insight into the various formation processes for binary companions which may dominate over different separation regimes. As the q-distribution for companions to A-type stars has been divided into two statistically distinct subsamples (Fig. 10); a similar technique was applied to the companions resolved around solar-type stars (Raghavan et al. 2010). The inner and outer subsamples were found to be most statistically distinct at a dividing separation of log a = 1.5 (∼30 au), with a KS statistic of 9.92 × 10⁻⁹. The inner and outer q-distributions are plotted in Fig. 16, showing that lower mass companions to solar-type primaries are preferentially found in wider orbits. The cumulative q-distribution of these two distinct subsamples are plotted in Fig. 17, alongside the two cumulative distributions measured for companions to A-type primaries, and the functional form of the cumulative q-distribution of companions to brown dwarf primaries (Burgasser et al. 2006). By fitting a power law to each of the five distributions, the best-fitting power-law index was estimated and plotted as a function of separation (Fig. 18). This shows a trend of a greater frequency of lower mass companions at wider separations for both A-type and solar-type primaries, although the A-type comparison is made over a significantly narrower separation range. The cumulative q-distribution for companions to M-dwarf primaries is not plotted, although the results of recent surveys are consistent flat distribution between 1 and 200 au (Bergfors et al. 2010; Janson et al. 2012).
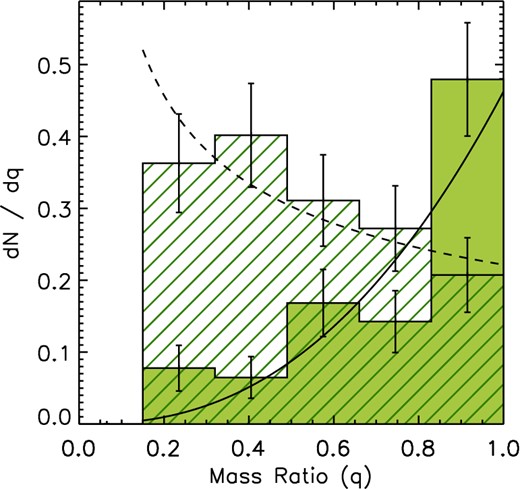
The q-distribution of companions resolved to solar-type stars, with separations ≤30 au (filled histogram), and those with separations >30 au (line-filled histogram). The separation and mass ratio of each component were obtained from fig. 11 of Raghavan et al. (2010). The two populations are statistically distinct, with a KS statistic of 10−8. A power law has been fit to the two cumulative distributions, with a power-law index of |$\Gamma =2.5^{+0.9}_{-1.3}$| for the inner distribution (solid curve), and |$\Gamma =-0.5^{+0.5}_{-0.4}$| for the outer distribution (dashed curve).
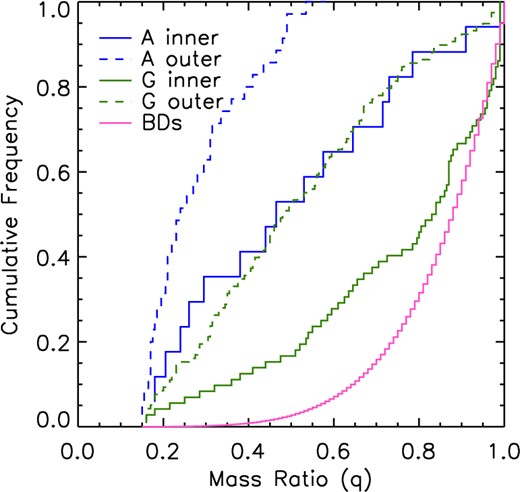
The cumulative q-distribution for companions resolved around A-type primaries, with separations of 30–125 au (blue solid histogram – inner distribution) and 125–800 (blue dashed histogram – outer distribution). The greater frequency of lower mass companions within the outer distribution is apparent. For solar-type primaries, a similar division into an inner and outer distribution was performed, with those companions with separations of ≤30 au (green solid histogram – inner distribution) and >30 au (green dashed histogram – outer distribution). Each cumulative q-distribution only include those companions with mass ratio of q ≥ 0.15. The functional form of the observed q-distribution for companions to brown dwarf primaries is also plotted, considering all companions resolved with separations ≥2 au (pink solid histogram, Burgasser et al. 2006).
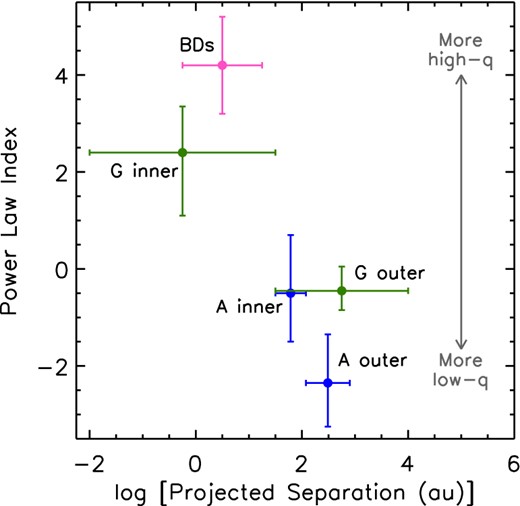
The power-law index best fitted to the cumulative q-distributions presented in Fig. 17, for A-type primaries (blue points), solar-type primaries (green points) and brown dwarf primaries (pink point). The data are indicative of a trend of a greater frequency of equal-mass companions at closer separations, for both A-type and solar-type primaries.
7.4.2 Comparison with theoretical models
Two binary formation scenarios are thought to pre-dominate over the 30–10 000 au separation range to which this study is complete, the initial fragmentation of a pre-stellar molecular cloud (e.g. Boss & Bodenheimer 1979; Bonnell et al. 1991) and fragmentation of a large circumstellar disc (e.g. Adams et al. 1989; Bonnell 1994; Woodward, Tohline & Hachisu 1994). The initial fragmentation of a cloud prior to the formation of protostellar objects can produce binary systems with separations ranging between 101 and 104 au, with a wide range of companion mass ratios (Boss 1986; Bonnell et al. 1991; Bonnell & Bastien 1992; Bate, Bonnell & Price 1995). A scale-free fragmentation model, in which the companion q-distribution is independent of the initial clump mass (Clarke 1996), can be tested against the observations presented here. The initial fragmentation model predicts an MF which is weakly dependent on primary mass, and a mass ratio distribution which is independent or weakly dependent on primary mass. These predictions are inconsistent with both the observed trend in multiplicity as a function of primary mass for stellar primaries (Figs 11 and 12), and the observed variation in the companion q-distribution between companions to solar-type and A-type primaries (Fig. 17). Star formation within a more clustered environment may introduce a dependence on primary mass, with more massive primaries having q-distributions skewed towards less massive companions (Bonnell & Bastien 1992; Bate 2001). Simulations of the dynamical decay of small clusters, formed through the fragmentation of an initial cloud (Sterzik & Durisen 1998), have produced companion q-distributions which are consistent with observed companion q-distributions, and its dependence on primary mass.
Subsequent to the fragmentation of an initial cloud, the conservation of angular momentum causes the infall of material from the surrounding cloud to form a protostellar disc (Bonnell 1994). These discs can fragment to produce substellar and stellar companions, provided that a mechanism for the disc to become gravitationally unstable, and subsequently cool efficiently, is present (e.g. Kratter et al. 2010a). This formation process is thought to be more important for more massive stars (Kratter 2011), due primarily to the large reservoir of material within the massive discs of these stars (e.g. Fukagawa et al. 2010). This process may lead to a significant number of disc-born lower mass companions to more massive stars (Kratter, Murray-Clay & Youdin 2010b; Stamatellos et al. 2011), with the preferential equalization of the mass ratios of those binaries formed at close separations (Bate & Bonnell 1997; Bate 2000).
The measured q-distribution presented within this study, with a greater abundance of lower mass companions around more massive stars, is consistent with predictions from both initial and disc fragmentation. The shape of the q-distribution for companions resolved between 30 and 800 au is consistent with a population of disc-born companions (Kratter et al. 2010b), and such companions are within a separation range coincident with the extent of known circumstellar discs of pre-main sequence A-type stars (e.g. Dent et al. 2006; Hamidouche, Looney & Mundy 2006; Fukagawa et al. 2010). For the widest companions, formation via disc fragmentation is not possible, and the observed frequency of wide (≥103 au) binary companions is consistent with a population of companions formed through initial fragmentation (Bonnell & Bastien 1992). In reality, the observed population is likely a synthesis of, at least, these two types of fragmentation. Hydrodynamical simulations which incorporate both of these processes are able to produce companions over a wide range of separations (Bate 2009, 2012), consistent with the observed separation distribution for solar-type stars, although these simulations are not yet large enough to include a statistically significant number of A-type stars.
7.5 Multiplicity of A-type star subsamples
Metallic-line (Am) A-type stars are distinct from normal A-type stars due to an over-abundance of heavy elements within their observed spectra, with the notable exception of calcium and scandium (Boffin 2010). These anomalous abundances can be explained by diffusion within the stellar atmosphere (Michaud 1980; Talon, Richard & Michaud 2006), which can only occur for stars with rotational velocities of v ≲ 100 km s−1 (Michaud et al. 1983). As they do not possess sufficiently strong magnetic fields to induce magnetic breaking (Conti 1970; Aurière et al. 2010), Am stars must either form with a lower rotational velocity than normal A-type stars, or this initial fast rotational velocity is reduced through the tidal breaking caused by an orbiting companion (Roman, Morgan & Eggen 1948). In order to effectively reduce the rotational velocity of the primary necessary for diffusion to occur, the companion must be on a relatively short orbit with P ≲ 35 d (Budaj 1997), consistent with the observed abundance of short-period spectroscopic companions to Am stars (Abt & Levy 1985; Carquillat & Prieur 2007). For the 50 stars within the VAST sample classified as metallic-lined within the SIMBAD data base, an MF of |$58.0^{+6.5}_{-7.1}$| per cent was estimated based on a combination of those companions resolved in this study, and those previously reported within the literature. This is significantly higher than the multiplicity fraction for the sample of 371 normal (non-Am non-Ap) A-type stars, at |$37.6^{+2.6}_{-2.4}$| per cent, a discrepancy which can be attributed to the relatively large number of known spectroscopic components to the Am stars within the VAST sample (e.g. Abt 1962; Abt & Levy 1985; Carquillat & Prieur 2007).
Like Am stars, chemically peculiar (Ap) A-type stars are also observed to have low rotational velocities (Abt, Chaffee & Suffolk 1972). The low frequency of close binary companions to Ap stars is inconsistent with the tidal breaking mechanism used to explain the low rotational velocities of Am stars (Babcock 1958; Carrier et al. 2002), and instead an alternate mechanism involving magnetic breaking is thought to pre-dominate (Abt & Snowden 1973). The strong magnetic fields measured in non-HgMn Ap stars precludes the presence of a close binary companion (Abt & Snowden 1973), consistent with the observed deficiency of binary companions with periods ≲3 d (Carrier et al. 2002). With the full VAST sample, only 14 stars are classified as being chemically peculiar (Ap) within the SIMBAD data base. Combining those companions measured within this study with known literature companions (Table 9), we find an MF of |$50.0^{+12.4}_{-12.4}$| per cent for this Ap subsample, somewhat larger than, but still consistent with, the MF of the non-Am non-Ap subsample of 371 stars of |$37.6^{+2.6}_{-2.4}$| per cent.
Another subsample of A-type stars of particular note are those known to host extrasolar planets, of which two such examples exist within the VAST sample – β Pic (HIP 27321; Lagrange et al. 2009) and HR 8799 (HIP 114189; Marois et al. 2008, 2010). No stellar companions were identified to either of these stars within the AO observations presented within this study, and no wide CPM companions were identified up to a separation of 45 000 au around either HR 8799, consistent with previously published analyses (Close & Males 2009) and β Pic. Although β Pic was not originally included in the wide CPM companion search described in Section 4.2 due to its relatively low proper motion, it is included here for completeness. This subsample was expanded by including all known exoplanet-hosting main sequence A-type stars which were not included within the VAST survey – Fomalhaut (Kalas et al. 2008), κ And (Carson et al. 2013) and HD 95086 (Rameau et al. 2013). Excluding the known comoving companions to Fomalhaut, TW PsA (Luyten 1938; Shaya & Olling 2010) and LP 876-10 (Mamajek et al. 2013), no additional wide CPM companions up to a separation of 45 000 au were identified using the same procedure as described in Section 4.2. Assuming that all of the stellar components within each system have been resolved, the MF of the known exoplanet-hosting A-type stars can be estimated as 20|$^{+25}_{-8}$| per cent, a preliminary approximation given the extremely small sample size.
7.6 Higher order multiples
Separations of less than 30 au are not fully covered by the VAST survey, but combining the spatially resolved systems from this study, with spectroscopic, speckle and interferometric binaries (Mason et al. 2001; Pourbaix et al. 2004) allowed for a lower limit estimate of the population of higher order multiples. Among the 156 VAST targets which had both AO observations and were searched for CPM companions – providing sensitivity to the widest range of separations – the number of single, binary, triple, quadruple and quintuple systems were 88, 50, 14, 3 and 1, respectively (|$56.4_{-4.0}^{+3.8}$|, |$32.1_{-3.5}^{+3.9}$|, |$9.0_{-1.8}^{+2.8}$|, |$1.9_{-0.6}^{+1.8}$|, |$0.6_{-0.2}^{+1.4}$| per cent). These relative frequencies are comparable to the ratio of multiple systems measured for solar-type stars (Raghavan et al. 2010), although the A-type star frequencies will change as new components are resolved. Expanding the analysis to include the full VAST sample of 435 stars, the relative frequencies remain statistically consistent, with the number of single, binary, triple, quadruple and quintuple systems found to be 259, 129, 37, 8 and 2, respectively (|$59.5_{-2.4}^{+2.3}$|, |$29.7_{-2.1}^{+2.3}$|, |$8.5_{-1.1}^{+1.5}$|, |$1.8_{-0.4}^{+0.9}$|, |$0.5_{-0.1}^{+0.6}$| per cent). Schematic representations of the 47 systems with three or more components are given in Fig. 19.
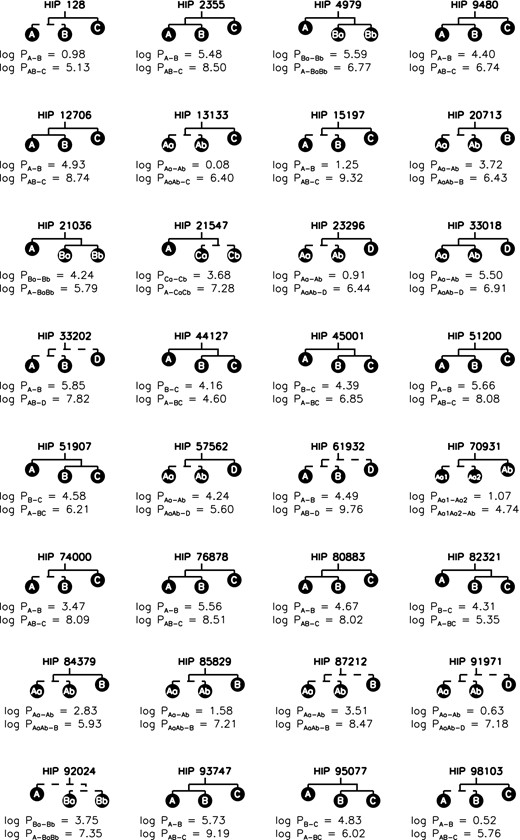
Schematic representations of the higher-order multiple systems, combining those systems resolved within this study and previously known systems obtained from the literature. The components which were not resolved within this study are indicated by a dashed connection - for example, the B component of the HIP 128 system was not resolved as it is a spectroscopic binary with a ∼10 d period. The period is given for each hierarchical system, obtained from either a spectroscopic orbit fit, or an estimate based on the projected physical separation.
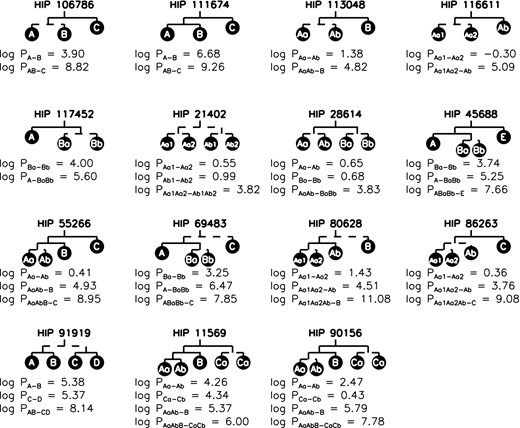
– continued
Of the 37 triple systems, 27 consist of a tight binary system orbited by a distant, typically lower mass component. The remaining 10 systems are composed of a single primary, with a distant pair of lower mass components in a tight orbit. A preference of hierarchical triple systems consisting of a tight binary orbited by a more distant tertiary is found for solar-type primaries (Raghavan et al. 2010), and while a similar preference is observed for A-type primaries, significant observational biases still exist. The greater frequency of this type of system would suggest that a more distant pair in a wide orbit around a single primary is either formed less frequently, or more susceptible to dynamical processing. Fig. 20 shows the ratio of the inner and outer period plotted as a function of the inner period for the 37 triple systems. All of the triple systems with a single primary and a distant pair in a tight orbit are found closer to the stability limit; however, this also coincides with the portion of the diagram to which the AO observations are sensitive to companions. To determine if the clustering of these single plus wide binary systems near the stability limit is simply an observational bias, high-resolution measurements of the secondary components of wide binary systems identified within this study are required in an attempt to resolve them into hierarchical triples.
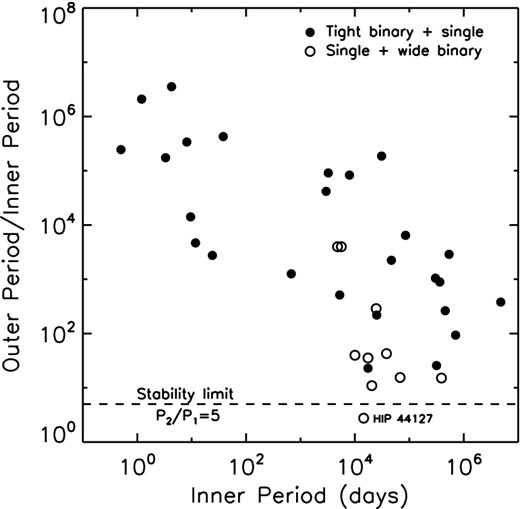
The ratio of the outer and inner period plotted as a function of the inner period for hierarchical triple systems consisting of a tight binary and a wide tertiary component (filled circles), and those consisting of a single star with a distant pair of lower-mass components in a tight orbit (open circles). For binary systems without an orbital period, the period has been estimated from the projected separation. The stability limit of P2/P1 = 5 is also shown (dashed line), with systems below this line being susceptible to dynamical processing (Eggleton 2006). The only hierarchical triple system found to be in a potentially unstable configuration within this study is indicated.
Of the eight known quadruple systems, three are of ϵ Lyr-type, consisting of two pairs of binaries, with similar mass ratios and orbital periods, in a wide orbit (Tokovinin 2008). The remaining five quadruple systems, and the two higher order systems, are all multilevelled hierarchical systems, potentially products of multiple fragmentation events during the star formation process. All of these hierarchical multiple systems represent ideal candidates for orbital motion monitoring work. With sufficient orbital coverage, model-independent mass estimates can be derived for each component within the system (e.g. Köhler, Ratzka & Leinert 2012), a useful diagnostic of evolutionary models (e.g. De Rosa et al. 2012).
Two of the hierarchical systems within this study were found to have low period ratios, indicative of a dynamically unstable system (Eggleton 2006); a triple system consisting of a single primary and a wide pair in a tight orbit (HIP 44127 A-BC; ι UMa), and the widest binary component of a higher order system (HIP 11569 AB-CaCb; ι Cas). Both of these systems have indications of youth (Plavchan et al. 2009; De Rosa et al. 2012), which would be consistent with an unstable dynamical configuration (Zhuchkov et al. 2012). As the outer period in both cases are based on the projected separation measured within the AO observations, the systems cannot be conclusively described as unstable – measurements of the true semimajor axes are required.
8 SUMMARY
We have obtained high angular resolution AO observations of 363 nearby (D ≤ 75 pc) A-type stars in order to characterize the population of binary companions to these intermediate mass (M = 1.5-3.0 M⊙) stars. Combining these AO data with a search for wide CPM companions of 228 A-type stars using all-sky photographic plates, resulted in sensitivity to separation ranges of 30–800 au for the AO data and 1800–45 000 au for the CPM search. A total of 137 companions were identified, consisting of 113 AO companion candidates with ≥95 per cent chance of being physically associated and 24 wide CPM companions confirmed by an analysis of their proper motion and position on the CMD. Of the resolved binary population, 64 were newly identified as companions as a result of this study.
Over a restricted separation range of 30–800 au, we measure a CSF of 21.9 ± 2.6 per cent (Fig. 11), compared with 19.6 ± 2.1 per cent for solar-type primaries (Raghavan et al. 2010), and 17.1 ± 5.4 per cent for M-dwarf primaries (Fischer & Marcy 1992). The results are indicative of a trend of increasing multiplicity as a function of increasing primary mass, although the significant error bars prevent this from being a conclusive result (Figs 11 and 12). This trend is consistent with predictions of the frequency of binary systems determined from numerical simulations (Sterzik & Durisen 2003; Hubber & Whitworth 2005; Bate 2009, 2012), although the functional form of the increase does differ in all but the latter simulation (Fig. 13).
The distribution of companion mass ratios over the 30–800 au range was found to consist of two statistically distinct distributions, consisting of AO companions resolved interior to, and exterior to, a separation of ∼125 au. The inner distribution was measured to be flat for companions with q ≥ 0.15, while wider systems consisted preferentially of lower mass companions (Fig. 10). By performing a similar analysis on the field solar-type data (Raghavan et al. 2010), we find a similar pattern of a greater frequency of lower mass companions at wider separations (Fig. 16). The relative abundance of equal-mass companions at close separations in both this study, and for solar-type primaries, is consistent with the equalizations of the masses of companions at close separations (Bate & Bonnell 1997; Bate 2000). For wide companions (aproj ≳ 125 au), the high frequency of lower mass companions may be indicative of a large population of companions formed through either initial (Bonnell & Bastien 1992) or disc fragmentation (Kratter et al. 2010a).
We have presented the first comprehensive multiplicity statistics for A-type stars over a wide separation range, with sensitivity extending to the lowest mass stellar companions. These results are crucial for providing empirical comparisons to theoretical predictions of binary star formation over a range of stellar masses, and companion separations, and comparisons to previous multiplicity surveys of lower mass primaries. An important extension of this survey would be to search for companions interior to the detection limits of the AO data presented within this paper (aproj ≲ 30 au). Interferometric and spectroscopic monitoring of these targets will provide sensitivity to companions interior to this limit, and future high-contrast AO instruments can be used to tightly constrain the population of low-mass stellar companions to these stars within a more restricted separation range of 10–100 au.
The authors wish to express their gratitude for the constructive comments received from the referee, H. A. Abt. The authors wish to thank M. R. Bate, R. J. Parker and K. M. Kratter for their useful comments and suggestions which helped to significantly improve the paper. The authors also wish to thank N. J. McConnell for helping to obtain a subset of the AO observations, and his contributions to various aspects of this study. The authors gratefully acknowledge several sources of funding. RJDR was funded through a studentship from the Science and Technology Facilities Council (STFC) (ST/F007124/1). RJDR gratefully acknowledges financial support received from the Royal Astronomical Society to fund collaborative visits. JP is funded through support from the Leverhulme Trust (F/00144/BJ) and the STFC (ST/F003277/1, ST/H002707/1). AV acknowledges support from the STFC grant ST/H002707/1. Portions of this work were performed under the auspices of the US Department of Energy by Lawrence Livermore National Laboratory in part under Contract W-7405-Eng-48 and in part under Contract DE-AC52-07NA27344, and also supported in part by the NSF Science and Technology CfAO, managed by the UC Santa Cruz under cooperative agreement AST 98-76783. This work was supported, through JRG, in part by University of California Lab Research Programme 09-LR-118057-GRAJ and NSF grant AST-0909188. Based on observations obtained at the Canada-France-Hawaii Telescope (CFHT) which is operated by the National Research Council of Canada, the Institut National des Sciences de l'Univers of the Centre National de la Recherche Scientifique of France and the University of Hawaii. Based on observations obtained at the Gemini Observatory, which is operated by the Association of Universities for Research in Astronomy, Inc., under a cooperative agreement with the NSF on behalf of the Gemini partnership: the National Science Foundation (United States), the Science and Technology Facilities Council (United Kingdom), the National Research Council (Canada), CONICYT (Chile), the Australian Research Council (Australia), Ministério da Ciência e Tecnologia (Brazil) and Ministerio de Ciencia, Tecnología e Innovación Productiva (Argentina). The authors also wish to extend their gratitude to the staff at the Palomar Observatory and the UCO/Lick Observatory for their support and assistance provided during the course of the observations. This research is partly based on data obtained from the ESO Science Archive Facility. This research has made use of the SIMBAD data base, operated at CDS, Strasbourg, France. This publication makes use of data products from the Two Micron All Sky Survey, which is a joint project of the University of Massachusetts and the Infrared Processing and Analysis Center/California Institute of Technology, funded by the National Aeronautics and Space Administration and the National Science Foundation. This research has made use of the Washington Double Star Catalog maintained at the US Naval Observatory. This research has made use of data obtained from the SuperCOSMOS Science Archive, prepared and hosted by the Wide Field Astronomy Unit, Institute for Astronomy, University of Edinburgh, which is funded by the UK Science and Technology Facilities Council. This research used the facilities of the Canadian Astronomy Data Centre operated by the National Research Council of Canada with the support of the Canadian Space Agency.
Based on observations obtained at the Canada–France–Hawaii Telescope (CFHT) under programme IDs 2008AC22, 2009BC06, 2010AC14 and 2011AC11. Based on observations obtained at the Gemini Observatory under programme IDs GN2008A-Q-74, GN-2008B-Q-119 and GN-2010A-Q-75. See Table 4 for details of data obtained from the CFHT and European Southern Observatory (ESO) archives.
NOTE ADDED IN PRESS
While the manuscript was being proofed, an investigation of the companion to HIP 96313 resolved within the AO data set revealed it to be a background giant star, based on its brightness and extremely red colour. At ∼930 au, it lies outside of the projected separation ranges considered when constructing the separation and mass ratio distributions (30–800, 1800–45 000 au), and as such this misidentification has a minimal effect on the final statistics presented within this study. An investigation performed on the remaining AO-resolved binary companions revealed no additional contaminations of a similar nature.
REFERENCES
APPENDIX A: AGE AND MASS ESTIMATES
In order to convert the measured magnitude difference between an A-type primary and any resolved companion into a mass ratio, an estimate of the age of the primary is required due to their rapid evolution away from the zeroage main sequence. Age estimates can be obtained for A-type stars by virtue of membership of a known moving group (e.g. Zuckerman & Song 2004; da Silva et al. 2009), the detection and characterization of debris disc excesses (e.g. Rieke et al. 2005; Su et al. 2006) or the location on a colour–magnitude diagram (e.g. Paunzen 1997; Song et al. 2001). The limited rotational breaking experienced by an A-type star during its short lifespan precludes age estimation through gyrochronology techniques (Barnes 2003), and chromospheric indicators are not reliable due to the breakdown in the correlation between activity and age for stars with a colour index of B − V ≤ 0.5 (Mamajek & Hillenbrand 2008).
The position of a star on the colour–magnitude diagram is impacted by several factors – the presence of a binary companion, rapid rotation and metallicity. A binary companion increases the brightness and shifts the colour to redder values by an amount dependent on the spectral type of the companion. If the shift in magnitude and colour induced by the presence of a companion is not removed, the stars age will be overestimated based on its position on the colour–magnitude diagram. By incorporating the results of this imaging binary survey and previous spectroscopic and interferometric results, we have corrected the positions of the sample stars on the colour–magnitude diagram in an attempt to eliminate the effect of the companions and to determine more accurate ages.
Two factors not considered in this study that can influence stellar ages are stellar rotation and metallicity. Regardless of spin axis orientation, a rotating star will have an older age estimate than a non-rotating star (Collins & Smith 1985), as the locus of shifted locations in the colour–magnitude diagram forms a fan-shape extending to brighter magnitudes for pole-on rotators and redder colours for equator-on rotators, with the apex at the non-rotating position (see fig. 1 in Collins & Smith 1985, and fig. 2 in Gray 2007). While not all A-type stars in this sample have vsin i values, the range of measured values is 10–317 km s−1, with an average and standard deviation of 124 ± 67 km s−1 based on the 350 with measurements reported in the Extended Hipparcos Compilation (XHIP; Anderson & Francis 2011). The effect of rotation has been assessed to over-estimate ages of early-type stars by ∼30–50 per cent (Figueras & Blasi 1998) and becomes prominent when vsin i > 100 km s−1 (Song et al. 2001). The fact that rotation can only make an A-type star appear older on the colour–magnitude diagram may be an explanation as to why ages of known moving group members within the VAST sample, when estimated using the technique described in this section, were often found to be significantly older than the canonical moving group age.
The metallicity of a star can bias the age estimate in both directions – if a star has a higher metallicity than assumed for the isochrones, the age will be overestimated, while the age will be underestimated if the metallicity is lower than assumed. Again, not all the stars have measured metallically, but for the 108 with [Fe/H] values, the average is near solar at −0.06 ± 0.51 (Anderson & Francis 2011), and as such the net effect on the overall age distribution should be small. Since the rotation and metallicity is not measured for all stars, and the theoretical isochrones used to determine the ages are for the non-rotating case, we have not adjusted the age estimates for either of these effects.
Of the 435 stars with either AO observations, or with proper motions sufficient for the search for CPM companions, 55 are known members of coeval moving groups or stellar clusters with literature ages (Table A1), and 64 have age estimates within the literature derived from theoretical evolutionary models (Table A2). For the remaining 316 stars, the age was estimated based on a comparison of the position of the star on the V − K versus MK colour–magnitude diagram against theoretical stellar isochrones (Siess et al. 2000). As the presence of a bright binary companion, at an angular separation less than the resolving limit of the Tycho2 and 2MASS catalogues, can introduce a significant shift in the position of a star on the colour–magnitude diagram, the colour and magnitude of the primary was corrected based on the expected V − K colour and MK magnitude of the companion. The magnitude and direction of these corrections were estimated by constructing a series of isochrones which are shifted due to the presence of a hypothetical binary companion (Fig. A1). Given that the magnitude difference between the primary and companion is known, or the mass ratio of the system in the case of double-lined spectroscopic binaries, the set of binary isochrones corresponding to the configuration of the system can be selected and used to obtain the predicted shift in the position of the primary on the colour–magnitude diagram (Fig. A2). Combining the companions resolved within this study, with binary companions reported within either the WDS or SB9 catalogues, the positions of 61 stars were corrected (Fig. A3). With an age estimates obtained for the observed sample (Fig. A4, Table 1), a mass-magnitude relation was constructed for each target in order to estimate the mass of the star and any resolved companions (Fig. A5). The increasing luminosity of an A-type star, as it evolves away from the zero-age main sequence, leads to a dependence on the mass derived from mass–magnitude relations as a function of age. Similarly, for the youngest M-dwarf companions resolved within this study, a dependence on age of the mass–magnitude relation is caused by the contraction of these low-mass stars on to the main sequence within the first 100 Myr of their lifespan, significantly decreasing their luminosity (e.g. Stauffer 1980; Fig. A5, right-hand panel). For each star within the sample, the mass is estimated using the K-band magnitude obtained from the 2MASS catalogue, after correction due to the presence of any known companions within the resolution limit of the 2MASS observations (Fig. A3). The distribution of estimated masses is given in Fig. 4, with the estimate for each star presented in Table 1.
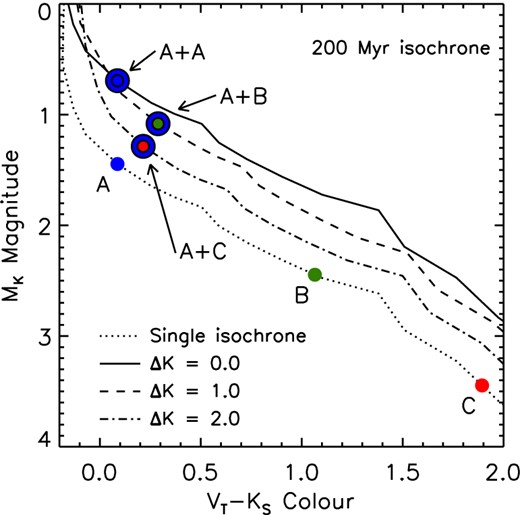
The presence of a companion unresolved within the Tycho2 and 2MASS catalogues can lead to a significant shift in the position of the primary on the colour–magnitude diagram. An example is shown demonstrating the expected shift in the position of a star with an absolute magnitude of MK = 1.4 (A), due to the presence of an equal mass companion (A+A), a companion with a magnitude difference of ΔK = 1 (A+B) and ΔK = 2 (A+C). For the case of a binary system with two identical components, the primary is only shifted in the magnitude direction, with no change in the colour of the system. The presence of a lower mass companion (B, C) can lead to a significant reddening of the system. This procedure is repeated for each position within the single star isochrone (dotted line) to produce a binary isochrone including the effect of a binary companion at range of magnitude differences (ΔK = 0, solid line; ΔK = 1, dashed line; ΔK = 2, dot–dashed line).
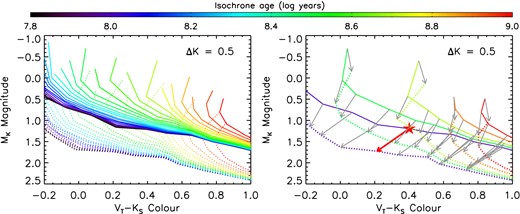
Left-hand panel: a set of binary isochrones was constructed for the full range of isochrone ages available within the models, for each value of the magnitude difference. The example shows the single star isochrone (dotted lines), and the corresponding binary star isochrone for the case of a ΔK = 0.5 companion (solid lines). As the shift in the position of each point on the isochrone is based on an estimate of the companion properties derived from the theoretical models, this process can be carried out for a range of visual magnitude differences (ΔV), for companions resolved with interferometry, or mass ratios (q), for double-lined spectroscopic binaries. Right-hand panel: the magnitude and direction of the shift required to correct the position of the primary on the colour–magnitude diagram due to the presence of a ΔK = 0.5 companion unresolved within the Tycho2 and 2MASS catalogues. For clarity, only a subset of the single star (dotted lines) and binary isochrones (solid lines) are shown (108, 108.5, 108.7, 108.9 and 109 yr). At each point on the binary isochrone, a vector is plotted showing the magnitude and direction of the correction required to remove the contamination induced by the presence of the companion (grey arrows). As an example, for a binary system with an observed MK(AB) = 1.15 and (V − K)AB = 0.4 (red filled star), with a magnitude difference of ΔK = 0.5, the correction estimated for the magnitude and colour is shown (red vector). This correction has reduced the age estimate of this hypothetical primary from 500 to 100 Myr.
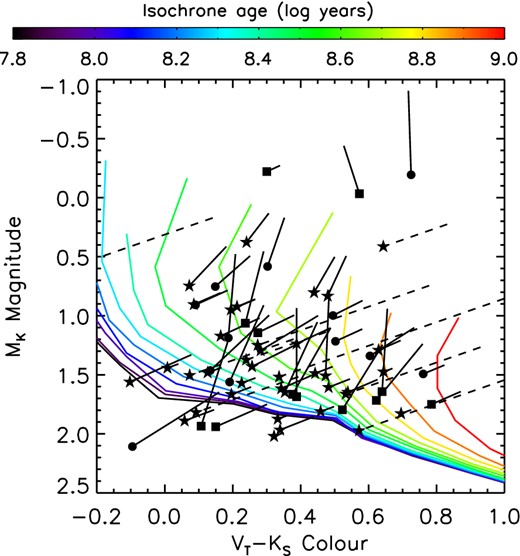
The position of 61 stars is changed due to a presence of a bright binary companion unresolved in either one of, or both, the Tycho2 and 2MASS catalogues. The magnitude and direction of the shift necessary to correct the star (solid line – unresolved in both catalogues, dashed line – unresolved only in 2MASS) is estimated based on the predicted colour and magnitude of the companion derived from the theoretical isochrones. The corrected position of each star is given by a filled symbol, depending on the method through which the companion was resolved. The companion properties are estimated using either the magnitude difference measured within this study (ΔK, filled stars), the magnitude difference reported for companions resolved with interferometric techniques (ΔV, filled circles) or the mass ratio calculated for a double-lined spectroscopic binary (q, filled squares). Theoretical isochrones from Siess et al. (2000) are plotted within the range 7.8 ≤ log t ≤ 9.0, in steps of Δlog t = 0.1.
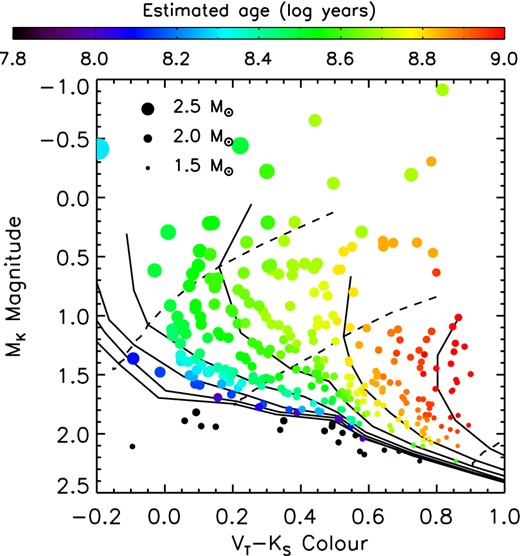
A colour–magnitude diagram of the 316 stars without age estimates presented within the literature. The colour of each symbol denotes the age estimated for each star based on a comparison to theoretical solar-metallicity isochrones (Siess et al. 2000), with the size being proportional to the mass estimated from the theoretical mass–magnitude relations. The theoretical isochrones are plotted within the range 7.8 ≤ log t ≤ 9.0, in steps of Δlog t = 0.2 (solid lines), alongside the theoretical evolutionary tracks for a 2.5, 2.0 and 1.5 M⊙ star (dashed lines, left to right).
Literature ages of known moving groups.
| Moving group | Number | Age | Age |
|---|---|---|---|
| of stars | (Myr) | Reference | |
| TW Hydrae | 1 | 8 | Stauffer, Hartmann & Barrado y Navascues (1995) |
| β Pictoris | 5 | 12 | Zuckerman et al. (2001) |
| Tucana-Horologium | 8 | 30 | Zuckerman et al. (2011) |
| Argus | 2 | 40 | Torres et al. (2008) |
| AB Doradus | 4 | 70 | Zuckerman et al. (2011) |
| Castor | 2 | 200 | Barrado y Navascués (1998) |
| Ursa Major | 9 | 300 | Zuckerman & Song (2004) |
| Hyades | 24 | 625 | Perryman et al. (1998) |
Source of literature isochrone ages.
| Reference | Number |
|---|---|
| of stars | |
| Gerbaldi et al. (1999) | 4 |
| Janson et al. (2011) | 1 |
| Laureijs et al. (2002) | 1 |
| Paunzen (1997) | 3 |
| Rhee et al. (2007) | 25 |
| Rieke et al. (2005) | 8 |
| Song et al. (2001) | 6 |
| Su et al. (2006) | 1 |
| Tetzlaff, Neuhäuser & Hohle (2010) | 12 |
| Westin (1985) | 3 |
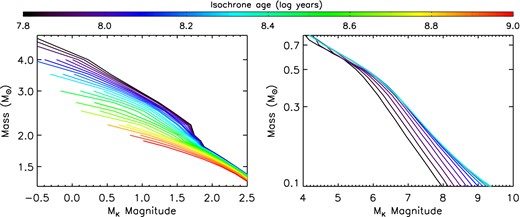
The mass–magnitude relations derived from the theoretical isochrones covering the A-type star mass range (Siess et al. 2000; left-hand panel), and for companions at the bottom of the main sequence (Baraffe et al. 1998; right-hand panel). For A-type stars, the mass derived from the mass–magnitude relation is strongly dependent on the age estimate of the system over the full lifespan of a typical A-type star, while for lower mass companions this dependence rapidly becomes negligible at ages older than 108 yr. This demonstrates why an age estimate is necessary prior to estimating the mass of the A-type star, and mass ratio of any resolved binary systems.
SUPPORTING INFORMATION
Additional Supporting Information may be found in the online version of this article:
Table 1. The VAST sample.
Table 2. Alternative catalogue identifiers.
Please note: Oxford University Press are not responsible for the content or functionality of any supporting materials supplied by the authors. Any queries (other than missing material) should be directed to the corresponding author for the article.
