


Abstract
We have used the MOST (Microvariability and Oscillations of STars) microsatellite to obtain four weeks of contiguous high-precision broad-band visual photometry of the O7.5III(n)((f)) star ξ Persei in 2011 November. This star is well known from previous work to show prominent DACs (discrete absorption components) on time-scales of about 2 d from UV spectroscopy and non-radial pulsation with one (l = 3) p-mode oscillation with a period of 3.5 h from optical spectroscopy. Our MOST-orbit (101.4 min) binned photometry fails to reveal any periodic light variations above the 0.1 mmag 3σ noise level for periods of a few hours, while several prominent Fourier peaks emerge at the 1 mmag level in the two-day period range. These longer period variations are unlikely due to pulsations, including gravity modes. From our simulations based upon a simple spot model, we deduce that we are seeing the photometric modulation of several corotating bright spots on the stellar surface. In our model, the starting times (random) and lifetimes (up to several rotations) vary from one spot to another yet all spots rotate at the same period of 4.18 d, the best-estimated rotation period of the star. This is the first convincing reported case of corotating bright spots on an O star, with important implications for drivers of the DACs (resulting from corotating interaction regions) with possible bright-spot generation via a breakout at the surface of a global magnetic field generated by a subsurface convection zone.
1 INTRODUCTION
Despite their rarity, luminous hot (massive) stars account for a dominant fraction of the recycling of energy and enriched stellar material back to the interstellar medium which can then form further generations of stars and planets. This occurs both from winds during the whole stellar lifetimes and supernova explosions at the end of their lives.
Models of the most massive stars near or on the main sequence, the O stars, predict that pulsations should occur via the iron-bump κ mechanism due to the extension of the β Cep instability strip at least to the late-O-type stars (Cox et al. 1992; Pamyatnykh 1999). This would be indispensable to probe their internal structure. But such pulsations are not observed photometrically in the majority of O stars (Balona 1992, 2010) which is often the easiest way to probe the variability. On the other hand, spectroscopic surveys for variability in O stars (Fullerton, Gies & Bolton 1996) indicate that the vast majority of O stars show photospheric line profile variations (LPV) that can probably be attributed to pulsation. In the hottest stars, modes of high-l spherical harmonics are excited in preference to those of low l, thus, possibly explaining the decline in detectable light variations for stars hotter than B0 (Balona 2010). Photometry is most sensitive to very low-l oscillations because of resolution problems and partial cancellation effects at high l. Indeed, even if the variations of the partial cancellation factor as a function of l do not behave monotonically, its values decrease at least by a factor of 10 for l ≥ 4 compared to the dipole mode, and converge towards zero for l ≥ 9, the effect being also more important on odd modes than on even modes (see equation 6.29 and fig. 6.4 of Aerts, Christensen-Dalsgaard & Kurtz 2010).
Strange-mode pulsations are also predicted to occur in the upper part of the Hertzsprung–Russell diagram (Kiriakidis, Fricke & Glatzel 1993; Glatzel 2009), but it seems that these modes mainly concern stars close to the Humphreys–Davidson limit and observations have not established yet that strange modes are present in O stars.
Most of the few known pulsating O stars are late-O-type stars (see Henrichs 1999; Walker et al. 2005; De Cat et al. 2007; Pigulski & Pojmański 2008; Rauw et al. 2008; Howarth et al. 2014), two of them having the best-established oscillation periods: ζ Ophiuchi, the best studied of all the O stars by MOST (Microvariability and Oscillations of STars) photometry (Walker et al. 2005; Howarth et al. 2014), and HD 93521 (Rauw et al. 2008), both O9.5V. The ζ Oph MOST light curve is dominated by non-radial pulsations (NRP) in at least a dozen frequencies in the range 1-10 d−1, with dominating period P = 4.6 h and amplitudes reaching 7 mmag. ζ Oph and HD 93521 are also amongst the most rapidly rotating stars known, with v sin i ≃ 400 km s−1 for ζ Oph and 390 km s−1 for HD 93521. So even if they show low-amplitude β Cep-like pulsations, they should be considered as exceptional members of the so-called class of β Cep stars (Stankov & Handler 2005).
Two hotter, mid-O-type stars are of particular interest: ξ Persei [O7.5III(n)((f))] and λ Cephei [O6I(n)fp], which exhibit short-period LPV, implying NRP with l = 3-5 based on high-precision time-dependent spectroscopic monitoring (de Jong et al. 1999). λ Cep is unfortunately not observable by MOST.
The COnvection ROtation and planetary Transits satellite (CoRoT; Baglin et al. 2006; Auvergne et al. 2009) has also been used to study variability in six O stars in a (relatively short for CoRoT) run targeting O stars in the young cluster NGC 2244 and its surrounding association Mon OB2 (Degroote et al. 2010a; Blomme et al. 2011; Briquet et al. 2011; Mahy et al. 2011). These data reveal diverse and highly uncertain origins for the variability, ranging from possible pulsations for those (cooler O) stars closest to the β Cep strip (dominated by early-type B stars) to intrinsic red noise mainly for the hotter O stars, with rotation also possible in some cases.
With regard to their winds, detailed examination of P Cygni absorption troughs of resonant UV lines frequently used to determine mass-loss rates and terminal wind speeds of hot luminous stars reveals time-variable structures called discrete absorption components (DACs). From their International Ultraviolet Explorer (IUE) snapshot survey of 203 targets, Howarth & Prinja (1989) found that narrow absorption components (NACs) in the P Cygni absorption troughs of unsaturated UV resonance lines are virtually universal among O stars. Subsequent time series observations established that NACs are the end states of propagating DACs, thus, implying that DACs are also ubiquitous among O-type stars. More extended data sets of individual stars (e.g. Massa et al. 1995a; Massa, Prinja & Fullerton 1995b; Howarth, Prinja & Massa 1995; Prinja, Massa & Fullerton 1995; Kaper et al. 1996) led to the conclusion that DACs can start out relatively close to the stellar surface as broad absorptions, which accelerate to ever narrower features at higher velocities, asymptotically approaching the terminal wind speed of typically ∼2000 km s−1. At any given epoch for an average O star, there are on average two dominating DACs per rotation cycle (Kaper et al. 1999). DACs tend to repeat on a rotation period, yet do not preserve coherency over time-scales greater than a few rotations. In the case of ξ Per, Henrichs, Kaper & Nichols (1994) used high-time-resolution IUE UV spectroscopy of this star to conclude that the variability of its wind takes place in a wide velocity range and most importantly that the observed DACs start out at very low velocities. This was later confirmed by simultaneous Hα (close to the stellar surface) and UV wind (far out) observations of ξ Per by de Jong et al. (2001) who showed that the DACs are really tied to a region very close to the photosphere.
Concerning the origin of DACs, Mullan (1984) suggested that they probably emerge from corotating interaction regions (CIRs) in the stellar wind. These large-scale structures are observed and well studied in the solar corona (Hundhausen 1972), where regions of open magnetic field accelerate local parcels of wind plasma ultimately to higher speeds, and the interaction of these streams with the ambient wind, combined with rotation, leads to corotating spiral-like wind perturbations. Mullan (1984) extended this paradigm to the case of hot stars and the origin of DACs was associated with CIR compressions within the stellar wind.
Kaper & Henrichs (1994) discussed magnetic footprints as the source of DACs in O-type stars. They suggested a low-amplitude, variable dipole magnetic field as the seed of a large-scale wind structure that can be responsible for the emergence of DACs. Later, Cranmer & Owocki (1996) established models of CIRs in which it turns out that DACs come from extended velocity plateaux forming ahead of the dense CIR compressions. In the simulations of Cranmer & Owocki (1996), bright spots at the stellar surface produce plateau speeds in the wind and absorption features that match with the characteristics of the observed DACs, whereas dark spots generate plateau speeds in the wind that are at 4000–5000 km s−1 (see their fig. 8a) which are not consistent with the slow-moving observed DACs (Owocki, private communication). The source of the bright spots needed to create the DACs, however, remained a mystery, with NRP or hypothetical magnetic spots remaining as the most likely candidates, with some preference for the latter as the required magnetic field strength would match typical values of the wind confinement parameter η for an O star (Ud-Doula, Owocki & Townsend 2008; Henrichs 2012). In addition to that, only magnetic spots will corotate with the star; NRPs will not be corotating, propagating in prograde or retrograde modes.
ξ Per is the brightest single O star in the Northern hemisphere, with the most extensive observational record regarding wind and atmosphere connection, DAC information, pulsation information, and with a magnetic upper limit (59 G, model-dependent surface dipole polar field strength for ξ Per; David-Uraz et al., in preparation), but with high-precision photometry desperately missing. Photometry is especially relevant because if DACs arise from corotating magnetic spots, the latter should be detectable in optical continuum light, which is the main goal of this investigation.
We have observed ξ Per using MOST in an attempt to photometrically reveal its NRP (despite the only known mode so far, a p mode with l = 3, P = 3.5 h according to the spectroscopic monitoring of de Jong et al. 1999) and any other variability that might be present (e.g. corotating bright spots). It was hoped that this may reveal other pulsation modes, too, which would help clinch the p modes expected in O stars (and possibly even reveal longer period g modes from the core region). We also obtained contemporaneous optical spectra in the range 4000–5000 Å at the highest resolution available (∼0.4 Å pixel−1, Δv ∼ 60 km s−1) and S/N ∼ 150 at the Observatoire du Mont Mégantic, in order to attempt to match up with the MOST photometry and to verify the LPV previously seen in this star (Kaper et al. 1996; de Jong et al. 1999, 2001). Unfortunately, due to the insufficient signal-to-noise ratio (S/N) in our spectra and the sparsity of the time coverage, no obvious link could be established between the spectral changes and the simultaneous MOST light variations. More extensive spectral coverage will be needed in the future to probe this interesting aspect. Thus, this paper focuses on the outcome of our analysis of the MOST light curve of ξ Per.
2 OBSERVATIONS
The photometry presented here was obtained by the MOST microsatellite, which houses a CCD photometer fed by a 15-cm Maksutov telescope through a custom broad-band optical filter (350–750 nm). The satellite's Sun-synchronous polar orbit (period = 101.4 min, corresponding to a frequency of 14.20 d−1) enables uninterrupted observations of stars in its continuous viewing zone (|$-18^\circ < \mathrm{{\rm Dec.}} < +36^\circ$|) for up to eight weeks. A pre-launch summary of the mission is given by Walker et al. (2003) and on-orbit science operations are described by Matthews et al. (2004).
ξ Per (V = 4.06, RA[2000] = 03:58:57.90, Dec.[2000] = +35:47:27.7) was observed during four contiguous weeks of space-based MOST photometry between 2011 November 04 and December 04 (HJD 245 5869.5–899.5). The observations lasted ∼20 min of each MOST orbit, the remaining orbital time being devoted to two other targets. The data were obtained in Fabry mode and extracted using the technique of Reegen et al. (2006). With such time gaps and no urgent need to look above the MOST-orbit Nyquist frequency (or below P = 2 × 101 min = 3.37 h), we calculated orbital means to create a final light curve (Fig. 1). The standard deviation of each mean point is ∼0.3 mmag.
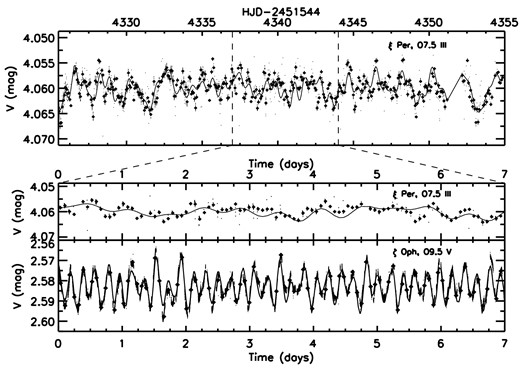
MOST photometry. The diamonds are orbital means, whereas the small points represent raw data. Top: light curve of ξ Per obtained with four contiguous weeks of MOST photometry in 201 November. The continuous curve is a fit with the 12 frequencies listed in Table 1. Middle: 7-d subsample of the above light curve. Bottom: 7-d subsample of the MOST light curve of the O9.5 dwarf ζ Oph for which Walker et al. (2005) reported the detection of short-period radial and non-radial pulsations. The continuous curve is a 13 frequency fit from table 1 of Walker et al. (2005). Note that the middle and the bottom panels have exactly the same horizontal and vertical scales.
3 RESULTS
3.1 Rotation period of ξ Per
The rotation period is a crucial parameter in this investigation. Even if the recurrence of the DACs in ξ Per happens at a time-scale of PDACs = 2.09 d, the best estimate of the stellar rotation period is twice that period, i.e. Prot = 4.18 d (de Jong et al. 2001).
Theoretically, the rotation period is simply related to the stellar radius R and the rotational velocity as Prot = 2πR/v. The top panel of Fig. 2 shows a plot of the maximum rotation period Pmax as a function of R, for a given value of v sin i. The two extreme values of v sin i of ξ Per were taken: 192 km s−1 (from Penny 1996, who found v sin i = 204 ± 12 km s−1) and 225 km s−1 (from Howarth et al. 1997, who found v sin i = 213 ± 12 km s−1). For an assumed radius of |$14^{+2.1}_{-1.8} \,\mathrm{R}_{{\odot }}$| (derived by Repolust, Puls & Herrero 2004) and the lowest v sin i = 192 km s−1, the period should still be less than 3.6 d. For higher v sin i values, the period should be even shorter. A 4.18-d rotation period implies a stellar radius greater than ∼16 R⊙. So the adopted radius is critical to accommodate Prot = 4.18 d. From the bottom panel of Fig. 2, we can see that if R ≃ 16 R⊙, a rotation period of 4.18 d corresponds to an inclination angle of 90° whereas a rotation period of 2.09 d yields an inclination angle of ∼30°. The same reasoning applies for the highest v sin i = 225 km s−1: a 4.18-d rotation period implies a stellar radius greater than ∼18.5 R⊙, and when R ≃ 18.5R⊙, a rotation period of 2.09 d yields an inclination angle of ∼30°. However, an inclination angle of the order of 30° is not consistent with the fact that we see NRP travelling bumps only going from blue to red in the dynamic quotient spectra of ξ Per data (see figs 2 and 3 of de Jong et al. 1999).
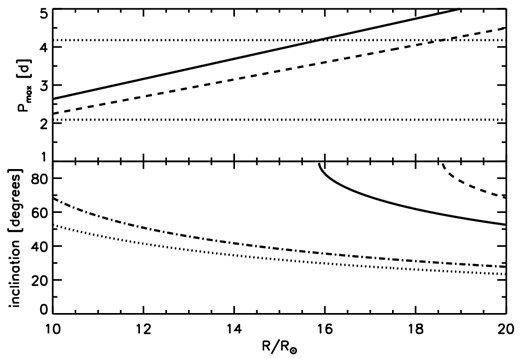
Top: maximum rotation period as a function of the stellar radius for v sin i = 192 (solid) and 225 km s−1 (dashed). The horizontal dotted lines indicate where Pmax = 2.09 and 4.18 d. Bottom: inclination angle as a function of the stellar radius for v sin i = 192 km s−1 and Prot = 4.18 d (solid), v sin i = 192 km s−1 and Prot = 2.09 d (dotted), v sin i = 225 km s−1 and Prot = 4.18 d (dashed), v sin i = 225 km s−1 and Prot = 2.09 d (dash–dotted).
So this analysis, along with previous spectroscopic analyses by de Jong et al. (1999) shows that the longer period Prot = 4.18 d is indeed favoured, and the shorter 2.09 d period is more or less excluded. This analysis also gives a lower limit on the stellar radius. Our preferred value of 18.5 R⊙, at a distance of 380 pc (HIPPARCOS; van Leeuwen 2007), implies that the angular diameter of ξ Per is roughly 0.45 mas, a diameter that would be measurable using interferometry (e.g. Boyajian et al. 2013).
3.2 Photometry
The outcome of our time–frequency analysis of the MOST data is plotted in Fig. 3. On the overall Fourier power spectrum, we see a 3σ background noise limit of about 0.1 mmag at f = 2 d−1 dropping to 0.03 mmag at the Nyquist frequency of 7.13 d−1.
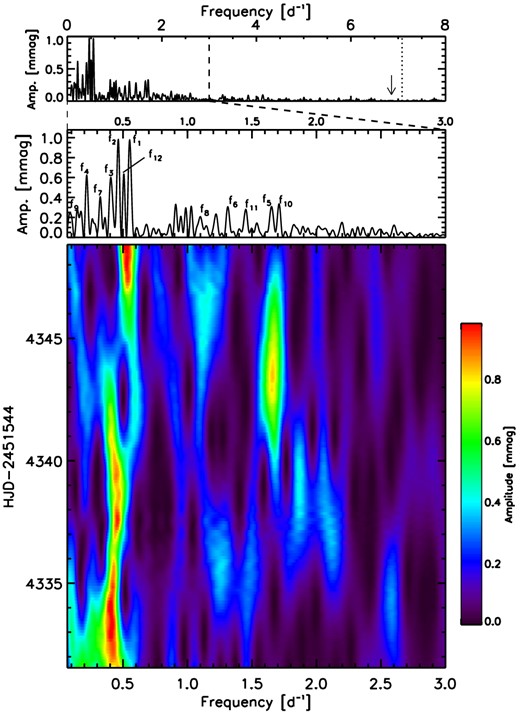
Top: Lomb–Scargle periodogram of the full binned MOST light curve of ξ Per, out to and beyond the Nyquist frequency shown as a vertical dotted line at 7.08 cycles d−1. The arrow indicates that there is no peak at f = 6.86 d−1 (P = 3.5 h). Middle: zoom on the frequencies below 3 d−1. The 12 frequencies from Table 1 are indicated. Bottom: time–frequency diagram corresponding to the middle panel.
Then, below 2 d−1, we see a series of about 10 peaks between f = 0.8 d−1 [P = 1.25 d] and f = 1.7 d−1 [P = 0.59 d] with amplitudes up to 0.3 mmag, and half a dozen peaks between f = 0.20 d−1 [P = 5 d] and f = 0.55 d−1 [P = 1.82 d] up to 1.0 mmag. The time-dependent part of Fig. 3 also shows that power peaks at a given frequency do not last more than a couple of rotations.
These impressions are quantified in Table 1, which lists the 12 most significant frequencies from the whole data set, using Period04 (Lenz & Breger 2005). The three significant peaks (f1, f2, f3) with S/N > 4.0 occur in a narrow range from f = 0.40 d−1 [P = 2.5 d] to 0.55 d−1 [P = 1.82 d], which coincides with the dominating DACs frequency at f = 0.48 d−1 (P = 2.09 d; de Jong et al. 2001), with two nearly equal DACs on average per rotation cycle; this corresponds to the best estimate of the rotation period of 4.18 d. Two possibly significant frequencies with S/N between 3.0 and 4.0 occur at about half and four times this frequency, respectively. Seven frequencies are marginal (S/N = 2.5-3.0) and occur mostly at simple multiples of the primary group of frequencies at f ∼ 0.5 d−1. Beyond f = 2 d−1, no outstanding peaks are seen.
List of the 12 most significant frequencies from the global Fourier analysis (Period04) of the MOST light curve. The starting time for phase values is HJD−245 1544 = 4325.547 363.
| Frequency (d−1) | Period (d) | Amplitude (mmag) | Phase | S/N | |
|---|---|---|---|---|---|
| f1 | 0.55 ± 0.003 | 1.82 ± 0.01 | 0.90 ± 0.11 | 0.58 ± 0.02 | 4.9 |
| f2 | 0.46 ± 0.006 | 2.17 ± 0.03 | 0.98 ± 0.11 | 0.47 ± 0.02 | 5.2 |
| f3 | 0.41 ± 0.003 | 2.44 ± 0.02 | 0.93 ± 0.11 | 0.64 ± 0.02 | 5.0 |
| f4 | 0.22 ± 0.003 | 4.55 ± 0.06 | 0.70 ± 0.11 | 0.61 ± 0.03 | 3.8 |
| f5 | 1.65 ± 0.004 | 0.61 ± 0.001 | 0.66 ± 0.11 | 0.88 ± 0.03 | 3.6 |
| f6 | 1.31 ± 0.004 | 0.76 ± 0.002 | 0.56 ± 0.11 | 0.96 ± 0.03 | 3.0 |
| f7 | 0.32 ± 0.005 | 3.13 ± 0.05 | 0.50 ± 0.11 | 0.06 ± 0.04 | 2.8 |
| f8 | 1.10 ± 0.004 | 0.91 ± 0.003 | 0.55 ± 0.11 | 0.43 ± 0.02 | 2.9 |
| f9 | 0.09 ± 0.004 | 11.11 ± 0.49 | 0.55 ± 0.11 | 0.11 ± 0.03 | 2.9 |
| f10 | 1.71 ± 0.004 | 0.58 ± 0.001 | 0.53 ± 0.11 | 0.98 ± 0.04 | 3.0 |
| f11 | 1.45 ± 0.005 | 0.69 ± 0.002 | 0.50 ± 0.11 | 0.36 ± 0.04 | 2.7 |
| f12 | 0.50 ± 0.007 | 2.00 ± 0.03 | 0.52 ± 0.11 | 0.92 ± 0.02 | 2.8 |
In particular, we fail to see the l = 3 p mode from the spectroscopic analysis of de Jong et al. (1999), which is not surprising, given that photometry is usually blind to all but the lowest order pulsations, of which there appear to be none. The question then arises whether MOST may be seeing longer period (low-order) g-mode pulsations. While no definitive answer can be given, we do note that we see no recognizable frequency patterns among those peaks that were seen (see Table 1) that would support this. Also, fitting the three best frequencies (or even all 12 from Table 1) to the light-curve in Fig. 1 leads to a relatively poor match, with significant stochastic residuals. If pulsations dominated the variability, this kind of curve would match the observed power spectrum very well with negligible residuals, as is the case with the rapidly rotating, pulsating O9.5V star ζ Ophiuchi (Walker et al. 2005). This is not the case for ξ Per, so even longer period g-mode pulsations do not seem likely.
An alternate hypothesis might be that we are seeing variations due to surface bright spots. But then why several frequencies instead of only one dominating frequency? One conceivable reason might be due to differentially rotating spots at different latitudes overlapping in time. However, even if there are spots stretching from the equator to near the pole, differential rotation in massive stars is not enough to explain the spread in frequency of even just the three strongest frequencies in Table 1 in the range f = 0.40–0.55 (Δf/f ≃ 30 per cent). Actually, considering the models of fast-rotating early-type stars established by Espinosa Lara & Rieutord (2013), the surface differential rotation curves as a function of stellar mass tend to be flat beyond 14 M⊙ (see their fig. 15) and an extrapolation up to 40 M⊙ leads to a difference of at most 10 per cent in rotation periods between the equator and the poles.
Therefore, we attempted to test whether we could reproduce the observed main frequencies with a simple model of spots forming and fading, but always with the same rotation period Prot = 4.18 d. Panels (a) and (b) of Fig. 4 show examples of idealized model light curves with 11–12 spots at the equator with i = 90° of varying intensity and duration. In these model light curves, we can identify 11–12 main peaks from rotating spots at independent starting times. Each spot lasts a maximum of 2–3 rotations. This was chosen to be consistent with the behaviour of the time-dependent part of Fig. 3. This is also consistent with theoretical predictions that the lifetime of the magnetic field that could be generated in the subsurface convective zone of massive stars is the turnover time of this convective layer (Cantiello & Braithwaite 2011) which, although a priori independent of rotation, turns out to be of the same order as the rotation period. Cantiello & Braithwaite (2011) also predicted a lower limit of the order of hours for the lifetime of such magnetic spots in a hot massive star, as well as an upper limit of ∼50 yr for a 20 M⊙ star and ∼4 yr for a 60 M⊙ star. It is worth noticing that compared to the Sun, the spot lifetimes considered here are similar to that of large sunspots and sunspot groups (Ringnes 1964; Foukal 2004; Henwood, Chapman & Willis 2010).
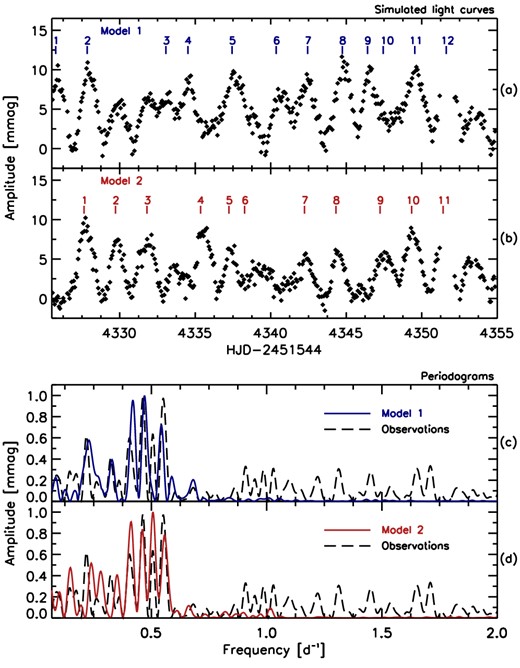
Panels (a) and (b): two model light curves with 11-12 different spots each lasting typically 2-3 rotations and with random starting times over the same time interval as the actual MOST observations. The labelled vertical dashes indicate where each spot reaches its maximum brightness. Panels (c) and (d): periodograms of the spot models (blue and red solid curves for model 1 and model 2, respectively) compared to the periodogram of the MOST light curve of ξ Per (black, dashed). The power peaks beyond f = 0.8 d−1 in the observed data are marginally significant and might be accounted for by harmonics or aliases of the main peaks around 0.5 d−1 or by adding more smaller spots.
Finally, the synthetic light curve containing N spots is defined by |$\mathcal {I}(t)= \sum _{i=1}^{N}f^{(i)}(t) \mathcal {E}^{(i)}(t)$|. We also include white Gaussian noise in our simulations. No assumptions were made concerning the exact shape of the spots and their angular extent in two dimensions, assuming that the definitions of f (i)(t) and the envelope function |$\mathcal {E}^{(i)}(t)$| for each spot are sufficient to study the light variations that they induce in the continuum. Also, it is worth noticing that our simulations do not include limb-darkening effects. Table 2 summarizes the parameters (|$t^{(i)}_{\rm max}$|, |$A^{(i)}_{\rm max}$|, τ(i)) for each individual spot in the synthetic light curves presented in Fig. 4. Although we do not expect the simulated light curves to match the observed one in any exact way, the power spectra in panels (c) and (d) of Fig. 4 reveal four significant power peaks in a similar range as observed for the main frequencies. The remaining peaks in the simulations are harmonics of the stronger peaks. It should be emphasized that this is not a unique solution; true simulation of the observed light curve is a formidable task, with many parameters (e.g. spot number, intensity distribution, starting time, duration, decay law, etc) for which we have no real independent constraints. Treating this as an inverse problem would also be impractical, given the complexity and uncertainty of the nature of the spots. Nevertheless, we are content to have found two solutions which at least qualitatively match what we see; in fact, there are many more possible solutions. Note that the time–frequency analysis shows wandering frequencies, compatible with the idea of a multitude of interfering spots with different start times and durations but all rotating at the same rate, or nearly so.
Parameters for each spot in model 1 and model 2. The labels are those used to identify each single spot in Fig. 4. For each spot having a lifetime τ, tmax is the time when the spot reaches its maximum amplitude Amax.
| Model 1 | Model 2 | ||||||
|---|---|---|---|---|---|---|---|
| Spot label | tmax (HJD-245 1544) | Amax (mmag) | τ (d) | tmax (HJD-245 1544) | Amax (mmag) | τ (d) | |
| 1 | 4325.76 | 9.0 | 11.26 | 4327.63 | 9.6 | 12.06 | |
| 2 | 4327.84 | 10.1 | 12.67 | 4329.72 | 7.2 | 9.01 | |
| 3 | 4333.06 | 5.6 | 7.04 | 4331.81 | 1.8 | 2.25 | |
| 4 | 4334.52 | 7.5 | 9.39 | 4335.35 | 7.2 | 9.01 | |
| 5 | 4337.44 | 7.9 | 9.86 | 4337.23 | 6.0 | 7.51 | |
| 6 | 4340.36 | 6.4 | 7.98 | 4338.27 | 2.4 | 3.00 | |
| 7 | 4342.44 | 7.5 | 9.39 | 4342.24 | 4.8 | 6.01 | |
| 8 | 4344.74 | 8.3 | 10.33 | 4344.32 | 6.0 | 7.51 | |
| 9 | 4346.41 | 5.3 | 6.57 | 4347.24 | 5.4 | 6.76 | |
| 10 | 4347.45 | 3.8 | 4.69 | 4349.33 | 8.4 | 10.51 | |
| 11 | 4349.54 | 7.5 | 9.39 | 4351.41 | 7.2 | 9.01 | |
| 12 | 4351.62 | 11.3 | 14.08 | – | – | – | |
4 DISCUSSION
Our analysis (Section 3.2) shows that the MOST photometric variability is predominately driven by rotating surface bright spot modulations. The largest question is the origin of such spots. If these spots are corotating, they must be fixed to the stellar surface like sunspots and thus not be related to NRP. If non-corotating, the spots may be related to low g-mode NRP, either prograde or retrograde. The former interpretation (corotation) is more consistent with the behaviours of the MOST light curve and its periodogram showing that the rotation time-scales match the estimated stellar rotation period of Prot = 4.18 d. However, at this point, it is worth noting that our models which reproduce the Fourier spectrum (see Fig. 4) involve more than two corotating spots per rotation cycle. This may suggest that there could be many more DACs of progressively lower amplitudes in ξ Per, in contrast to the dominant two-DAC per rotation view of ξ Per that has been seen with IUE (Kaper et al. 1999). The detectability of these DACs of lower strengths requires high signal-to-noise, high spectral resolution ultraviolet spectroscopy.
In the MOST light curve, one might wonder if instead we are seeing the photometric modulations directly of DACs/CIRs and not the bright spots that might cause them. However, for the low-density wind of ξ Per (|$\dot{M} \le 1.2\times 10^{-6}\,\mathrm{M}_{{\odot }}$| yr−1 including clumping corrections; Puls et al. 2006), the stellar wind does not emit continuum light in the optical. A study of the spectral energy distributions of Be stars and evolved massive stars showed that, apart from the cases of extremely strong |$\dot{M}$| or disc, the flux excess is not important in the optical (Touhami et al. 2010). The stellar wind only becomes important at long wavelengths where free–free and bound–free emission processes begin to dominate and cause larger amounts of flux excess. The stellar wind only scatters continuum light from the central star, which then becomes highly diffused.
The connection of the light variations to corotating spots is surprising because such hot stars were long thought not to have convection zones except deep in their interior core region where highly temperature-dependent nuclear fusion is going on. This has changed, however, with the modelling work of Cantiello et al. (2009), who find for the first time a subsurface convection zone due to partial ionization (PIZ) near T ∼ 170 000 K of the abundant Fe-like elements. This zone is capable of driving acoustic and gravity waves, which reach the stellar surface through a radiative skin and in turn could create turbulence in the strong stellar winds from hot luminous stars, which manifest themselves as wind clumps. This PIZ may also be the source of a global magnetic field, winding up toroidally with stochastic buoyancy breakouts at the surface causing corotating magnetic bright spots at the surface of the star (Cantiello & Braithwaite 2011). Such spots would normally occur in close north–south polarity pairs, as on the Sun, and would not be easily detectable via Zeeman splitting with current spectropolarimeters due to cancellation effects of the close bipolar field. Kochukhov & Sudnik (2013) estimated the detectability of a longitudinal magnetic field in early-type stars by putting random magnetic spots on the stellar surface and using results of the recently completed Magnetism in Massive Stars survey (Wade et al. 2011, 2012). Under a number of conditions such magnetic spots are not detectable with the best available instruments (CFHT/ESPaDOnS, TBL/NARVAL, ESO/HARPSpol). Even the global field could be below current detection limits (59 G upper limit for ξ Per as mentioned in Section 1). However, when these spots (unlike the optically dark spots on the Sun) rotate with the star, they presumably cause some of the photometric (continuum light) modulations that we see in some O stars.
These corotating magnetic spots were also proposed to be at the base of the so-called stellar prominences that trigger the cyclical variabilities observed in the wind lines of some O stars, e.g. the case of the O6 supergiant λ Cep (Henrichs & Sudnik 2013). Concerning the latter, Uuh-Sonda et al. (2014) recently reported an intensive spectroscopic study of this star in search of the two pulsation frequencies found by de Jong et al. (1999). Focusing on lines stronger than the He i λ4713 line studied by de Jong et al. (1999), their spectra with S/N lower than that of the data used by de Jong et al. (1999) failed to reveal any stable frequency which might be connected to pulsations. Given that λ Cep and ξ Per share many similar properties, including the presence of strong DACs that do not repeat exactly from one rotation to the next, we suggest that the complex behaviours of the LPV reported by Uuh-Sonda et al. (2014) are the results of rotating spots. These spots come and go on time-scales of up to several times the rotation period similar to the spots we observed on ξ Per.
5 CONCLUSION AND FUTURE WORK
Some recent observations of high-precision photometric monitoring, especially from space where one can collect large amounts of precise, high-cadence, uninterrupted data, are revealing the presence of rotating spots on the surfaces of hot luminous OB stars (e.g. Degroote et al. 2010b; Aerts et al. 2013) and their descendant Wolf-Rayet stars (Chené et al. 2011; Moffat et al., in preparation). Most likely, we are seeing the detection of corotating bright spots at or near the stellar surface. ξ Per is the first clear case of corotating bright spots on an O star along with a plausible link to DACs. Because the case of ξ Per is not unique regarding UV DACs, this kind of photometric covariability should be observable and should be similar in other O-type stars showing DACs.
More work is needed to detect corotating bright spots in other O stars, preferably using high-precision photometric monitoring from space. Most late-type O stars are still in the β Cep instability strip, so their light curves could be dominated by NRP, like that of ζ Oph (Walker et al. 2005; Howarth et al. 2014). Thus, it would be more appropriate to look at early/mid-type O stars. The next generation of nanosatellites for asteroseismology, BRIght Target Explorer (http://www.brite-constellation.at/), consisting of a network of six independent 30-mm space telescopes, is expected to photometrically monitor 36 O stars with V < 6 mag at a precision level of ∼20 ppm in Fourier space. 14 of these targets are early/mid-type O stars. The mission will then contribute in determining if the corotating bright spots phenomenon is universal among O stars. Such bright spots may be the drivers of DAC activity, ubiquitous to all O and maybe also their descendant Wolf-Rayet stars and other types of evolved massive stars.
We gratefully acknowledge useful conversations with Paul Charbonneau, Nicole St-Louis, Stan Owocki and, Alex Fullerton in relation to this project. DBG, JMM, AFJM, and SMR are supported by NSERC (Canada), with additional support to AFJM from FQRNT (Québec). ANC gratefully acknowledges support from the Chilean Centro de Astrofísica FONDAP no. 15010003 and the Chilean Centro de Excelencia en Astrofísica y Tecnologías Afines (CATA). ANC also received support from the Comite Mixto ESO-Gobierno de Chile and GEMINI-CONICYT no. 32110005. VA acknowledges the Stellar Astrophysics Centre (SAC) funded by the Danish National Research Foundation. VA also received support from the ASTERISK project (ASTERoseismic Investigations with SONG and Kelper) funded by the European Research Council (Grant agreement no.: 267864). RK and WWW are supported by the Austrian Space Agency and the Austrian Science Fund. NDR acknowledges his CRAQ (Centre de Recherche en Astrophysique du Québec) fellowship.
Based on data from the MOST satellite, a Canadian Space Agency mission jointly operated by Dynacon Inc., the University of Toronto Institute for Aerospace Studies and the University of British Columbia, with the assistance of the University of Vienna.
This paper is dedicated to the memory of Dr. Vincent Fesquet.
