


Abstract
The dwarf galaxy NGC 247, located in the Sculptor Filament, displays an apparent void on the north side of its spiral disc. The existence of the void in the disc of this dwarf galaxy has been known for some time, but the exact nature and cause of this strange feature has remained unclear. We investigate the properties of the void in the disc of NGC 247 using photometry of archival Hubble Space Telescope data to analyse the stars in and around this region. Based on a grid of isochrones from log(t) = 6.8 to 10.0, we assign ages using nearest-neighbour interpolation. Examination of the spatial variation of these ages across the galaxy reveals an age difference between stars located inside the void region and stars located outside this region. We speculate that the void in NGC 247 's stellar disc may be due to a recent interaction with a nearly dark subhalo that collided with the disc and could account for the long-lived nature of the void.
1 INTRODUCTION
The Sculptor group has been shown to be a dynamically unevolved filament of galaxies, the ends of which are not gravitationally bound but are instead moving with the Hubble flow (Karachertsev et al. 2003). With a different density and population of galaxies than our own Milky Way and companions, studying the Sculptor filament galaxies holds the promise of new insights into galaxy formation and evolution. NGC 247 and its closest companion, NGC 253, make up the core of the Sculptor filament.
NGC 247 is a dwarf spiral galaxy (SAB(s)d) that is perhaps best known simply for being the companion to NGC 253. Closer inspection of NGC 247 shows an apparent void in its disc between the nucleus and outer arm on the north side of the galaxy. This void is visible in bandpasses from the infrared to the ultraviolet and thus far has drawn little attention in the literature beyond noting its existence (Roberts 1915; Carignan 1985). At a distance of about 3.5 Mpc, the void region in NGC 247 is approximately 3.4 kpc long. For a dwarf galaxy, this makes up a significant percentage of its stellar disc, which is 11.3 kpc in extent along the major axis (Jarrett et al. 2003).
Several ground-based studies have observed the central, outer, and extraplanar regions of the galaxy (Davidge 2000, 2006). These studies find an extended stellar disc with young stars forming beyond the H i region, another unusual aspect of NGC 247. Observations of NGC 247 were also obtained with the Hubble Space Telescope (HST) as part of the ANGST survey (Dalcanton et al. 2009). However, neither of these particular sets of observations included the void region of the galaxy.
We note that the void is a significantly larger ‘bubble' than would be expected from any typical, singular supernovae (SNe). A similar bubble was observed in NGC 1620, an SBbc spiral galaxy (Chaboyer & Vader 1991; Vader & Chaboyer 1995). It was determined that this bubble could have been caused by many concurrent SNe, pushing material outwards in a ring or arc up to a couple of kiloparsecs in size. Vader & Chaboyer (1995) concluded that the more than 150 SNe necessary to create the bubble in NGC 1620 originated from a superluminous cluster visible in the centre of the ring. In addition, Efremov, Elmegreen & Hodge (1998) suggest that powerful gamma-ray bursts (GRBs) may be responsible for creating large holes in galactic discs; this scenario would lessen the need for large numbers of SNe. They also posit that any superluminous clusters may fade in a short time-scale so that they are no longer visible inside of the bubble, meaning that while a bubble may remain, the visual evidence of the stars causing it may no longer be present.
Larsen (1999) identified three young, massive star clusters in NGC 247. One of these clusters, referred to as n247-899 by Larsen (1999), is located near the southern edge of the void. Being a more massive cluster, it is plausible that this cluster could have harboured the necessary amount of energy to produce the void that is seen, but it is unclear without further examination.
Previous studies have investigated the X-ray halo of NGC 247, the results of which suggest that there may be material falling into the inner regions of the galaxy (Strassle et al. 1999). However, there has been no trace of recent star formation within approximately the past 70 Myr, despite the possibility of infalling material (Gordon et al. 1999; Davidge 2000). Recent studies of X-ray sources include observations from XMM–Newton, Chandra, and optical imaging with HST (Jin et al. 2011; Tao et al. 2012). These studies show a supersoft ultraluminous X-ray source and optical counterpart with a large stellar association nearby on the western side of NGC 247, near the nuclear region. The lack of an X-ray signature associated with or close to the void region suggests that neither SNe nor GRBs are likely to have caused the void in NGC 247.
Early radio studies found that there is twice as much H i in NGC 247 in the northern half of the galaxy as in the southern portion (Carignan 1985; Carignan & Puche 1990). These studies also find that the H i envelope of the galaxy is relatively compact, truncating before the stellar disc, a matter further discussed by Davidge (2006). More recent studies have mapped out the H i at higher resolution (Ott et al. 2012; Warren et al. 2012), showing NGC 247 to have patchy H i throughout its disc. If the void is a region lacking in star formation, we would expect to find less H i emission in that region. Previous studies have not compared the void region and the H i disc characteristics; we will examine this herein (see Section 3.3). We will also examine the Hα distribution from Hlavacek-Larrondo et al. (2011) as a star formation tracer.
An area of significant extinction in the disc could potentially account for the observed appearance of the NGC 247 void. However, as noted above, the void structure is visible in many wavelengths: from ultraviolet observations by GALEX to infrared observations from the Spitzer Space Telescope (Multiband Imaging Photometer and Infrared Array Camera). Thus, it seems unlikely for the void to be purely the result of strong extinction. Additionally, the H i observations (Ott et al. 2012; Warren et al. 2012) show a dip in strength in the void region, suggesting that gas and dust do not strongly populate the region, corroborating the evidence against extinction as the primary cause of the void.
Galaxy interactions may be a viable means of producing the void. Previous studies have tried to find concrete evidence for interactions between NGC 247 and NGC 253 (Whiting 1999; Davidge 2006, 2010). At a projected distance of 350 kpc from NGC 247, NGC 253 shows a compact H i distribution similar to the observed truncation in NGC 247's H i disc (Carignan & Puche 1990; Davidge 2010). This is broadly consistent with a scenario in which the discs of NGC 253 and NGC 247 have been tidally disrupted because of interactions between the two galaxies. The spin of NGC 253's disc is also consistent with torque caused by NGC 247, offering further evidence that these two systems have influenced each other's evolution (Whiting 1999). However, NGC 247 does not show any of the classical signs of interaction such as a central starburst or tidal features (Davidge 2010).
The extension of NGC 247's stellar disc beyond the H i disc may be indicative of interactions, where stars could have been cannibalized on to NGC 247's stellar disc from the interacting galaxy (Ibata et al. 2003; Erwin, Beckman & Pohlen 2005). However, to match the young stars found in the extended stellar disc of NGC 247, this interaction would have had to happen in the past 10–20 Myr (Davidge 2006). There is a lack of a nearby companion identified that could be responsible for extending the stellar disc in the necessary timeframe. While the presence of the void could plausibly be due to interactions with NGC 253, it would be unusual to find an outer ring intact and all inner material cleared out, as we see in NGC 247.
Another scenario to consider is the existence of spiral density waves. Results from simulations by Minchev et al. (2012) show that discontinuities in spiral galaxies may arise from different interacting spiral modes or the break between inner structure and outer structure in the galaxy. Such an occurrence in NGC 247 could provide the necessary conditions for a long-lived void-like structure to exist in a ‘lopsided' spiral. However, these simulations are based on models with a strong bar in the galaxy, whereas NGC 247's bar is weak. Additionally, other studies suggest that dwarf galaxies overall tend to lack spiral density waves (Brosch, Heller & Almoznino 1998; Ott et al. 2012).
One possibility is that the void was caused by the interaction of a dark subhalo that collided with the disc in the recent past. The current paradigm of structure formation in the Universe predicts a wealth of substructure on all scales – from galaxy clusters, to spiral galaxies, to dwarf spirals. From dissipationless cosmological simulations, we expect roughly one interaction with an ∼1:100 mass ratio satellite over a dynamical time (Diemand et al. 2008). The abundance of substructure in cosmological simulations has prompted a number of authors to explore the effect of subhalo interactions on galactic discs. Chakrabarti & Blitz (2009, 2011) explained the observed perturbations in the outer H i disc of the Milky Way using a model of a (nearly) dark subhalo that has a close collision with the Galactic disc, and predicted the mass and location (in radius and azimuth) of this putative satellite. Quillen et al. (2009) showed that radial mixing of stellar metallicities can be effectively accomplished in a scenario where the Milky Way has experienced a close encounter with a satellite of mass ratio ∼1:300. Discoveries of Milky Way dark-matter-dominated satellite galaxies (Belokurov et al. 2006; Wilman, Edge & Swinbank 2006, among others), some fainter than some star clusters, suggest that there may be many more waiting to be discovered. Some of these dim satellites may tidally interact with the Galactic disc.
Theoretical models suggest that ∼1000 galaxies with M* ≳ 103 M⊙ await discovery within approximately 3 Mpc relative to the galactic centre (Garrison-Kimmel et al. 2014). The Sculptor group is ∼3 Mpc from the centre of the Milky Way; systems like the Sculptor group that are in relative close proximity to our own galaxy are the next frontier for the discovery of ultrafaint dwarfs. In Section 3.4, we consider the possibility of the formation of the void in NGC 247 due to a collision with a subhalo. In this discussion, we emphasize the distinction between gas-bearing subhaloes and purely dark-matter-dominated subhaloes, as they lead to different signatures in the galactic disc (Kannan et al. 2012).
This paper is organized as follows. In Section 2, we discuss the HST data we use as well as our processing techniques. With deep colour–magnitude diagrams (CMDs) from HST images, we can trace the physical properties of NGC 247. In Sections 3.1 and 3.2, we present our analysis of the void region with respect to its stellar populations. Using isochrones, we attribute approximate ages for stars inside and outside of the void region. From this, we examine the spatial distribution of stellar ages in NGC 247 and compare it to the H i and Hα distributions. Section 3.3 examines star formation tracers in NGC 247. In doing so, we gain insight into the nature and cause of this strange void in NGC 247. In Section 3.4, we present our analysis of the formation and evolution of the void region and our conclusions are presented in Section 4.
2 DATA
2.1 Observations
The archival HST images of NGC 247 are from a survey of neighbouring galaxies (Cycle 12 GO proposal 9771, PI: Karachertsev) taken with the Advanced Camera for Surveys Wide Field Channel (ACS/WFC). There are two images of NGC 247 in the F606W filter, each with 600 s exposures, and two images in F814W, each with 450 s exposures. This set of frames is conveniently centred directly on the void region of NGC 247, the location of interest, as seen in Fig. 1. Table 1 shows a log of the observations used in this study.
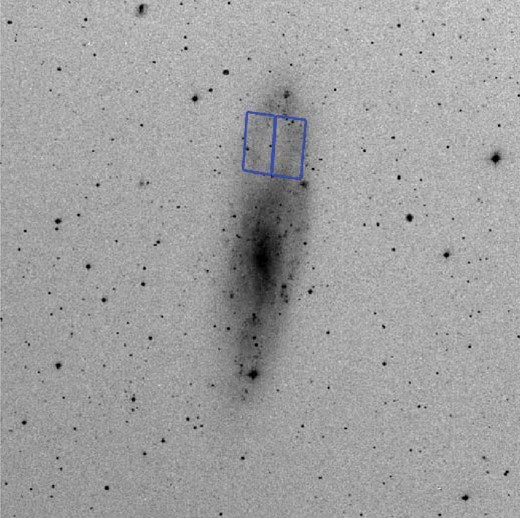
Digital Sky Survey image of NGC 247, with the HST image footprint shown, positioned over the void region.
HST archival images.
| GO PI | RA | Dec. | Filter | Exposure time |
|---|---|---|---|---|
| Karachertsev | 11.775 417 | −20.651 111 | F606W | 2 x 600 |
| F814W | 2 x 450 |
| GO PI | RA | Dec. | Filter | Exposure time |
|---|---|---|---|---|
| Karachertsev | 11.775 417 | −20.651 111 | F606W | 2 x 600 |
| F814W | 2 x 450 |
2.2 Reduction
We retrieved the FLC images of the NGC 247 field from the Mikulski Archive for Space Telescopes. These are the FLT frames corrected for the effects of charge transfer efficiency. The data quality files were applied and the resultant images were photometred as described by Sarajedini et al. (2006), using the daophot, allstar, and allframe software packages (Stetson 1987, 1994) to yield instrumental magnitudes. These were combined for the frames in each filter and then matched to form colours. We then applied the Sirianni et al. (2005) transformations to bring the magnitudes on to the VegaMAG system. In order to derive the highest quality photometric data set, error cuts were applied based on the daophot Chi, Sigma, and Sharpness parameters. This process yielded 328 901 stars across the two WFC chips to be used in our subsequent analysis.
Properties of NGC 247.
| Property | Value | Reference |
|---|---|---|
| Right ascension | 0h47m8|${^{\rm s}_{.}}$|3 | Dalcanton et al. (2009) |
| Declination | 20°45′36′′ | Dalcanton et al. (2009) |
| Morphological type | SAB(s)d | Konstantopoulos et al. (2013) |
| Inclination | 75| $_{.}^{\circ}$|4 | Carignan (1985) |
| Absolute magnitude | −18.28 | Karachertsev et al. (2003) |
| Mass | ∼1010 M⊙ | Strassle et al. (1999) |
| Distance | ∼3.5–4 Mpc | Various studies (Strassle et al. 1999; Karachertsev et al. 2003; |
| Davidge 2006; Dalcanton et al. 2009; Warren et al. 2012) |
3 ANALYSIS AND RESULTS
Our CMD of the NGC 247 void field is shown in Fig. 2. Based on the range of values published in the literature for NGC 247 (see Table 3), we adopt a distance modulus of 27.70, equivalent to the average of the distance moduli from the four most recent published studies. We adopt a value of E(F606W–F814W) = 0.16, obtained by converting the average E(B − V) value to E(F606W–F814W) using the Sirianni et al. (2005) relations. The morphology of the CMD is typical for a mixed stellar population with a range of ages and abundances. There is a dominant first ascent red giant branch (RGB) exhibiting an obvious termination at the core helium flash also known as the RGB tip at F814W ≈ 24. There appears to be a significant population of asymptotic giant branch (AGB) stars above the RGB tip signifying the presence of an intermediate-aged population. The CMD also shows a young main sequence at approximately zero colour and a sequence of more massive brighter giants extending from F814W ≈ 21 down to F814W ≈ 25 where it merges with the RGB.
Published distances and extinctions.
| Distance | E(B − V) | Method | Reference |
|---|---|---|---|
| 28.06 | 0.19 | Tully–Fisher | Karachertsev et al. (2003) |
| 27.81 | 0.26 | TRGB | Karachertsev et al. (2006) |
| 27.9 | 0.19 | TRGB (i′) | Davidge (2006) |
| 27.80 | 0.13 | PL relation (visual) | García-Varela et al. (2008) |
| 27.723 | 0.17 | TRGB (F475W, F814W) | Dalcanton et al. (2009) |
| 27.745 | 0.17 | TRGB (F606W, F814W) | Dalcanton et al. (2009) |
| 27.64 | 0.18 | PL relation (IR) | Gieren et al. (2009) |
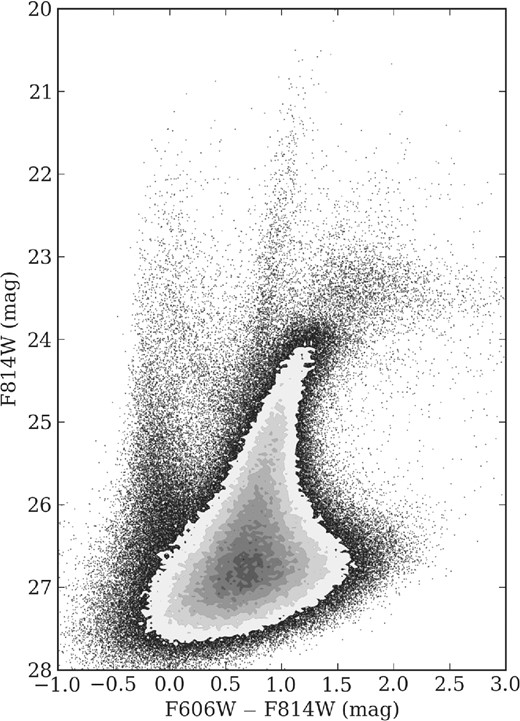
A CMD of the photometry, we performed on the HST images of the void region from the Cycle 12 imaging of NGC 247's disc.
3.1 Colour comparison
We begin our analysis by comparing the locations and distributions of the bluer stars (comparatively younger) to those of the redder (and comparatively older) stars. Making cuts to our data, we assign ‘red' stars as those with an F606W–F814W colour greater than 0.2 and the ‘blue' stars with colours less than 0.2, for all stars with F814W < 26 and −1 < (F606W–F814W) < 3. A comparison of the density distribution of these stars across the void region is seen in Fig. 3, where the left-hand panel shows the red stars while the right-hand panel shows the blue stars.
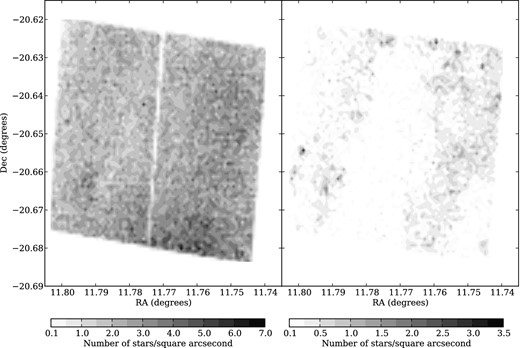
A comparison of the number density of red and blue stars in the void region, with darker regions being denser. The left-hand panel shows stars with (F606W–F814W) < 0.2 while the right-hand panel includes stars with (F606W–F814W) > 0.2. Only stars brighter than 26th magnitude in F814W and with (F606W–F814W) colours between −1 and 3 are shown. The red stars in our photometry show little variation in density across the void region. The blue stars, however, display a clear gradient in density across the void region.
We see that the red stars show little variation in density across the void region. In contrast, very few blue stars populate the area of the void and their density changes abruptly at the edge of the void. The relatively uniform density of the red stars, in conjunction with the observations from the UV to the IR also clearly showing the void region, implies that the appearance of the void is not simply due to extinction. The difference between the red and blue stellar densities suggests that the stellar population of NGC 247's void region is dominated by old stars, while the region just outside the void contains both old and young stars. We investigate this point further and in a quantitative manner in Section 3.2.
3.2 Ages
A grid of Padova–Girardi isochrones was generated from log (t) = 6.8 to 10.0, in steps of Δlog (t) = 0.2, and Z = 0.004. We use this metallicity because at the adopted distance and reddening of NGC 247, the Z = 0.004 tracks most closely match the location of the RGB. These isochrones are plotted along with the CMD in the left-hand panel of Fig. 4. Using these isochrones as a comparison, a nearest neighbour interpolation was used to assign ages to stars in the CMD.
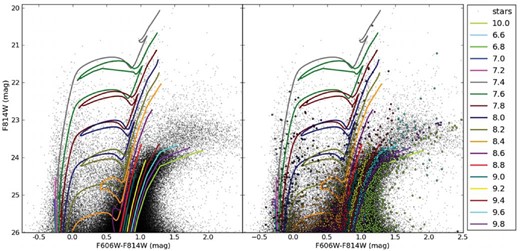
Left: the CMD of our photometry and the grid of isochrones. Right: the same as the left-hand panel except that a randomly chosen subset of 3000 stars is overplotted on the CMD and isochrones. The colours of the plotted stars correspond to their attributed ages.
The interpolation scheme determines where the star's colour intersects each isochrone (this may happen up to three times, depending on the colour and isochrone shape). At each of these intersections, a local linear interpolation is used to determine the magnitude of each isochrone at the star's colour. The magnitude of each isochrone is compared to the actual observed magnitude of the star. The same process is repeated using the star's magnitude as a basis to predict the colour which is then compared to the observed colour. For each star, the isochrone that produces the lowest combined residual value of interpolated magnitude and interpolated colour as compared to the star's actual observed magnitude and colour is used to assign an age to each star.
We use this interpolation method to determine the ages for all stars in the CMD with F814W < 26 and −1 < (F606W–F814W) < 3. The result of this procedure is shown in the right-hand panel of Fig. 4, where we plot a subsample of 3000 random stars with their assigned ages (noted by the associated colour) along with the isochrones. These ages are used to analyse the properties inside and outside of the void region.
From the ages determined using the interpolation method described above, we map the median ages spatially across the void as seen in Fig. 5. This figure shows a clear discontinuity in the relative ages of the stars across the void region in NGC 247. There are almost exclusively older stars in the void region with respect to those outside, indicating a severe deficiency of younger, recently formed stars in the void. This would suggest that star formation has halted in this area of the galaxy, but continues in the neighbouring spiral arm.
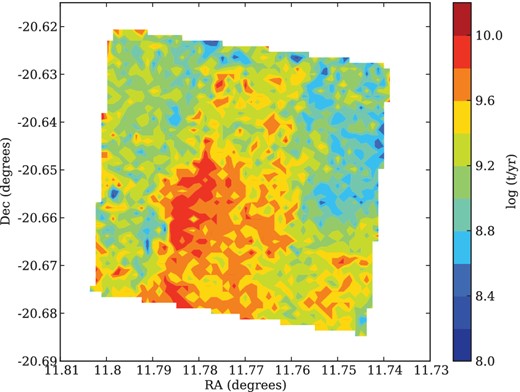
A contour map of ages across the void region in NGC 247. The median ages have a range of Δlog (t) = 0.2, from log (t) = 8.0 to 10.0 as indicated by the colour bar, with red being older and blue being younger.
In order to examine the relationship between the ages of the stars and their location, we have constructed a radial plot of mean age from the centre of the void region. We used elliptical bins in increments of 16 arcsec along the semimajor axis of the projected ellipse, starting from the approximate centre of the void and moving outwards. The centre of the void is approximately at an RA of 11.7730 and declination of −20.6515, with a position angle of 75| $_{.}^{\circ}$|4. The result is 20 bins with at least 228 stars in each bin, and an average of 3351 stars per bin. In each bin, we determine the mean age of the stars and plot mean age as a function of semimajor axis in order to compare the ages of the stars inside the void to those outside.
The result of this exercise is shown in Fig. 6 , where we notice a dramatic result. The void region has a clear boundary around 200 arcsec from the centre (≈3.4 kpc), beyond which there is a clear difference in the mean age of the population. This implies that the void region is devoid of recent star formation unlike the region immediately surrounding it, which shows evidence for the presence of young stars.
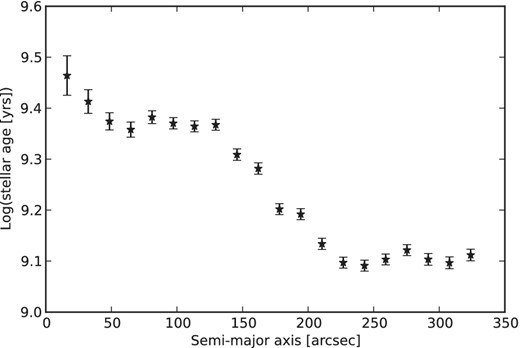
The filled symbols represent the mean age of stars brighter than F814W = 26 in elliptical bins with increments of 16 arcsec along the semimajor axis of the void. We see a clear drop in the mean age at 200 arcsec (3.4 kpc) from the void centre, suggesting that the stars outside of the void are a distinctly younger population than those inside.
3.3 Star formation tracers
In addition to the photometry, which indicates that there has been a lack of star formation in the void region for some time, it is informative to examine other indicators of star formation in the disc and void of NGC 247.
The H i distribution in NGC 247 suggests that there is gas in the northern region of the galaxy (Ott et al. 2012; Warren et al. 2012), though the brightness of the H i is very patchy across the entire disc. A visual comparison between the H i image from Ott et al. (2012) and Warren et al. (2012) indicates that the void area corresponds to a lower density region in the H i disc. However, we stress that the weaker H i emission in the void region is not unique, as areas of depressed H i flux are observed at many locations in the galactic disc. This patchy distribution of H i is typical in dwarf galaxies, likely due to dwarfs having shallower gravitational potential wells and thicker discs (Roychowdhury et al. 2010; Bagetakos et al. 2011).
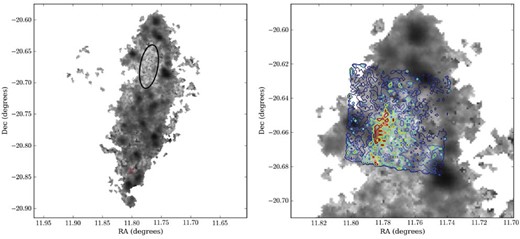
For a more quantitative comparison, we obtained the H i flux data from Ott et al. (2012) and Warren et al. (2012) to compare to our mean stellar ages in the void region. Fig. 7 shows the location of the void region in the galactic disc in the left-hand panel, indicated by the black ellipse, and the H i emission with a contour of ages (Fig. 5) overplotted on the void in the right-hand panel. While the void does correspond with a region of depressed H i flux, it is not necessarily correlated with the behaviour of the stellar age gradient in the void. To illustrate this, we found the H i flux profile of two visually similar regions, one at the location of the void and the other on the southern half of the disc, located at the red cross in the left-hand panel of Fig. 7. We determine the H i flux profiles by using annular bins spaced 16 arcsec apart of the same ellipticity and location as those used to determine the radial stellar age gradient of the void. As seen in Fig. 8 , the depression of H i flux coincident with the void region is not unique to the void, as both the H i flux profiles of the void region and the southern H i depression have similar profiles (the solid and dashed lines, respectively). Thus, although there is a correlation between H i emission and stellar age, the lack of H i is likely not a driver of the stellar age gradient present in the void, as the H i depression in the void region is not unique in the galaxy.
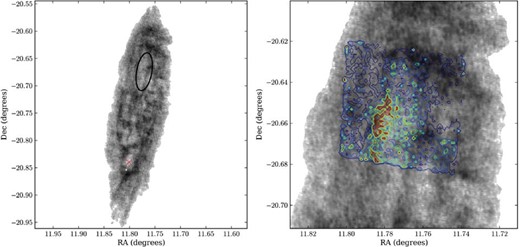
The H i emission in NGC 247 from Ott et al. (2012) and Warren et al. (2012). The left-hand panel shows the H i emission in grey-scale (darker is stronger emission) over the entire H i disc of NGC 247 with the location of the void indicated by the black ellipse. The red cross indicates a similar H i depression at an RA of 11.8000 and declination of −20.8389, used for comparison to the stellar void (see Fig. 8). The right-hand panel again shows the H i emission, centred more closely on the void region. The contour of ages (Fig. 5) is overplotted in the right-hand panel for comparison.
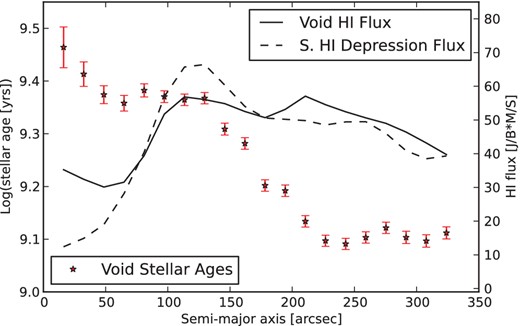
The derived stellar age gradient in the void overlaid with the H i flux profiles of two regions in the H i disc. H i flux profiles are constructed using annular bins of the same ellipticity as those used to find the mean stellar age profile of the void. The H i flux profile of the region coincident with the void and that of the southern H i depression (marked as a red cross on Fig. 7, location at an RA of 11.8000 and declination of −20.8389) exhibit similar behaviour. This suggests that the H i hole located in the void does not drive the observed stellar age gradient.
Hα emission and H ii regions are also key star formation tracers. While NGC 247 has sparse and relatively faint H ii regions, the Hα emission has recently been mapped by Hlavacek-Larrondo et al. (2011). The middle-left panel in fig. 3 of their paper shows the Hα emission in the disc of NGC 247. We plot the Hα emission across the disc in Fig. 9. The left-hand panel shows the location of the Hα depression in the void region of the disc, indicated by the ellipse, and the right-hand panel has the age contour (Fig. 5) overplotted on the Hα data from Hlavacek-Larrondo et al. (2011).
The left-hand panel shows the Hα emission from Hlavacek-Larrondo et al. (2011) in grey-scale across the disc. A black ellipse shows the location of the void of NGC 247 and the red cross indicates the location in the disc used for comparison to the stellar void (see Fig. 10, located at a right ascension of 11.7707 and a declination of −20.6714). The right-hand panel shows the Hα emission again, centred more closely on the void region. The contour of ages (Fig. 5) is also plotted for comparison.
Visual inspection shows a lack of Hα emission in the northern region corresponding to the location of the void, while the remainder of the disc has relatively mild to strong Hα emission. Unlike, the H i disc, the decreased Hα emission of the northern half of NGC 247's disc is unique and substantial, with a much lower overall Hα flux inside the void region compared to other parts of the disc. We have calculated the Hα flux profile in the region of the void in the manner described above with 12.9 arcsec elliptical bins and find that the Hα flux is minimal at the centre of the void and grows steadily out to ≈200 arcsec (≈3.4 kpc) from the centre of the void (see Fig. 10, solid line). As the ages of the stars get younger outwards from the centre of the void, the Hα flux grows stronger.
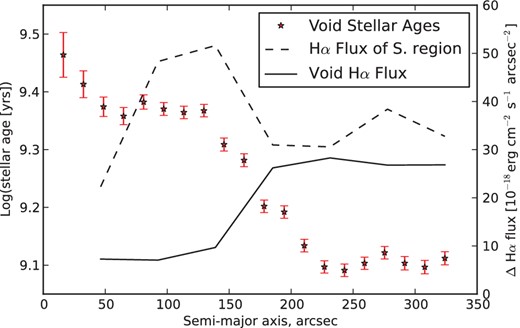
The derived stellar age gradient is overlaid with Hα flux profiles of two regions in the disc: one in the void and one in the opposite (southern) side of the disc. The Hα flux profiles are found using annular bins of the same ellipticity as those used to find the mean stellar age profile of the void. The Hα flux profile of the void region is shown as a solid line, and has an inverse correlation with the age moving outwards from the centre of the void. We place the centre of the elliptical bins to match the Hα depression in the void at a right ascension of 11.7707 and a declination of −20.6714. The dashed line shows the Hα flux profile of a southern region in the disc (indicated by the red cross in Fig. 9 at an RA of 11.8000 and declination of −20.8389). The southern region does not show any such correlation with age and has a higher overall Hα flux than the void region. The extent and severity of depressed Hα emission in the northern region of NGC 247 is unique to the Hα disc and coincides with the location of the stellar void, suggesting a lack of recent star formation in that area of the disc.
We compare the distribution of Hα flux in the void region to the flux in a region on the opposite side of the disc (Fig. 10, dashed line). In the southern region of the disc, we find an Hα flux profile that shows no obvious trend. This region has a much higher Hα flux (∼35 × 10−18 erg cm−2 s−1 arcsec−2) than that of the void region within 200 arcsec (<10 × 10−18 erg cm−2 s−1 arcsec−2). The lack of any significant Hα emission in the northern void region of NGC 247 compared to the rest of the disc again suggests a lack of recent star formation in that area.
CO observations could help to determine whether the H i depletion in the region of the void is significant in comparison to the rest of the H i disc, but unfortunately, these observations do not yet exist in sufficient resolution.
3.4 Discussion
Other galaxies (such as NGC 1620; see Chaboyer & Vader 1991; Vader & Chaboyer 1995) have been found to host kiloparsec-sized holes. However, the void region in NGC 247 is several kiloparsecs in size and is a significant portion of the dwarf galaxy's disc. The analysis presented herein finds that the void region of NGC 247 exhibits a distinctly older population than the surrounding stars. Based on Figs 5 and 6, we estimate that there has been very little star formation in the void for approximately the past Gyr.
While ‘bubbles' found in other galaxies have been attributed to multiple concurrent SNe or GRBs, there are no SNe remnants, X-ray sources, or large stellar clusters that have been detected within the void region in NGC 247 (Chaboyer & Vader 1991; Vader & Chaboyer 1995; Efremov et al. 1998; Jin et al. 2011; Tao et al. 2012). While this does not rule out the possibility that SNe or GRBs contributed to the formation of the void, there is no evidence to suggest that this is indeed the case in NGC 247.
Other star formation tracers, such as H i, H ii, Hα, and CO can be helpful in shedding light on the star formation history of NGC 247's void. We find a depression of H i flux in the void, but do not find that this is unique to that region, as there are similar depressions in the patchy H i disc. Thus, the H i is not likely to be a driving factor of the void region. The distribution of Hα emission is suggestive of a lack of recent star formation in the void. H ii observations are dim and sparse; CO observations, if obtained, would be very useful in studying the star formation (or lack thereof) in this region.
One possibility for the seemingly long-lived nature of the void could be spiral density waves, which can provide an explanation for the existence and longevity of the void as part of a ‘lop-sided' spiral. Although spiral density waves are often not very strong in dwarf galaxies (Brosch et al. 1998; Ott et al. 2012), interacting spiral density modes could lead to a discontinuity in the disc similar to that of NGC 247, as suggested by the simulations of Minchev et al. (2012). Alternatively, a transition from one spiral density pattern speed to another could also cause a discontinuity in a galaxy's morphology Minchev et al. (2012). Both of these cases could produce a region empty of young stars in the galactic disc, similar to what we see in the void. However, we would expect the distribution of gas to follow the pattern of the discontinuity, and this is unequivocally not the case with the H i distribution. Additionally, the absence of a strong bar in NGC 247 makes a comparison to simulations by Minchev et al. (2012) incomplete, as their models are contingent on the presence of a strong bar. None the less, spiral density waves provide a plausible scenario for the formation of the void, due to modal resonances and an explanation for a lifetime of the order of 1 Gyr.
Alternatively, we consider the possibility that an interaction with a dark-matter-dominated subhalo could cause the long-lived void. Recently, Kannan et al. (2012) showed that interactions with dark-matter-dominated subhaloes that contain some gas will lead to the formation of holes and shells in galactic discs. Interactions with purely dark subhaloes lead to a localized high-density region as the subhalo gravitationally perturbs the disc (Chang & Chakrabarti 2011; Chakrabarti et al. 2011). However, such interactions with a purely collisionless component cannot create holes in the gas distribution. This is due to the lack of contact forces, which is needed to push away the gas in the galactic disc. The presence of a small amount of gas (∼few per cent), i.e. a collisional component, will lead to the formation of holes, as the gas in the subhalo can displace the gas distribution in the galactic disc. Kannan et al. (2012) show that interactions with ∼108 M⊙ subhaloes with a gas fraction of ∼3 per cent can create kpc-sized holes. Although we find the void in NGC 247 to be bigger than the largest holes of 2 kpc in their simulations, a higher gas fraction or velocity could plausibly account for a larger void. Moreover, the simulations of Kannan et al. (2012) indicate a deficit of new stars in the holes formed by gaseous subhaloes and a corresponding increase in the density of new stars around the rim of the hole. The reason for this is that a gaseous subhalo that plunges through the disc produces a low-density region surrounded by a high-density wave. This finding is consistent with our observational analysis of the ages of stars in and around the void region of NGC 247. A deficit of new stars in H i holes and a concomitant enhancement in the star formation rate around the rims of holes is seen in other systems also. For example, Pasquali et al. (2008) analyse the ages of stars in IC 2574 associated with H i holes to find a similar result as we do here.
The typical velocity perturbation due to an interaction with a subhalo is ∼Vmax, i.e. the maximum circular velocity, exerted over a length-scale that is comparable to the scalelength of the subhalo (Binney & Tremaine 2008). For impact parameters comparable to the scalelength of the subhalo, the size of the imprint is of the order of the scalelength and drops for larger impact parameters. The velocity dispersion of H i discs is ∼7 km s−1 (Walter et al. 2008), and interactions with subhaloes that deliver more kinetic energy than the restoring energy provided by this velocity dispersion will leave an imprint in the disc. We can use the scaling relations for haloes in cosmological simulations (Maccio, Dutton & van den Bosch 2008) to make some simple estimates of the sizes of holes. If we take M200 = 108 M⊙ (where M200 is the mass out to the virial radius R200, the radius where the density is 200 times the critical density), the subhalo has a scalelength of ∼ kpc for a concentration, c ∼ 18, (c = R200/Rs = 18), where Rs is the scalelength of the subhalo. Thus, close interactions with a 108 M⊙ subhalo with a scalelength ∼ kpc will lead to a localized high-density region in the galactic disc if the subhalo is purely dark, and to holes (similar to the ∼kpc-sized hole in NGC 247) if the subhalo contains some gas.
The ALFALFA survey has recently uncovered a population of ultracompact high-velocity clouds (UCHVCs; Giovanelli et al. 2010). The discovery of optical emission from one of these UCHVCs enabled a distance and mass determination for the first time (Rhode et al. 2013). The dynamical mass implied by these measurements suggests that some UCHVCs host a dark matter halo and may be ultrafaint dwarf galaxies. Simulations by Keres & Hernquist (2009) indicate that a large fraction of cold gaseous clouds can originate from ‘cold-mode' accretion. If so, structures similar to UCHVCs may be commonplace, and if a sufficiently massive UCHVC were to be on a perturbing orbit – it would leave a detectable imprint (void) in the galactic disc. A high gas fraction subhalo is also consistent with a subhalo belonging to a population of UCHVC, as may be the case in NGC 247. Whether or not interactions with gas-bearing subhaloes can statistically reproduce the population of H i holes in galactic discs is a difficult question. In this particular case however, there is a good correspondence between theoretical expectations and the observations. The Kannan et al. (2012) simulations show that gas-bearing subhaloes that are massive enough can displace the gas distribution in the galactic disc, leading to a deficit of new stars in the void and an enhancement of new stars close to the rim of the hole – very similar to what we see for the void in NGC 247. The lifetimes of holes depend on the orbital parameters of the subhalo, ranging from 10 to 70 Myr. Subhalo interactions are not sufficient to account for all H i holes; smaller holes are likely to be due to occurrences of SNe and GRB activity while larger H i holes may be due to subhalo interactions.
While many dwarf galaxies lack substantial internal shear (Brosch et al. 1998; Weidner, Bonnell & Zinnecker 2011; Ott et al. 2012), NGC 247's Hα rotation curve indicates significant shear across the void region (Hlavacek-Larrondo et al. 2011). The impinging gas-bearing subhalo will displace some of the gas in the H i disc, and over a dynamical time, the void in the gaseous disc will be filled. However, in order for that gas to form new stars, it has to be compressed to a high enough density to be Jeans unstable. The large observed shear may prohibit gas compression. A number of authors have noted an observed correlation between large shear rates and low star formation (Seigar 2005; Leroy et al. 2008). Deep, high-resolution CO observations would provide a critical test of this scenario.
Features in a collisionless system may be phase mixed over many dynamical times, but a time-scale for this process cannot be defined in generality. The rate of phase mixing is inversely proportional to the maximum and minimum orbital frequencies considered (Merritt & Valluri 1996), and can be of order many dynamical times. In some potentials (such as triaxial potentials), the rate of mixing can be enhanced by chaotic mixing, but stochastic trajectories are very sensitive to initial conditions (Merritt 2013). Triaxial potentials are expected in systems that have undergone mergers (Allgood et al. 2006), and the non-Keplerian motion indicated by the observed rotation curve of NGC 247 (Hlavacek-Larrondo et al. 2011) may be reflective of a complex potential. While a time-scale for features in the stellar disc, such as the void, is difficult to establish in generality, one clear prediction of our model is a corresponding lack of CO in the void region.
4 CONCLUSION
In this work, we have reduced and analysed archival HST imaging of the void region in the Sculptor group dwarf galaxy NGC 247. Based on our deep CMD for this region, we find that the stars inside the void of NGC 247 are significantly older than those on the edge and outside of the void. This suggests a lack of star formation in recent epochs inside the void. This conclusion is supported by Hα observations from Hlavacek-Larrondo et al. (2011) and examination of the stellar populations inside and outside the void region.
From our analysis of NGC 247, we present the following specific conclusions:
We estimate the size of the void to be approximately 3.4 kpc long at a distance modulus of 27.7. This is a large portion of the 11.34 kpc major axis of the galaxy.
The stellar population inside the void is fundamentally different than that outside the void region. The mean stellar age outside the void is approximately 9.1, while the mean stellar age of stars close to the void centre is 9.4. Our analysis of age versus radius suggests little to no star formation in the void for more than 1 Gyr.
We find the characteristics of the void are inconsistent with typical disc evolution of a galaxy. Star formation is suppressed in the void region of the galactic disc where we would usually find a more diverse stellar population. There is no evidence to suggest scenarios of SNe or GRBs creating this disruption or a strong, unique anticorrelation with H i flux. Hα emission also suggests a lack of young, hot stars being formed in the void region.
An ∼kpc-sized hole with the observed age distribution may have been formed due to a close interaction with an ∼108 M⊙ gas-bearing subhalo, as suggested by the recent simulations of Kannan et al. (2012). We would expect gas displaced by such an interaction with a gas-bearing subhalo to repopulate the void region in approximately a dynamical time. However, shear in the void (as evidenced by the rotation curve) could prevent gas compression necessary for star formation, leading to a long-lived void. CO observations can be a crucial test of this scenario.
We thank the anonymous referee for his/her comments which contributed to the improvement of the paper. We would also like to extend our gratitude to Rahul Kannan and Riccardo Giovanelli for their comments on an earlier version of this paper. We would like to thank Daniel Gettings for his generosity in the use and patient explanation of his elegant code as part of this project. We would also like to thank Julie Hlavacek-Larrondo for her willingness to provide us with her Hα observations. Additionally, we are grateful to Wanggi Lim for his initial contribution to developing this project.
