


Abstract
We study the influence of the presence of a strong bar in disc galaxies which host an active galactic nucleus (AGN). Using data from the Sloan Digital Sky Survey and morphological classifications from the Galaxy Zoo 2 project, we create a volume-limited sample of 19 756 disc galaxies at 0.01 < z < 0.05 which have been visually examined for the presence of a bar. Within this sample, AGN host galaxies have a higher overall percentage of bars (51.8 per cent) than inactive galaxies exhibiting central star formation (37.1 per cent). This difference is primarily due to known effects: that the presence of both AGN and galactic bars is strongly correlated with both the stellar mass and integrated colour of the host galaxy. We control for this effect by examining the difference in AGN fraction between barred and unbarred galaxies in fixed bins of mass and colour. Once this effect is accounted for, there remains a small but statistically significant increase that represents 16 per cent of the average barred AGN fraction. Using the |$L_{\rm {[O\,{\small {iii}}]}}$|/MBH ratio as a measure of AGN strength, we show that barred AGNs do not exhibit stronger accretion than unbarred AGNs at a fixed mass and colour. The data are consistent with a model in which bar-driven fuelling does contribute to the probability of an actively growing black hole, but in which other dynamical mechanisms must contribute to the direct AGN fuelling via smaller, non-axisymmetric perturbations.
1 INTRODUCTION
Supermassive black holes exist at the centres of most (if not all) massive galaxies (Kormendy & Richstone 1995; Richstone et al. 1998; Kormendy & Gebhardt 2001; Ghez et al. 2008). The evolution of the black hole is closely tied to that of the host galaxy; hence, understanding the conditions that drive black hole growth is key for a complete picture of galactic evolution. While most black holes are not actively growing, a small fraction are observed to accrete matter and cause the surrounding material to emit powerful panchromatic radiation. The central region of a galaxy which encompasses these ‘active’ black holes, along with the surrounding accretion disc and ionized gas clouds, is an active galactic nucleus (AGN). Since the bolometric luminosity of the AGN can be comparable to (or greater than) the integrated stellar luminosity (as high as |$L\sim 10^{47}\,\rm {erg}\,\rm {s}^{-1}$|), the black holes have an important effect on the host galaxy, controlling the amount of star formation via AGN feedback, as well as contributing towards the net reionization of the intergalactic medium (Heckman & Best 2014). Understanding the fuelling mechanism(s) for AGNs is thus critical for studying galaxies, both in the nearby Universe and at higher redshifts.
The precise physics that govern the relationship between AGNs and their host galaxies is an area of intense study. This includes the AGN fuelling mechanism – while there is strong evidence that there is sufficient gas in the interstellar medium to keep the accretion disc supplied with enough material to radiate at typical bolometric AGN luminosities (Shlosman, Frank & Begelman 1989; Shlosman, Begelman & Frank 1990), the dynamical mechanisms that drive the gas within the black hole's sphere of influence are difficult to observe directly, especially at extragalactic distances. In order to initiate (or continue) AGN activity, gas must lose enough angular momentum in a short time frame to reduce its orbit from scales of kiloparsecs down to parsecs. Shlosman et al. (1989) analytically showed that while gas can lose angular momentum due to turbulent viscous processes, these are too slow to be the only mechanism involved. Later N-body simulations have shown that viscous torques on the gas are negligible and do not directly initiate inflows (Bournaud, Combes & Semelin 2005), further arguing for an additional method of radial gas transport.
One possibility is that the presence of a large-scale bar may supplement viscous torques and further drive AGN fuelling. Bars efficiently transport angular momentum within the disc (Athanassoula 2003; Kormendy & Kennicutt 2004), and are ubiquitous features in disc galaxies in the local Universe (Eskridge et al. 2000; Laurikainen, Salo & Buta 2004; Menéndez-Delmestre et al. 2007; Masters et al. 2011; Cheung et al. 2013). Simulations (Athanassoula 1992; Friedli & Benz 1993; Ann & Thakur 2005) show that stellar bars, whose lengths are of the order of kiloparsecs, do drive gas into the circumnuclear region (scales of 100 pc) of galaxies; observational studies have also shown an increase in the amount of central star formation for barred galaxies (Ellison et al. 2011). This combination of simple analytical models, simulations and observations clearly points towards galactic bars preferentially driving gas to the centres of their galaxies. It is still an open question, though, whether this gas is ultimately driven to the central 1–10 pc scales, which theoretical models suggest are required for accretion around the central black hole of the AGN.
Theoretical models for alternate modes to bar-driven fuelling also exist. Numerical simulations from Hopkins & Quataert (2010) examine several possible mechanisms behind angular momentum transport for a range of galaxy morphologies (bars, spirals, rings, clumpy and irregular shapes, mergers) at different radial scales. For each morphological type, gas transported from larger to smaller (∼1 kpc) radii ‘piles up’ due to decreasing efficiency in the processes that induce torque. If this pile-up of gas is sufficiently massive, it becomes self-gravitating and can efficiently transport angular momentum down to scales of ∼10 pc. This ‘stuff-within-stuff’ model is similar to the second half of Shlosman et al. (1989)'s ‘bars-within-bars’ model. The difference is that the ‘bars-within-bars’ model assumes that a large-scale bar is the primary mechanism that transports the gas inwards to form the gaseous disc, while Hopkins & Quataert (2010) show that many large-scale morphologies are capable of producing a secondary instability and fuelling an AGN, suggesting that this process may not be restricted to classic large-scale bars.
Many studies have focused on observational correlations between the presence of a galactic bar (typically identified at optical wavelengths) and that of an AGN (identified by optical line ratios or widths). Some studies (e.g. Ho, Filippenko & Sargent 1997; Mulchaey & Regan 1997; Hunt & Malkan 1999) find similar bar fractions for both AGNs and inactive galaxies and hence report no correlation. The significance of these fractions, however, is hindered by small sample sizes, typically with fewer than 100 barred AGN hosts. More recent studies (Knapen, Shlosman & Peletier 2000; Laine et al. 2002; Laurikainen et al. 2004) report increases of 20–23 per cent in the bar fractions for AGNs when compared to non-AGN hosts. Despite larger numbers of AGNs, the results are still only significant at the 2.5σ level. Rather than comparing the likelihood of active and inactive galaxies to host bars, as is most common among previous studies, Cisternas et al. (2013) accounted for a continuum of values by quantifying bar strength and activity level in local X-ray identified AGNs. While no correlation was found, these data probe only the low-luminosity AGN regime (LX ∼ 4 × 1038 erg s−1). In the high-redshift universe, Cheung et al. (2015) find no compelling evidence that bars are more likely to lie in AGN hosts than non-AGN hosts.
Several recent studies have focused on optical identifications of bars and AGNs, primarily using data from the Sloan Digital Sky Survey (SDSS). We compare these methods and results in Table 1. Among these studies, neither Lee et al. (2012) nor Martini et al. (2003) find any correlation between the presence of strong galactic bars and AGNs, but do not rule out the possibility of smaller, nuclear bars influencing AGN activity. In contrast, Oh, Oh & Yi (2012), Hao et al. (2009) and Alonso, Coldwell & Lambas (2013) all find evidence of bar effects in AGNs – however, they disagree on both the strength of the effect and whether it affects both black hole fuelling and/or central star formation. One possible reason for the discrepancy is the lack of a consistent scheme for classifying AGNs. While the BPT diagram based on optical line ratios (Baldwin, Phillips & Terlevich 1981) is among the most common methods for identifying AGNs, the demarcation between star-forming and AGN host galaxies is not consistent; some use the Kewley et al. (2001) criterion that excludes composite galaxies, while others use Kauffmann et al. (2003b) and include these along with Seyferts as AGNs. The inclusion of LINERs can also complicate the picture; the high line ratios in at least some LINERs are spatially extended and thus likely of a non-AGN origin (Sarzi et al. 2010; Yan & Blanton 2012; Singh et al. 2013).
Summary of recent studies comparing the presence of galactic bars and AGNs, including new results from this work. Martini et al. (2003) is the only study with neither uniform selection criteria for galaxies nor a volume-limited sample. AGN classifications from optical line ratios and the BPT diagram are separated by the following demarcations: Ke01 = Kewley et al. (2001); Ka03 = Kauffmann et al. (2003b); S07 = Schawinski et al. (2007).
| Martini et al. (2003) | Hao et al. (2009) | Lee et al. (2012) | Oh et al. (2012) | Alonso et al. (2013) | This work | |
|---|---|---|---|---|---|---|
| Redshift range | z < 0.038 | 0.01 < z < 0.03 | 0.02 < z < 0.055 | 0.01 < z < 0.05 | z < 0.1 | 0.01 < z < 0.05 |
| Abs. magnitude range | BT < 13.4 | 18.5 < Mg < −22.0 | Mr < −19.5 + 5log (h) | Mr < −19 | Mg < −16.5 | Mz,petro < −19.5 |
| Inclination limit | R25 < 0.35 | i < 60° | b/a > 0.6 | b/a > 0.7 | b/a > 0.4 | pnot edge-on > 0.6 |
| AGN classification method | Varied | FWHM(Hα) > 1200 km s− 1 and Ka03 | Ke01 | Ka03 | Ka03 | S07, WISE |
| AGN type(s) | Type 1 and 2 Seyferts, LINERs | Type 2 Seyfert, LINER, composite | Type 2 Seyfert, LINER | Type 2 Seyfert, LINER, composite | Type 2 Seyfert, LINER, composite | Type 2 Seyfert |
| Bar classification method | Visual inspection | Ellipse fitting | Visual inspection | Visual inspection | Visual inspection | Crowd-sourced visual inspection |
| Number of AGNs in the sample | 28 | 128 | 1742 | 1397 | 6772 | 681 |
| Fraction of AGN hosts that are barred | 28.6 per cent | 47 per cent | 49 per cent | 51 per cent | 28.5 per cent | 51.8 per cent |
Other challenges result from the task of identifying galactic bars, which is often done by visual inspection of optical images by individuals or small groups of experts. This introduces potential complications when there is disagreement between classifiers, especially in the cases of weak or nuclear bars. With only a single (or a few) classifications per image, such disagreements are difficult to resolve. Furthermore, individual visual inspection can limit the effective sample size due to the amount of time required to inspect images one by one. Our work avoids these problems by using crowd-sourced citizen science classifications to identify galactic bars, where many individuals (an average of 27 classifiers for bar detection in this study) analyse each galaxy, and the presence of a bar is quantified as a calibrated vote fraction.
This paper re-examines the relationship between bars and AGNs in disc galaxies by using Galaxy Zoo morphological classifications, and by using a strict AGN classification scheme which only selects Seyfert galaxies. We use these data to consider three physical scenarios for describing the role bars may (or may not) play in AGN fuelling: (I) bars are necessary to fuel AGNs; (II) bars are one of several ways to fuel AGNs, or (III) bars do not fuel AGNs. We discuss each of these possibilities in Section 4 and suggest the means by which the existence barred AGNs, unbarred AGNs, barred non-AGNs and unbarred non-AGNs may be explained within the context of each model. We then report the scenario which we find to be best supported by both our observations and current theoretical models and simulations.
In Section 2 we describe our sample selection. Section 3 includes our data, with mass and colour distributions of the different activity types, both barred and unbarred, as well as a comparison between accretion strengths of barred and unbarred AGNs. Interpretations of these results are discussed in Section 4, and the main conclusions are outlined in Section 5. We adopt a Λ cold dark matter cosmology throughout the paper of Ωm = 0.27 and H0 = 71 km s− 1 Mpc− 1 (Planck Collaboration et al. 2014).
2 DATA AND SAMPLE SELECTION
Our parent sample of galaxies is taken from the SDSS Data Release 7 (Abazajian et al. 2009). From the spectroscopic Main Galaxy Sample (Strauss et al. 2002), we select galaxies within the redshift interval 0.01 < z < 0.05 – the lower limit excludes galaxies whose angular size significantly exceeds the spectroscopic fibre, and the upper limit is chosen so that a reasonable estimate of bar detection can be made by visual inspection. From this, we create a volume-limited sample by applying an additional cut of Mz,petro < −19.5 AB mag.
Within the volume-limited sample, we use morphological cuts to select only disc galaxies at low inclination angles that are candidates for the presence of galactic bars (described below). These cuts result in the final sample of 19 756 disc galaxies used in the remainder of this paper.
2.1 Bar classifications and Galaxy Zoo 2
To select disc galaxies and measure the presence of a bar, we use data from the online citizen science project Galaxy Zoo 2 (GZ2).1 With the help of over 80 000 volunteers providing over 16 million classifications of over 300 000 galaxies, GZ2 is the largest extant survey of detailed galaxy morphology. Volunteers are shown colour images of galaxies taken from the SDSS (Fig. 1), and are then prompted through a decision tree in which they answer questions about the galaxy's structure. For a detailed discussion on the GZ2 project and its decision tree, see Willett et al. (2013).
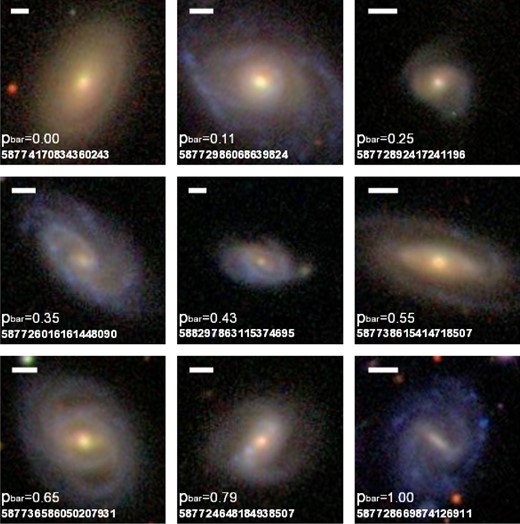
Examples of the SDSS images used in GZ2, sorted by increasing pbar (the weighted percentage of users that detected a bar in each image). All galaxies are from our final analysis sample of ‘not edge-on’ disc galaxies. The white line in the upper left of each image represents a physical scale of 5 kpc. We also give pbar and the SDSS object IDs for each galaxy. Top row: galaxies with pbar < 0.3, which in this paper are designated as unbarred. Middle and bottom rows: galaxies with pbar ≥ 0.3, which we designate as reliably barred.
Since bars only appear in disc galaxies, the sample must be limited to disc galaxies in which a bar can be seen via visual inspection. We begin by selecting galaxies for which at least 10 people answered the question, ‘Is there a sign of a bar feature through the centre of the galaxy?’, thus rejecting vote fractions with low statistical significance. Because questions in GZ2 are implemented as part of a decision tree (Willett et al. 2013), users must have identified a galaxy as a disc and as not edge-on before answering the bar question. In this way, the cut of Nbar ≥ 10 increases the likelihood that the galaxy in question is a candidate for having a bar. This cut is not complete, however, for galaxies which have a high number of total classifications. In these cases, the number of users to answer the bar fraction may still be small compared to the number of users identifying the galaxy as either not disc-like or as an edge-on galaxy. Therefore, cuts are also applied to the vote fractions relating to questions preceding the bar question. The first question of the GZ2 tree reads, ‘Is the galaxy simply smooth and rounded, with no sign of a disc?’ Willett et al. (2013) determined the threshold fraction of ‘features or disc’ answers required to classify the galaxy as a disc, when combined with the cut Nbar ≥ 10, to be pfeatures or disc ≥ 0.227. We emphasize that the cuts provided in Willett et al. (2013) are intended to be minimum values for determining well-sampled galaxies. We thus chose to adopt a slightly higher value of pfeatures or disc ≥ 0.35 to create the cleanest possible sample, based on a visual inspection of a subsample of galaxies with these cuts. To assess whether the results would be affected by this choice, we also created a sample with the original Willett et al. (2013) cuts. This choice increased the number of AGNs in the sample by 24, and did not affect the final results. Therefore, we present the sample using our more conservative cuts in this paper.
Following an answer of ‘features or disc’ for the first question, the volunteer is then asked ‘Could this be a disc viewed edge-on?’ Bars become increasingly difficult to detect in galaxies at high inclination angles, and are nearly impossible to detect in edge-on galaxies without careful isophotal mapping. The threshold vote fraction determined by Willett et al. (2013) of a ‘No’ answer to this question is pnot edge-on ≥ 0.519. We again adopt a slightly more conservative value of pnot edge-on ≥ 0.6 based on visual inspection of a subsample. The combination of feature/disc galaxies that are not edge-on for these two thresholds results in the final sample size of 19 756 galaxies used in this paper.
As a check that our selection of ‘not edge-on’ disc galaxies can be reliably used to identify a bar, we examine the inclination angle of the sample, which is approximated by the ratio of the best fit of the semi-major and semi-minor axes i = cos −1(a/b) as measured in the r band by the SDSS pipeline. Fig. 2 shows the strong correlation between i and pnot edge-on, with a sharp cutoff near i = 70°. Our cutoff of pnot edge-on ≥ 0.6 effectively limits the sample to inclination angles of i < 67°. In Fig. 2, we also show the dependence of the GZ2 bar fraction on pnot edge-on. The bar fraction remains roughly constant (±0.1) within 0.3 < pnot edge-on < 1.0 and drops to zero at pnot edge-on < 0.1. Since the true bar fraction is expected to be independent of i (a purely geometrical effect assumed to have a random distribution), any change in the bar fraction would reflect the ability of visual inspection to detect a bar in a highly inclined disc. The constant bar fraction out to our limit of pnot edge-on ≥ 0.6 (and well beyond) is a necessary requirement for an unbiased selection of barred galaxies; as a result, we are confident that the crowd-sourced bar classifications in this sample are reliable.
![Left: fraction of ‘not edge-on’ votes versus inclination angle (i = cos −1[a/b]) for the disc galaxies in our GZ2 sample. An angle of 0° means the galaxy is completely face-on, while 90° is completely edge-on. GZ2 users consider a galaxy as ‘not edge-on’ if the inclination angle is less than i ∼ 70°. Right: fraction of barred galaxies versus fraction of ‘not edge-on’ galaxies. The bar fraction is independent of the edge-on degree of the galaxies (above pnot edge-on ∼0.3); the ability of users to detect bars does not decrease with inclination until pnot edge-on∼0.3 or i ∼ 70°. Error bars are 95 per cent Bayesian binomial confidence intervals (Cameron 2011). This demonstrates that GZ2 data can reliably identify bars even in moderately inclined disc galaxies.](https://oup.silverchair-cdn.com/oup/backfile/Content_public/Journal/mnras/448/4/10.1093_mnras_stv235/2/m_stv235fig2.jpeg?Expires=1716397933&Signature=NiPnHJhKKuEr-NxND6WUFIj28OKksLbZJqm4Ydy2-Gw5HSh5Y4IhjplYaH-A9Rn6ewQtKy6k7e67du59KNlqybGYF1-i0UlT6psK46RBY7xRGKk4Q3QEyx5xjMgeTCTWHh2xhqFpEU6oImA093ithG9sKPHSF8JUVRzRNxSAXQPQ1zktsgU3UnpzDx5erb25vmBR2loBFrv3Dq3QhsdnNoQjM22qWfNo60Eosz3mQfCT2Gc5i5~YbCUS764akYwZdWdKkfVskCdjA2YGlPIu7waEZXgu~rxX28Tm230vodZboWF1k~BuQxSEajSd0CuG34wfbA8WgSKofG-GCfvbKA__&Key-Pair-Id=APKAIE5G5CRDK6RD3PGA)
Left: fraction of ‘not edge-on’ votes versus inclination angle (i = cos −1[a/b]) for the disc galaxies in our GZ2 sample. An angle of 0° means the galaxy is completely face-on, while 90° is completely edge-on. GZ2 users consider a galaxy as ‘not edge-on’ if the inclination angle is less than i ∼ 70°. Right: fraction of barred galaxies versus fraction of ‘not edge-on’ galaxies. The bar fraction is independent of the edge-on degree of the galaxies (above pnot edge-on ∼0.3); the ability of users to detect bars does not decrease with inclination until pnot edge-on∼0.3 or i ∼ 70°. Error bars are 95 per cent Bayesian binomial confidence intervals (Cameron 2011). This demonstrates that GZ2 data can reliably identify bars even in moderately inclined disc galaxies.
Finally, if the volunteer answers ‘No’ to the edge-on question, he or she is asked ‘Is there a sign of a bar feature through the centre of the galaxy?’ Possible answers to this question are either ‘Bar’ or ‘No bar’. Willett et al. (2013) compared expert classifications of barred galaxies from both Nair & Abraham (2010) and Baillard et al. (2011) to GZ2 data, and show that a threshold of pbar ≥ 0.3 is the most reliable separator of the barred from unbarred population (see their fig. 10). We adopt the same threshold of pbar ≥ 0.3 for determining whether a galaxy has a bar (see Fig. 1 for images of galaxies with different values of pbar).
We compare our morphology cuts to those used by Masters et al. (2011), who used an early release of GZ2 data to identify barred galaxies. Their study also required Nbar ≥ 10 and claim that this cut alone is sufficient to restrict the sample to disc galaxies without applying an additional cut on pfeatures or disc. This assumption was reasonable at the time since the GZ2 project was still collecting data, and the number of classifications per galaxy was lower than that in the final catalogue. The median number of classifications per galaxy is roughly 30 per cent higher, and so our data are more susceptible to contamination by non-disc galaxies with high classification counts. This makes an additional cut on pfeatures or disc necessary. To remove edge-on discs, Masters et al. (2011) set an inclination limit of log (a/b) < 0.3, or i ∼ 60°; this is comparable to our pnot edge-on cut, which corresponds to roughly i ∼ 67°. To select barred galaxies, a majority vote fraction of pbar > 0.5 was required, higher than our value of pbar ≥ 0.3. We are nevertheless confident in our threshold which was determined by the more recent and detailed analysis of the GZ2 data by Willett et al. (2013) as described above. Additionally, the data released at the time of Masters et al. (2011) had not yet been reduced via weighting and debiasing; these differences in vote fractions also contribute to the different cuts used in our study.
2.2 Activity type classification
We use flux measurements from the 2012 release of the OSSY catalogue (Oh et al. 2011) to classify disc galaxies as either star-forming, composite, AGNs, LINERs or quiescent (also known as ‘undetermined’). This method employs ratios of [O iii]/Hβ fluxes as a function of [N ii], [S ii] or [O i] over Hα according to the BPT diagnostics. Our method for selecting AGNs is the same as used by Schawinski et al. (2007, 2010). First, we use the [N ii]/Hα ratio (Fig. 3a). Any galaxy that does not have S/N > 3 for any of the four lines is unclassifiable via this method (possibly due to being gas-poor) and labelled ‘undetermined’. Next, any galaxy which falls below the Kewley et al. (2001) extreme starburst line is classified as star-forming, and those that fall between this and the Kauffmann et al. (2003b) empirical starburst line are classified as composite. We note that some of these composite galaxies may be potential AGNs, but we cannot cleanly separate the AGN contribution from star formation and thus exclude them from our sample (Schawinski et al. 2010).
![Optical line diagnostics for activity types of 19 756 disc galaxies. Any galaxy with S/N < 3 for [O iii], Hβ, [N ii] or Hα is unclassifiable using this method and labelled as ‘undetermined’. The 3619 undetermined galaxies do not appear on the diagram above. The remaining 16 137 galaxies were categorized according to the above diagrams in the following order, based on the method of Schawinski et al. (2007). First, diagram (a) was used to identify star-forming and composite galaxies. Any galaxy below the Ka03 line was classified as star-forming, while those that fell between the Ka03 and Ke01 lines were classified as composite. Next, to distinguish AGNs from LINERs, we use diagrams (b) and (c). If a galaxy had S/N > 3 for [O i], diagram (c) was used. If a galaxy did not have S/N > 3 for [O i], but did for [S ii], diagram (b) was used. Last, if a galaxy did not have S/N > 3 for [O i] or [S ii], but did for [N ii], diagram (a) was used. In each panel, only galaxies with S/N > 3 for all four lines required by that diagram are shown. Galaxies designated AGNs by any of the three optical line diagnostics are plotted as blue points, while the black shading represents the full sample of emission-line galaxies.](https://oup.silverchair-cdn.com/oup/backfile/Content_public/Journal/mnras/448/4/10.1093_mnras_stv235/2/m_stv235fig3.jpeg?Expires=1716397933&Signature=Zxm2icxqFhG0k4SXhROPVy13Ea61bRJeMIkXOe9Ix44FZ5M8StYjIiqV9NKsbnErp2cC23vOdJcBmDwkm-zlHW18oxwSUZJF4I6bVeeCetLuNz~QBoL6ZDR-U3Z81Os3Fm9pbc6CM~ZKx2hDivieZhlhIFx8SemPVsmfDag4J0iRwJnW5DuARWvEEZaQKMQSt4sVFwVD3V8oVhKu4bpcVVvO~iFjIlj~LBKQg0lSgWHqoNr7cQgCsRgYOEurFSCjv8MF9RLHJngM1VhpihbaDOD8YGuPtnehj9m-ZcDv0UQPqf90KkhUFv3uMO5QKUM-tmkdPbc0lood0hVYvz86ug__&Key-Pair-Id=APKAIE5G5CRDK6RD3PGA)
Optical line diagnostics for activity types of 19 756 disc galaxies. Any galaxy with S/N < 3 for [O iii], Hβ, [N ii] or Hα is unclassifiable using this method and labelled as ‘undetermined’. The 3619 undetermined galaxies do not appear on the diagram above. The remaining 16 137 galaxies were categorized according to the above diagrams in the following order, based on the method of Schawinski et al. (2007). First, diagram (a) was used to identify star-forming and composite galaxies. Any galaxy below the Ka03 line was classified as star-forming, while those that fell between the Ka03 and Ke01 lines were classified as composite. Next, to distinguish AGNs from LINERs, we use diagrams (b) and (c). If a galaxy had S/N > 3 for [O i], diagram (c) was used. If a galaxy did not have S/N > 3 for [O i], but did for [S ii], diagram (b) was used. Last, if a galaxy did not have S/N > 3 for [O i] or [S ii], but did for [N ii], diagram (a) was used. In each panel, only galaxies with S/N > 3 for all four lines required by that diagram are shown. Galaxies designated AGNs by any of the three optical line diagnostics are plotted as blue points, while the black shading represents the full sample of emission-line galaxies.
Next, we identify the remaining galaxies (above the extreme starburst line) as either Seyfert AGNs or LINERs. Kewley et al. (2006) showed that both [O i]/Hα and [S ii]/Hα diagrams are better suited to distinguish AGNs from LINERs; we thus use diagram (c) in Fig. 3 if these galaxies also have S/N > 3 in [O i]. For galaxies which do not have S/N > 3 in [O i], but do in [S ii], we use diagram (b). In both cases, we use the AGN–LINER division line of Kewley et al. (2006). For the remaining galaxies, we use diagram (a) and implement the AGN–LINER division line of Schawinski et al. (2007).
Finally, to detect any AGN that may have been optically misclassified due to obscuration, we identify AGNs based on their infrared continuum shape using data from the Wide-field Infrared Survey Explorer (WISE; Wright et al. 2010). We identify as an AGN any galaxy with (W1 − W2) ≥ 0.8 (Stern et al. 2012). Based on infrared data, we re-classified 14 galaxies (originally classified optically as 3 star-forming, 10 composites and 1 LINER) as AGNs.
We show the results of the activity type and morphological classifications in Table 2. The numbers and fractions of each activity type with respect to the full sample are shown, as well as the numbers and fractions of barred galaxies within each activity type. These results are discussed in Section 3.
Results of activity classification for our sample of 19 756 not edge-on disc galaxies. ftotal is the percentage of the total sample represented by each activity (number of galaxies of that type/total number of galaxies). fbar is the percentage of each subsample that are barred (number of galaxies of that type that are barred/total number of galaxies in that type). Errors are 95 per cent Bayesian binomial confidence intervals (Cameron 2011).
| All discs | Barred discs | ||||
|---|---|---|---|---|---|
| Activity type | Number | ftotal (per cent) | Number | fbar (per cent) | |
| Star-forming | 11 282 | |$57.1^{+0.7}_{-0.7}$| | 4183 | |$37.1^{+0.9}_{-0.9}$| | |
| Composite | 2853 | |$14.4^{+0.6}_{-0.4}$| | 1301 | |$45.6^{+1.8}_{-1.8}$| | |
| AGN | 681 | 3.4|$^{+0.3}_{-0.2}$| | 353 | 51.8|$^{+3.8}_{-3.7}$| | |
| LINER | 1321 | 6.7|$^{+0.4}_{-0.4}$| | 695 | 52.6|$^{+2.7}_{-2.7}$| | |
| Undetermined | 3619 | 18.3|$^{+0.6}_{-0.5}$| | 1654 | 45.7|$^{+1.6}_{-1.6}$| | |
| Total | 19 756 | 100 | 8186 | 41.4|$^{+0.7}_{-0.7}$| | |
3 RESULTS
To determine whether a correlation exists between galaxies that host an AGN and those that contain large-scale stellar bars, we examine the fractions of barred and unbarred AGNs with respect to mass, colour and AGN strength. We use stellar masses from the AVERAGE values in the MPA-JHU DR7 catalogue (Kauffmann et al. 2003a). Colours are 0.0(u − r) values from SDSS DR7, which have been both de-reddened for Galactic extinction and k-corrected to redshift z = 0.0 (Csabai et al. 2003). Stellar velocity dispersions are taken from Oh et al. (2011). An excerpt of these data may be found in Table 4.
3.1 Barred AGN fraction at a fixed mass and colour
Fig. 4 shows the distributions of mass and colour for AGN and star-forming activity types, split into barred and unbarred subsamples. The median AGN is more massive (by 0.6 dex) and redder (by 0.5 mag) than the median star-forming galaxy. This agrees with previous optical studies of AGNs and star-forming galaxies in the local Universe (Schawinski et al. 2007; Lee et al. 2012; Oh et al. 2012; Alonso et al. 2013). Aird et al. (2012) demonstrate that this difference is primarily caused by selection effects relating to the underlying Eddington ratio distribution. The probability of a galaxy hosting an AGN is assumed to be independent of stellar mass, and thus AGNs are prevalent at all masses in the range 9.5 < log (M/M⊙) < 12, despite only being observable at higher masses. As a result, we expect higher absolute numbers of barred AGNs in a flux-limited sample since barred disc galaxies are also on average redder and more massive than unbarred disc galaxies (Masters et al. 2011, 2012). We interpret this as the primary cause for the higher fraction of barred AGNs (51.8 per cent) versus barred star-forming (37.1 per cent) galaxies in Table 2.
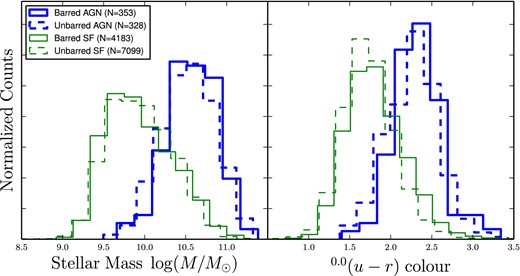
Mass and colour distributions for disc galaxies in the GZ2 sample, separated by both activity type (either AGN or star-forming as in Table 2) and the presence of a galactic bar. AGNs (blue) are on average both significantly redder and more massive than star-forming galaxies (green). When splitting the disc galaxies into barred (solid lines) and unbarred (dashed lines), however, there is no significant difference between the two populations. Counts are normalized so that the sum of bins is equal to 1 for each sample.
To control for this selection effect, we examine the fraction of AGNs at fixed masses and colours (Fig. 5). The total disc galaxy sample spans a mass range 9.0 < log (M/M⊙) < 11.5, while the colour range extends within 1.0 < (u − r) < 3.5. AGN hosts are found throughout the disc galaxy sample, but most appear in galaxies with log (M) > 1010 M⊙. When examining the fraction of galaxies with an AGN as a function of mass and colour, redder and more massive galaxies have AGN fractions as high as 10 per cent. Bins with fewer than 10 total AGNs (barred AGNs + unbarred AGNs) are masked to minimize variance from small sample sizes. The same trend is also seen when splitting the disc galaxy sample into barred and unbarred subsamples.
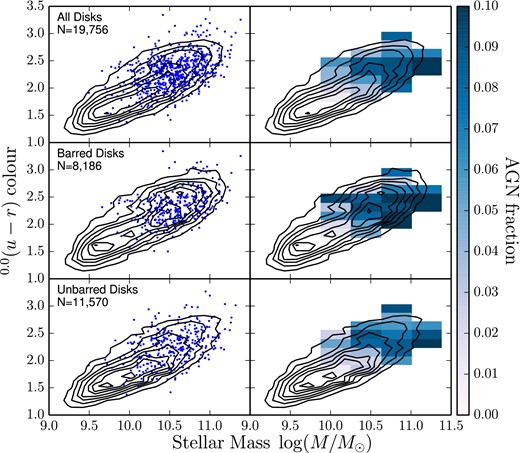
Optical colour versus stellar mass for disc galaxies in GZ2. Black contours represent all disc galaxies (top), all barred galaxies (middle) or all unbarred galaxies (bottom). All AGNs (top), barred AGNs (middle) and unbarred AGNs (bottom) are plotted in the left-hand panels as blue dots; the right-hand panels show the AGN fraction in each colour/mass bin. Bins with NAGN < 10 are masked.
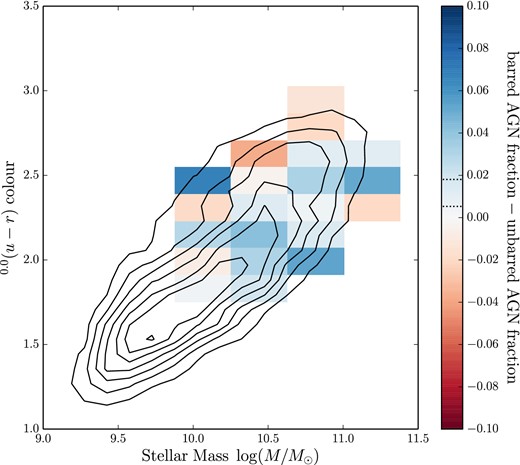
Optical colour versus stellar mass for barred and unbarred disc galaxies in GZ2. Coloured bins show the difference between the AGN fractions for barred and unbarred galaxies. Blue bins have higher fractions of barred galaxies, red bins have more unbarred galaxies and pale/white indicates no difference. The region on the colour bar enclosed by the dotted lines represents the mean of the data determined by the Anderson–Darling test. The colour gradient is on the same scale as Fig. 5. Bins with NAGN < 10 are masked.
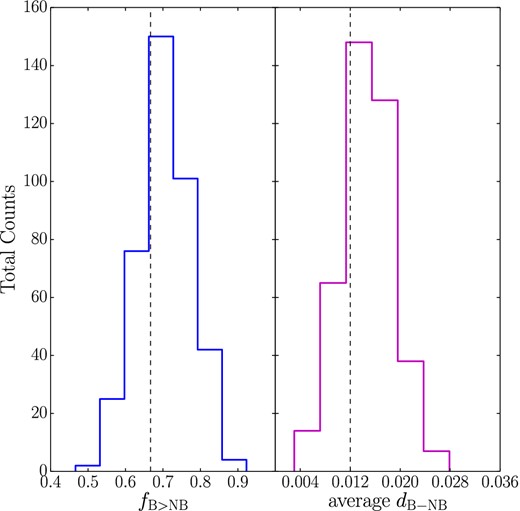
Distributions of the difference in the fraction of bins with excesses of barred AGNs (fB > NB) and the average difference between barred and unbarred AGN fractions (dB–NB). Both values are computed for 400 variations in the mass and colour bin widths. Left: the average fraction of bins with a higher barred AGN fraction is fB > NB = 0.705 ± 0.073. Right: the average difference in barred and unbarred AGN fractions is dB–NB = 0.015 ± 0.004. Dashed black lines indicate the values of fB > NB and average dB–NB used in Fig. 6 and subsequent analysis.
For the first time among recently published studies, we quantify the level of correlation between the presence of a bar and AGN through statistical analysis. We test the null hypothesis that in the absence of a causal link, the difference between barred and unbarred AGN fractions when binned by mass and colour should be centred around zero. The null hypothesis also requires that the likelihood distribution decreases symmetrically from zero in both directions; as a result, we assume a normal distribution with mean μ = 0 and standard deviation σ. Other models of the null hypothesis could of course also be tested, but we adopt this as the simplest reasonable scenario that fits the constraints of the problem.
To assess the level of statistical significance, we fit the data in Fig. 6 with a range of models with varying mean (dB–NB) and standard deviation (σd) and then apply an Anderson–Darling test. We selected this test because it has been empirically shown to be more powerful and reliable at testing normality than traditional χ2 or Kolmogorov–Smirnov (KS) tests, especially with small (n < 30) sample sizes (Hou et al. 2009). The confidence threshold required for the model to pass at fitting the data is 95 per cent. In Fig. 8, we show the distribution of the Anderson–Darling statistic A2 as a function of σd for two of the tested models: the null hypothesis (dB–NB = 0) and the best fit to the data (dB–NB = 0.012). The null hypothesis fails the Anderson–Darling test for all values of σd, indicating that the |$66.7\, \mathrm{per\, cent}^{+16.1\,\mathrm{per\, cent}}_{-21.6\,\mathrm{per\, cent}}$| fraction of bins that have a higher barred than unbarred AGN fraction is statistically significant. The best fit to the data, by contrast, has a mean of dB–NB = |$0.012^{+0.007}_{-0.007}$| and σd = 0.028. The positive value of dB–NB indicates an increase in the AGN fraction for barred galaxies, consistent with the hypothesis that at least some fraction of AGN activity is triggered or sustained by bar-driven fuelling.
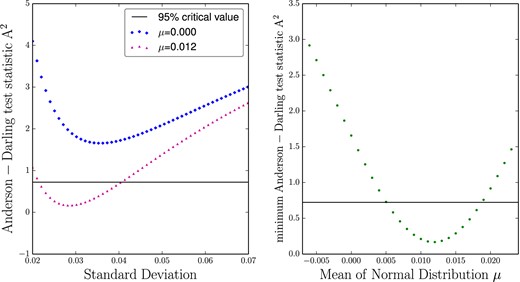
Fits of the binned fraction of barred versus unbarred AGN fractions to a normal distribution. Left: value of the Anderson–Darling test (A2) as a function of the standard deviation of the normal distribution being fit (σd). The horizontal black line shows the critical value of A2 corresponding to 95 per cent; a model must fall below this line to be considered an acceptable fit at this level of confidence. Two models are shown: the null hypothesis (blue diamonds) and the best fit to the data in Fig. 6 (purple triangles). Right: plot of the minimum A2 for the full range of means (dB–NB) tested for the data. This shows that acceptable fits can be found for 0.005 < dB–NB < 0.019, but that the null hypothesis is ruled out at 95 per cent confidence.
3.2 Comparing barred and unbarred AGN accretion strengths
It has been demonstrated for smaller samples of galaxies that the parameters α and β vary as a function of morphological type (Gültekin et al. 2009; Graham et al. 2011; Brown et al. 2013), including differences between barred and unbarred galaxies. We choose not to use (α, β) parameters where (α, β) are derived from separate subsamples for two reasons. First, since the MBH–σ relation is calibrated from small samples of nearby galaxies, the statistical error on the parameters increases as galaxies are divided into smaller sub-groups. The calibration of Gültekin et al. (2009), for instance, is based on measurements of only eight barred galaxies. The error in β for the barred MBH–σ relation is σβ = ±0.751, almost twice the error obtained by fitting to the full sample of disc galaxies. Secondly, while different studies report consistent values for α and β when all disc galaxies are considered, the values can vary significantly when splitting by morphological type. Lee et al. (2012) and Alonso et al. (2013) use separate values for (α, β) and report conflicting levels of agreement, depending on which parameters are used. This raises the possibility that differences in AGN strength are simply due to differences in calibration parameters, and not in the true distribution of accretion efficiencies.
Fig. 9 shows the relative accretion strengths R for our sample as a function of mass and colour for both barred and unbarred AGNs; these values are inversely correlated with both mass and (u − r) colour. This trend is likely driven by the same selection effects described in Section 3.1 (Aird et al. 2012). At a fixed |$L_{\rm {[O\,{\small {iii}}]}}$|/MBH ratio, AGNs with lower mass black holes are less likely to be detected due to the signal-to-noise requirements on their spectral lines. This biases the distribution of R towards higher mass black holes. Since stellar mass is strongly correlated with black hole mass (Häring & Rix 2004; Gültekin et al. 2009; Merloni et al. 2010), and stellar mass correlates with optical colour (Kauffmann et al. 2003a), this explains the trend seen in both parameters for an uncorrected sample.
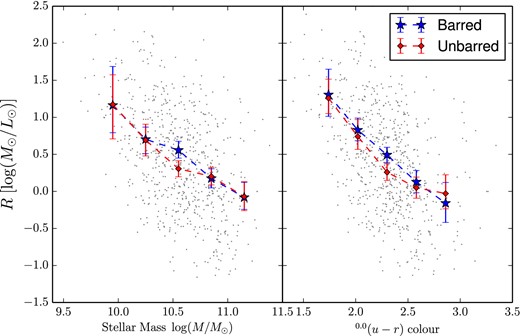
Left: relative accretion strength R versus stellar mass for barred (blue) and unbarred (red) AGNs in our sample. R is plotted as the mean of values within five equal-width bins in the range 9.8 < log (M/M⊙) < 11.3, which includes 98 per cent of the AGN sample. Points are drawn at the mid-point of each bin. Right: R versus colour for barred and unbarred AGNs. R is plotted as the mean of values within five equal-width bins in the colour range 1.6 < (u − r) < 3.0, which includes 96 per cent of the AGN sample. Error bars for each plot are 95 per cent confidence intervals, calculated by bootstrapping with 1000 times resampling. There is no significant difference in accretion strengths for barred and unbarred AGNs as a function of either mass or colour.
Since these observationally driven selection effects are likely to affect barred and unbarred galaxies equally, we compare the values of R of both groups without any corrections. A two-sided KS test yields a p-value of p = 0.127 for the two distributions. This is consistent with both the barred and unbarred galaxies being drawn from the same distribution. We thus conclude that there is no strong evidence for a difference in accretion strength between barred and unbarred AGNs.
This result contradicts Alonso et al. (2013), who found an excess of barred AGNs with high values of R. We conjecture that this may be the result of their sample selection, which excluded galaxies with M⋆ < 1010 M⊙ in favour of a higher redshift limit of z = 0.1. However, low-mass galaxies have higher |$L_{\rm {[O\,{\small {iii}}]}}$|/MBH ratios and are more likely to be unbarred than their higher mass counterparts (Lee et al. 2012). If this effect is real, it appears to be limited to high-mass galaxies (which themselves are subject to selection effects due to the methods used to measure R). Additionally, Alonso et al. (2013) include composites and LINERs in their sample of AGNs. If the activity from these galaxies is not primarily from black hole accretion, R is not a true proxy for accretion strength, and comparisons between barred and unbarred galaxies do not accurately probe differences between the two populations. To test this, we compare R distributions for barred and unbarred composite + AGNs + LINER galaxies with M⋆ > 1010 M⊙. For these galaxies, the difference in the average values of R for the barred and unbarred samples is 0.09 (L⊙/M⊙)−1 (compared to a difference of 0.06 (L⊙/M⊙)−1 when considering only AGNs with no cut on stellar mass), and a KS test for the distributions yields a p-value <0.01, which agrees with the results of Alonso et al. (2013). We note that our results are consistent with Lee et al. (2012), who have a similar mass range to our sample of disc galaxies, and do not include composites in their sample.
4 DISCUSSION
We have compared a sample of 353 barred Seyfert AGNs to 328 unbarred Seyferts and measure the potential correlation between the presence of the bar and the AGN. We find that at fixed mass and colour, AGN hosts show a small increase in the fraction of galaxies that are barred. The average difference is dB–NB = 0.012, or roughly 16.0 per cent of the average barred AGN fraction. We find no difference in the |$L_{\rm {[O\,{\small {iii}}]}}/$|MBH ratio between barred and unbarred AGNs at either fixed mass or colour. We conclude that while AGN hosts have moderately higher probabilities of hosting a bar, the presence of the bar does not seem to affect either the quantity or efficiency of fuelling the central black hole.
If bars are not required to initiate AGN fuelling, then what is the source? There must be a process that transports angular momentum through the galactic disc and creates/maintains an accretion disc. Both theoretical models (Shlosman et al. 1989, 1990) and numerical simulations (Hopkins & Quataert 2010) indicate that this process requires two stages. First, the gas must be driven from a radial scale of megaparsecs down to kiloparsecs. Standard viscous torques on the gas are too inefficient to initiate gas inflow by themselves (Shlosman et al. 1989; Bournaud et al. 2005); therefore, some other mechanism is required. Within the central kiloparsec, a secondary instability must take over within the gaseous disc for AGN fuelling to occur.
In the context of this general model, we consider three possibilities: (I) bars are a necessary ingredient for fuelling AGNs, (II) bars are one of multiple processes that fuel AGNs, or (III) bars play no role in fuelling AGNs. We also discuss in each scenario possible explanations for the existence of all four observed combinations: barred AGNs, unbarred AGNs, barred non-AGNs and unbarred non-AGNs.
4.1 Scenario I: bars are necessary to fuel AGNs
If the presence of a stellar bar is the only mechanism by which gas can be driven to the ∼1 kpc scale, there must be a reason both barred and unbarred AGNs are observed in large numbers. One possibility is that a galactic bar initiates fuelling of the black hole, but is subsequently destroyed in a dynamic time-scale shorter than the lifetime of the AGNs. These separate time-scales are not currently known with certainty, but estimates place the lifetime of an AGN to be 106–108 yr (e.g. Martini 2004; Schawinski et al. 2010). The range of bar lifetimes is not yet firmly established; some models show bars to be transient features that are destroyed either due to buckling from angular momentum transport or from the build-up of a central mass concentration (CMC; Bournaud et al. 2005; Combes 2008). In these models, the lifetime of a bar is estimated to be 1–2 Gyr. Kraljic, Bournaud & Martig (2012) also found bars to be short-lived in their simulations, but only early bars (formed at z > 1). Bars formed later (at z < 1) were maintained down to z = 0, giving a lifetime of at least 8 Gyr.
Other simulations (Debattista et al. 2004, 2006; Shen & Sellwood 2004; Athanassoula, Lambert & Dehnen 2005; Athanassoula, Machado & Rodionov 2013) do not observe bar destruction due to buckling. In these cases, only a sufficiently massive CMC is capable of destroying the bar on Gyr time-scales. The mass of the CMC required in these models is at least several per cent of the total mass of the disc – this is significantly larger than the mass measured in local disc galaxies. If the CMC is insufficiently large, the bar is maintained for the lifetime of the disc (up to 10 Gyr; Athanassoula et al. 2013), and thus should be observable for at least the lifetime of the AGN.
If bars are truly long-lived structures in all disc galaxies and are necessary to fuel AGNs, we would expect a much higher value of the ratio of barred to unbarred AGN hosts. Since the observed numbers are nearly 1:1, we consider this scenario highly unlikely. It is possible that bars are necessary to fuel AGNs, but the number of observed unbarred AGNs can only be explained if the factor of ∼10 difference between the upper end of the AGN lifetime and the lower end of the bar lifetime can be resolved. While this is possible, we consider it unlikely given the assumptions required.
4.2 Scenario II: bars are one of several ways to fuel AGNs
If stellar bars are only one of several ways to fuel AGNs, then both barred and unbarred AGNs should exist (as should both barred and unbarred star-forming galaxies). The simulations conducted by Hopkins & Quataert (2010) support this model, which show that multiple large-scale mechanisms (including a stellar bar) can be responsible for transporting gas to scales required for AGN fuelling. Further, if bar-driven fuelling is responsible for some fraction of the AGNs, this model predicts an increase in the fraction of barred AGNs, which our data support.
While the existence of unbarred AGNs is explained by this model, there is no immediate explanation for the existence of barred galaxies that do not host AGNs; here we suggest several possibilities. First, a bar that initiates AGN fuelling may simply outlive the AGN (see Section 4.1), which agrees with estimates of both bar and AGN lifetimes. Secondly, there could be a correlation between bar strength and AGN activity, where only sufficiently strong bars initiate fuelling. This is consistent with Lee et al. (2012), who find a higher AGN fraction in barred galaxies where the bar length is at least 1/4 of the total disc diameter. They did not test, however, whether this relationship remains at fixed mass and colour. Finally, the emission from an AGN is expected to be highly variable with time, driven by processes such as accretion disc instabilities and/or feedback within the accreting material (Hickox et al. 2014). In this case, barred galaxies without AGNs are simply observed in low parts of their duty cycle, with Eddington ratios too low to be detected at the limits of our observations.
4.3 Scenario III: bars do not fuel AGNs
Finally, we consider the possibility that stellar bars do not trigger AGN activity in any way. This is inconsistent (although marginally so) with the increase in barred versus unbarred AGN fractions that we find at fixed mass and colour. One possibility is that the model used for the null hypothesis (a normal distribution centred at dB–NB = 0) does not apply. Detailed simulations of cosmological volumes that include both AGN and detailed disc morphology, such as Illustris (Vogelsberger et al. 2014) and EAGLE (Schaye et al. 2014), should ultimately provide more well-defined priors for this.
In addition, our test of the null hypothesis could still be consistent with a strong effect even if the total numbers of barred and unbarred bins were equal. For example, if bar-driven fuelling is strongly mass dependent, the dB–NB bins could have excesses of barred AGNs at high masses and deficits at low masses; this would still be consistent with a distribution centred at zero. We test the simplest cases by simply splitting the sample into two in both mass and colour (Table 3). Low- and high-mass disc galaxies (dividing the sample at log (M/M⊙) = 10.625) have nearly identical values of fB > NB and mean dB–NB; there is no evidence of a mass-dependent effect on bar-driven AGN fuelling. When splitting discs into red versus blue (at a colour of (u − r) = 2.22), bluer galaxies do have significantly more bins with an excess of barred AGNs (fB > NB = 0.88) than redder galaxies (fB>NB = 0.54). The uncertainties on fB > NB are quite large, though, since each subsample has less than a dozen bins. Our splits by colour agree with Oh et al. (2012), who find that bar effects on AGN are more pronounced in bluer and less massive galaxies. Lee et al. (2012), in contrast, find that fB>NB depends on neither mass nor colour.
Difference between barred and unbarred AGN fractions for disc galaxies when splitting the sample in two by both mass and colour. fB > NB is the fraction of bins that show an excess of barred AGNs (compared to unbarred), while dB–NB is the average value of the differences over all bins. Since the number of bins in each subsample is only ∼8–13 when splitting by mass or colour, the uncertainty in fB > NB is correspondingly large.
| Sample | fB > NB | Mean dB–NB | |
|---|---|---|---|
| Low mass | log (M/M⊙) < 10.625 | 0.70 | 0.0125 |
| High mass | log (M/M⊙) > 10.625 | 0.64 | 0.0123 |
| Blue | (u − r) < 2.22 | 0.88 | 0.023 |
| Red | (u − r) > 2.22 | 0.54 | 0.006 |
| Sample | fB > NB | Mean dB–NB | |
|---|---|---|---|
| Low mass | log (M/M⊙) < 10.625 | 0.70 | 0.0125 |
| High mass | log (M/M⊙) > 10.625 | 0.64 | 0.0123 |
| Blue | (u − r) < 2.22 | 0.88 | 0.023 |
| Red | (u − r) > 2.22 | 0.54 | 0.006 |
GZ2 catalogue of ‘not edge-on’ disc galaxies.
| SDSS DR7 | RA | Dec. | Mz, petro | (u − r) | Redshift | BPT | Mstar | σ | R | pfeatures | pnot edge-on | pbar | Nbar |
|---|---|---|---|---|---|---|---|---|---|---|---|---|---|
| object ID | J2000 | J2000 | class | [log (M⊙)] | (km s−1) | (M⊙/L⊙) | or disc | ||||||
| 587742191520383064 | 196.5630 | 25.4605 | −21.26 | 1.52 | 0.024 | 1 | 10.14 | 51.9 ± 5.4 | 0.9 | 0.839 | 1.000 | 0.689 | 27 |
| 588010358534504619 | 146.0390 | 3.4041 | −19.72 | 1.84 | 0.024 | 1 | 9.54 | – | – | 0.918 | 0.763 | 0.433 | 29 |
| 588017947743813765 | 192.2322 | 41.7789 | −21.22 | 2.18 | 0.040 | 4 | 10.37 | 116.5 ± 5.8 | −0.0 | 0.828 | 1.000 | 0.319 | 19 |
| 587739828744945846 | 230.4270 | 20.5889 | −21.01 | 2.59 | 0.042 | 3 | 10.45 | 90.8 ± 3.7 | 0.3 | 0.696 | 0.982 | 0.000 | 10 |
| 587742062156382262 | 208.7955 | 21.3264 | −20.63 | 1.57 | 0.029 | 1 | 9.99 | 57.5 ± 3.6 | 0.7 | 0.702 | 1.000 | 0.377 | 24 |
| 587738570318675978 | 195.6816 | 15.5068 | −21.30 | 1.62 | 0.022 | 1 | 10.27 | 65.0 ± 4.6 | 0.3 | 0.940 | 1.000 | 0.000 | 32 |
| 588018055124746527 | 244.2345 | 32.9439 | −21.95 | 3.12 | 0.031 | 0 | 10.85 | 194.0 ± 3.9 | −1.3 | 0.931 | 0.893 | 0.978 | 34 |
| 587726032763748389 | 130.4313 | 1.5305 | −21.78 | 3.27 | 0.050 | 3 | 10.95 | 137.0 ± 5.7 | −0.0 | 0.980 | 0.943 | 0.293 | 51 |
| 587742550688596007 | 237.4456 | 12.3993 | −21.08 | 2.08 | 0.015 | 3 | 10.22 | 83.0 ± 2.3 | 0.8 | 0.852 | 0.965 | 0.145 | 28 |
| 587739098060619830 | 177.2420 | 37.5949 | −20.36 | 1.38 | 0.038 | 1 | 9.81 | 46.5 ± 11.5 | 1.2 | 0.758 | 0.673 | 0.000 | 11 |
| 587732470385279247 | 124.6074 | 29.9596 | −20.17 | 1.99 | 0.020 | 1 | 9.89 | 58.1 ± 5.6 | −0.7 | 0.583 | 1.000 | 0.293 | 21 |
| 587742616172757184 | 241.3618 | 15.0253 | −21.58 | 2.67 | 0.016 | 4 | 10.63 | 124.6 ± 1.9 | −1.8 | 0.643 | 1.000 | 0.072 | 27 |
| 588017978917257898 | 247.1737 | 21.5491 | −20.01 | 1.94 | 0.038 | 1 | 9.79 | – | – | 1.000 | 1.000 | 0.211 | 37 |
| 587729157890900120 | 190.5697 | 4.0783 | −21.28 | 2.10 | 0.048 | 2 | 10.45 | 98.6 ± 5.4 | −0.0 | 0.650 | 0.923 | 0.000 | 13 |
| 587739609173786650 | 210.1908 | 30.0760 | −22.01 | 2.54 | 0.027 | 2 | 10.81 | 134.3 ± 3.3 | −0.6 | 0.964 | 1.000 | 0.703 | 27 |
| 588295842862334060 | 188.2374 | 50.9595 | −20.52 | 1.78 | 0.041 | 1 | 9.90 | 42.2 ± 13.7 | 0.6 | 0.980 | 1.980 | 0.672 | 38 |
| 587742610805424255 | 255.7306 | 13.3583 | −21.48 | 2.63 | 0.045 | 0 | 10.55 | 141.5 ± 3.3 | −1.3 | 0.504 | 0.992 | 0.726 | 12 |
| 587742550676668631 | 209.9203 | 18.0998 | −19.53 | 2.52 | 0.037 | 1 | 9.87 | 25.3 ± 22.3 | 1.5 | 0.963 | 0.987 | 0.585 | 51 |
| 587739811035218261 | 240.5072 | 16.7577 | −19.80 | 1.73 | 0.032 | 1 | 9.49 | – | – | 0.815 | 1.000 | 0.047 | 26 |
| 587733442659746092 | 240.6017 | 42.7571 | −20.24 | 1.88 | 0.040 | 0 | 9.78 | 49.4 ± 22.5 | −0.2 | 0.926 | 0.965 | 0.211 | 33 |
| … |
Note. This table will be available in its entirety in machine-readable and Virtual Observatory (VO) forms in the online journal and on Vizier. A portion is shown here for guidance regarding its form and content. BPT classes are: 0 – undetermined; 1 – star-forming, 2 – composite, 3 – Seyfert AGN, 4 – LINER.
If bars have no impact at all on the likelihood of a disc galaxy hosting an observable AGN, this is inconsistent with both the models and simulations that demonstrate efficient gas-driven inflow by bar structures (Hopkins & Quataert 2010). If the efficiencies of other morphologies that drive gas inflow are much higher than bars, though, this could also be consistent with our data. A lack of bar-driven fuelling is consistent with the existence of both barred and unbarred AGNs and star-forming galaxies, and the nearly equal numbers found in both pairs.
Given the limits on the data set (which is driven by binning the total number of disc galaxies by mass and colour), we do not completely rule out this model. However, given the small (but measurable) increase in the bar fraction from our data and the current constraints on both bar and AGN time-scales, we propose that bar-driven fuelling must account for at least some fraction of observed AGN activity (Section 4.2).
5 CONCLUSIONS
We have created a sample of 19 756 disc galaxies from SDSS DR7, using data from the GZ2 project for morphological classifications of strong, large-scale bars. We studied the effects of stellar bars on 681 AGNs and compared these effects to a control sample of disc galaxies both without bars and without AGNs. The GZ2 data provide a very large sample of disc morphologies for which the bar likelihood can be empirically quantified, based on crowd-sourced visual classifications.
We find that the fraction of barred AGNs (51 per cent) is significantly greater than the fraction of barred galaxies with central star formation (37 per cent). However, this is driven both by selection effects for detecting optically identified AGNs and by known correlations between black hole mass and stellar mass, as well as stellar mass and optical colour. When examining the fraction of barred AGNs as a function of a fixed mass and colour, we still find a small increase in the number of barred AGN hosts. The null hypothesis of no relationship between the two cannot be ruled out at the 95 per cent confidence level. The |$L_{\rm {[O\,{{\small {iii}}}]}}$|/MBH ratio R (a proxy for the overall accretion rate) shows no dependence on the presence of a bar, once the same mass and colour constraints are applied.
Our results are consistent with a small relationship between the presence of a large-scale galactic bar and the presence of an AGN. We propose that while bar-driven fuelling does indeed contribute to some fraction of the current observed population of growing black holes, other dynamical mechanisms, such as lopsided or eccentric stellar disc, must also contribute to the redistribution of angular momentum and thus the fuelling of the accretion disc at small galactic radii.
Even with the advent of the large-scale SDSS data and the morphological classifications from GZ2, this result is still constrained by the total number of galaxies in our study. Larger samples of disc galaxies with activity and morphological classifications, notably the Dark Energy Survey and the Large Synoptic Survey Telescope, should increase the sample sizes by factors of at least a few and help to confirm these results. Further development on the theoretical side is also critical – with state-of-the-art simulations now able to reproduce both the morphology distributions and the observed black hole mass function, these results can be compared to theory in a cosmological context.
The data in this paper are the result of the efforts of the Galaxy Zoo 2 volunteers, without whom none of this work would be possible. Their efforts are individually acknowledged at authors.galaxyzoo.org. Please contact the author(s) to request access to research materials discussed in this paper. The authors thank Nathan Cloutier, Michael Rutkowski and Claudia Scarlata for useful discussions. They also thank the referee for thoughtful comments which improved the quality of this paper.
The development of Galaxy Zoo 2 was supported by the Leverhulme Trust. MAG, KWW and LFF would like to acknowledge support from the US National Science Foundation under grant DRL-0941610 and from the UMN Grant-in-Aid programme. KS gratefully acknowledges support from Swiss National Science Foundation Grant PP00P2_138979/1. TM acknowledges funding from the STFC ST/J500665/1. RCN was partially supported by STFC grant ST/K00090X/1. BDS acknowledges support from Worcester College, Oxford, and from the Oxford Martin School programme on computational cosmology.
This research made extensive use of the Tool for OPerations on Catalogues And Tables (TOPCAT), which can be found at www.starlink.ac.uk/topcat/ (Taylor 2005).
Funding for the SDSS and SDSS-II has been provided by the Alfred P. Sloan Foundation, the Participating Institutions, the National Science Foundation, the US Department of Energy, the National Aeronautics and Space Administration, the Japanese Monbukagakusho, the Max Planck Society and the Higher Education Funding Council for England. The SDSS website is www.sdss.org.
The SDSS is managed by the Astrophysical Research Consortium for the Participating Institutions. The Participating Institutions are the American Museum of Natural History, Astrophysical Institute Potsdam, University of Basel, University of Cambridge, Case Western Reserve University, University of Chicago, Drexel University, Fermilab, the Institute for Advanced Study, the Japan Participation Group, Johns Hopkins University, the Joint Institute for Nuclear Astrophysics, the Kavli Institute for Particle Astrophysics and Cosmology, the Korean Scientist Group, the Chinese Academy of Sciences (LAMOST), Los Alamos National Laboratory, the Max-Planck-Institute for Astronomy (MPIA), the Max-Planck-Institute for Astrophysics (MPA), New Mexico State University, Ohio State University, University of Pittsburgh, University of Portsmouth, Princeton University, the United States Naval Observatory and the University of Washington.
SEPnet: http://www.sepnet.ac.uk
REFERENCES
SUPPORTING INFORMATION
Additional Supporting Information may be found in the online version of this article:
Table 4. GZ2 catalogue of ‘not edge-on’ disc galaxies (Supplementary Data)
Please note: Oxford University Press is not responsible for the content or functionality of any supporting materials supplied by the authors. Any queries (other than missing material) should be directed to the corresponding author for the article.
