


Abstract
‘Perytons’ are millisecond-duration transients of terrestrial origin, whose frequency-swept emission mimics the dispersion of an astrophysical pulse that has propagated through tenuous cold plasma. In fact, their similarity to FRB 010724 had previously cast a shadow over the interpretation of ‘fast radio bursts’ (FRBs), which otherwise appear to be of extragalactic origin. Until now, the physical origin of the dispersion-mimicking perytons had remained a mystery. We have identified strong out-of-band emission at 2.3–2.5 GHz associated with several peryton events. Subsequent tests revealed that a peryton can be generated at 1.4 GHz when a microwave oven door is opened prematurely and the telescope is at an appropriate relative angle. Radio emission escaping from microwave ovens during the magnetron shut-down phase neatly explains all of the observed properties of the peryton signals. Now that the peryton source has been identified, we furthermore demonstrate that the microwave ovens on site could not have caused FRB 010724. This and other distinct observational differences show that FRBs are excellent candidates for genuine extragalactic transients.
1 INTRODUCTION
‘Peryton’ is the moniker given to a group of radio signals which have been reported at the Parkes and Bleien Radio Observatories at observing frequencies ∼1.4 GHz (Burke-Spolaor et al. 2011; Bagchi, Nieves & McLaughlin 2012; Kocz et al. 2012; Saint-Hilaire, Benz & Monstein 2014). The signals are seen over a wide field-of-view suggesting that they are in the near-field rather than boresight astronomical sources (Kulkarni et al. 2014). They are transient, lasting ∼250 ms across the band, and the 25 perytons reported in the literature occurred only during office hours and predominantly on weekdays. These characteristics suggest that the perytons are a form of human-generated radio frequency interference (RFI). In fact one of the perytons’ defining characteristics – their wide-field detectability – is routinely used to screen out local interference detections in pulsar searches (Keane et al. 2010; Kocz et al. 2012).
Perytons’ most striking feature, which sets them apart from ‘standard’ interference signals, is that they are swept in frequency. The frequency dependent detection of the signal is sufficiently similar to the quadratic form of a bona fide astrophysical signal which has traversed the interstellar medium, that the origin of the first fast radio burst, FRB 010724 (Lorimer et al. 2007), was called into question by Burke-Spolaor et al. (2011). This was mainly based upon the apparent clustering of peryton dispersion measures (DMs) around ∼400 pc cm−3, which is within ∼10 per cent of FRB 010724's DM.
Ongoing searches are actively searching for FRBs and perytons and are capable of making rapidly identifying detections. In this paper, we report on three new peryton discoveries from a single week in 2015 January made with the Parkes radio telescope. In addition to the rapid identification within the Parkes observing band, the RFI environment over a wider frequency range was monitored with dedicated equipment at both the Parkes Observatory and the Australia Telescope Compact Array (located 400 km north of Parkes). For one event, the Giant Metrewave Radio Telescope (GMRT), in India, was being used to observe the same field as Parkes. Below, in Section 2, we describe the observing setup and details of the on-site RFI monitors. In Section 3, we present the results of the analysis of our observations, and our successful recreation of peryton signals. Section 4 discusses, in more depth, the identified sources of the signals and we compare the perytons to the known FRB population in Section 5. We present our conclusions in Section 6.
2 OBSERVATIONS
As part of the SUrvey for Pulsars and Extragalactic Radio Bursts (SUPERB;1 Keane et al., in preparation), at Parkes, real-time pulsar and transient searches are performed. The live transient searching system developed for SUPERB, which uses the heimdall2 single pulse search software package, is now routinely used by several projects. The survey data are taken using the Berkeley Parkes Swinburne Recorder (BPSR) which is used to produce Stokes I data from 1024-channel filterbanks covering a total bandwidth of 400 MHz centred at 1382 MHz with a time resolution of 64 s and 2-bit digitisation. For each pointing 13 such data streams are recorded, one for each beam of the multibeam receiver (Staveley-Smith et al. 1996).
The survey has been running since 2014 April to search for pulsars and FRBs. In 2014 December, an RFI monitoring system was installed on the Parkes site identical to ones which had been in operation at the Australia Telescope Compact Array (ATCA) since 2014 November. The RFI monitor itself is a Rhode & Schwarz EB500 Monitoring Receiver capable of detecting signals across a wide range of frequencies from 402 MHz to 3 GHz. The frequency and time resolution of the monitoring system are limited to 2 MHz and 10 s, respectively. The antenna is mounted on a rotator, which sweeps out 360° in azimuth every 12 min, then returns to an azimuth of 0 for another 8 min before repeating the cycle. A spectrum is produced every 10 s, which is obtained by stepping in 20 MHz steps across the full band. So each 10 s spectrum has only 0.1 s of data at any given frequency. The installation of the monitor gives an unprecedented view of the RFI ‘environment’ at the telescope at any given time and this setup is ideal for identifying very strong signals of RFI which may corrupt observations with the main dish at Parkes.
In 2015 January–March, 319.2 h (13.3 d) of 13-beam BPSR data were recorded for the SUPERB survey alone to search for pulsars and FRBs. Total time in the BPSR observing mode in these months was 736.6 h over a range of observing projects aimed at detecting and studying fast transients. Ultimately, 350.7 h of these observations were searched for perytons in the months of 2015 January–March in this work. Three events were discovered, all occurring in the week starting 2015 January 19, on the 19th (Monday), 22nd (Thursday) and 23rd (Friday) in a rotating radio transient search, the PULSE@Parkes outreach project (Hobbs et al. 2009) and SUPERB, respectively. For the event on January 23, simultaneous coverage with the GMRT was also available, which was shadowing Parkes as part of the SUPERB project's effort to localize FRBs.
The peryton search for SUPERB and other BPSR data is performed after the Parkes data have been transferred to the gSTAR supercomputer facility at Swinburne University of Technology. The peryton search is performed by summing the frequency–time data of all 13-beams from BPSR and searching these summed data for single pulses using heimdall for pulses with a signal-to-noise ratio (S/N) ≥ 10 and DM ≥ 10 pc cm−3. This method ensures that dispersed pulses occurring in a majority of beams are efficiently detected even if they may be too weak in individual beams to be detected in single-beam searches. For the perytons identified in 2015 January, once the date and UTC time were established the Parkes and ATCA RFI monitor data were checked around the times of the perytons for the presence of signals that might be correlated with the appearance of a peryton at 1.4 GHz. The same search technique was applied to search for perytons in the High Time Resolution Universe survey (HTRU) intermediate- and high-latitude surveys of Keith et al. (2010). The HTRU intermediate-latitude survey was conducted between 2008 and 2010 and the high-latitude component was conducted between 2009 and 2014. The HTRU survey concluded in 2014 February and as such no RFI monitor data are available for events detected in these data nor for any peryton detected before those reported here.
3 RESULTS
3.1 Three perytons
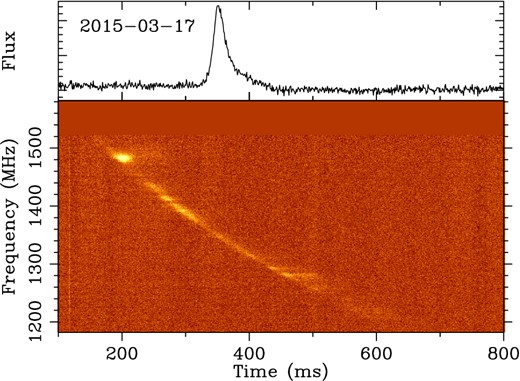
The properties of the three perytons discovered in 2015 January are noted in Table 1 and Fig. 1 shows the time–frequency structure. These events are typical perytons in that they are bright and detectable in all beams of the multibeam receiver. They are also apparently dispersed or ‘chirped’ in frequency, but not strictly obeying the quadratic cold plasma dispersion law; signals from pulsars and FRBs are observed to obey this law precisely (Hassall et al. 2012; Thornton et al. 2013). They have a typical peryton spectrum, being broad-band, but brighter at higher frequencies. Conversely, an off-axis detection of an astronomical source (i.e. one effectively at infinity) would be suppressed at the highest frequencies, but the near-field beam pattern is radically different (see e.g. fig. 10 in Kulkarni et al. 2014). The existence of a standard template for peryton spectra and similar DMs also suggests that the source, or sources, are at roughly constant distances and possibly consistently reproducible.
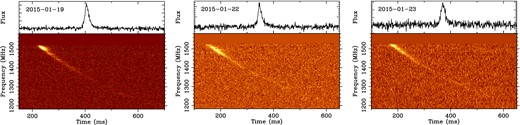
The time–frequency structure of the three January perytons (bottom) and the pulse shape after dedispersion to the optimal DM in Table 1 and summed in frequency across the band (top). In the case of events on 2015-01-19 and 2015-01-23, the summed 13-beam data are shown. For 2015-01-22, only beam 01 is plotted as the outer beam data was not recorded to disc.
Properties of the perytons from 2015 January.
| Date | Time | DM | DM error | S/N | Width | Telescope | Telescope |
|---|---|---|---|---|---|---|---|
| (dd-mm-yy) | (UTC) | (pc cm−3) | (beam 01) | (ms) | azimuth (deg) | elevation (deg) | |
| 2015-01-19 | 00:39:05 | 386.6 | 1.7 | 24.8 | 18.5 | 10.7 | 75.3 |
| 2015-01-22 | 00:28:33 | 413.8 | 1.1 | 42.5 | 18.5 | 73.9 | 36.2 |
| 2015-01-23 | 03:48:31 | 407.4 | 1.4 | 10.6 | 18.5 | 323.2 | 40.2 |
These three perytons are the focus of our analysis as they were the first with simultaneous coverage with additional instruments: the RFI monitors operating at both the Parkes and ATCA sites. For all three events, the Parkes RFI monitor detected emission in the frequency range 2.3–2.5 GHz consistent (to less than one time sample) with the time of the 1.4-GHz peryton event. This strongly suggests that the 1.4-GHz millisecond-duration burst is somehow associated with the episodes of 2.4 GHz emission, which last for some tens of seconds. The broad RFI spectra from the monitor at the times around the perytons are shown in Fig. 2 with the bright emission shown as well as the time of the peryton. Simultaneous emission in the same frequency range was seen in the ATCA data at the time of the first peryton, but no such emission was seen for any other peryton detection, making it likely that this one event was a coincidence, (see Fig. 3). For the third peryton, simultaneous coverage with GMRT at 325 MHz observing in 2-s snapshots also produced no detection. The detection on only the Parkes site confines the source(s) of the peryton signals to a local origin.
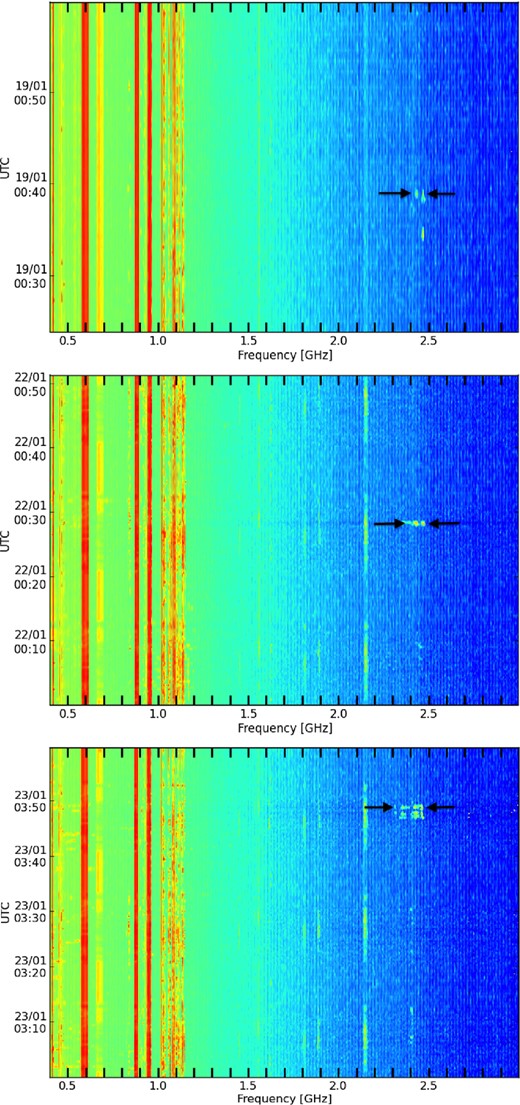
RFI monitor spectra from Parkes for the perytons in the week starting 2015 January 19. The time of peryton has been indicated around the 2.3–2.5 GHz range by black arrows.
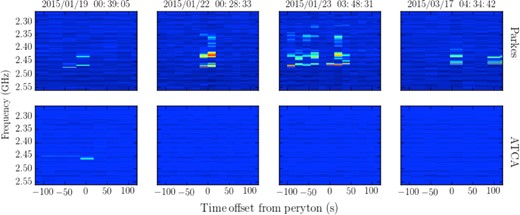
RFI monitor data from Parkes and the ATCA between 2.30 and 2.50 GHz around the times of the three January perytons and one peryton from the Woolshed microwave oven tests (2015-03-17).
The 2.3–2.5 GHz range of the spectrum is allocated to ‘fixed’, ‘mobile’ and ‘broadcasting’ uses by the Australian Communications and Media Authority, and includes use by industrial, scientific and medical applications, which encompasses microwave ovens, wireless internet and other electrical items. This suggests that the perytons may be associated with equipment operating at 2.3–2.5 GHz, but that some intermittent event or malfunctioning, for example, from the equipment's power supply, is resulting in sporadic emission at 1.4 GHz.
3.2 Prevalence of 2.3–2.5 GHz signals at Parkes
As can be seen in Fig. 2, there is at least one case where a single peryton is detected but there are multiple or ongoing detections at 2.3–2.5 GHz around the time of the peryton. This already indicates that while peryton detections at 1.4 GHz coincide with episodes of emission at higher frequency, the higher frequency emission can occur without generating a peryton. More detailed inspection of the archival RFI monitor data at Parkes gives an indication of the prevalence of these episodes at higher frequencies. In the months investigated several hundred spikes of emission are detected in the frequency range 2.3–2.5 GHz. These events cluster in time of day and are much more common during daytime (between the hours of 9am and 5pm local time). A time-of-day histogram of these spikes over the period of 2015 January 18 to March 12 is plotted in Fig. 4. This is entirely consistent with the use of microwave ovens and other electrical equipment. Tests at Parkes confirmed that microwave ovens produced detectable levels of ∼2.4 GHz emission in the RFI monitoring equipment independent of the azimuth of the rotator. Standard practice at ATNF observatories is not to allow the use of microwave ovens on site when observing in the 2.4 GHz band is taking place.
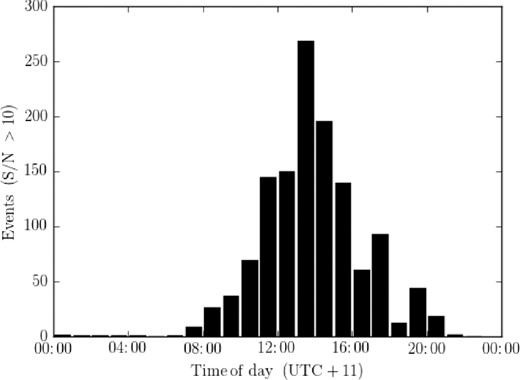
Number of narrow-emission spikes detected with the RFI monitor with S/N > 10 in a 60 MHz window around 2.466 GHz between 18 January and 12 March, 2015.
3.3 Archival perytons
Using the search technique described in Section 2, 15 perytons were found in the HTRU intermediate-latitude survey and an additional 6 perytons were found in a search of 75 per cent of the high-latitude survey. While the RFI monitor had not yet been set up on site and the RFI environment is impossible to recover, we can use these perytons to study the ensemble properties. Combining the perytons from 2015 January, HTRU, Burke-Spolaor et al. (2011), Kocz et al. (2012) and Bagchi et al. (2012) the total number of perytons is 46. The properties of these sources, especially how they relate to the population properties of FRBs is discussed in more detail in Section 5.
3.4 Generating perytons
With the recognition that peryton signals are likely to be associated with equipment emitting at 2.3–2.5 GHz, an effort was made to try to identify such equipment on site, and attempt to ‘create’ a peryton. As microwave ovens are known to emit in this frequency range and could potentially produce short-lived emission, the site microwave ovens were the focus of our initial tests for reproducing peryton signals.
There are three microwave ovens on site in close proximity to the telescope that experience frequent use located in the tower below the telescope, the visitors centre and the staff kitchen located in the building traditionally referred to as the Woolshed. There are two additional microwave ovens at the observer's quarters approximately 1 km from the main site. The first tests occurred on 2015 February 27 during scheduled maintenance while the telescope was stowed at zenith. The BPSR system was turned on for all 13 beams and the three microwave ovens on-site were run on high and low power for durations of 10–60 s. In each test the load in the microwave oven was a ceramic mug full of water. In the first set of tests, a single peryton was detected during tests of the tower microwave oven with a DM of 345 pc cm−3. The detection of radiation from the tower microwave oven would be very surprising as the tower is shielded on the windows and in the walls and the dish surface blocks the line of sight to the receiver in the cabin at the prime focus. However, it was later determined that the Woolshed microwave oven was also in use at the time, unrelated to these tests, and might potentially have been the source of the peryton.
The second set of tests were conducted on 2015 March 12, this time pointing the telescope at azimuth and elevation combinations where we often see perytons. From the 21 perytons discovered in the HTRU survey and the known pointing locations a broad estimate of the peryton rate as a function of azimuth and elevation can be calculated. For the HTRU perytons, the rate is highest at an azimuth and elevation of (∼130°, 65°) and when pointing near zenith. An initial test was conducted with the microwave ovens while pointing the telescope at these locations and no perytons were seen.
The decisive test occurred on 2015 March 17 when the tests were repeated with the same microwave oven setup but instead of waiting for the microwave oven cycle to finish the microwave oven was stopped by opening the door. This test produced three bright perytons from the staff kitchen microwave oven all at the exact times of opening the microwave oven door with DMs of 410.3, 410.3 and 399.6 pc cm−3 (the first of these generated perytons is used in Figs 3 and 5). With knowledge that this mode of operation of a microwave oven could produce perytons, we examined the range of azimuths and elevations at which there was direct line of sight from the microwave oven to the multibeam receiver (i.e. the underside of the focus cabin). As is apparent in Fig. 6, almost all the perytons with DMs > 300 occurred when there was visibility of the focus cabin from the Woolshed microwave oven. This left the smaller sample of perytons with lower DMs, which were, however, consistent with an origin at the visitors centre or the Quarters. (This sample also included all five events which had been detected on the weekend, when there were generally no staff on-site and the Woolshed not in use.) Similar tests were performed with a previously installed microwave oven in the visitors centre and six perytons were seen at the times corresponding to opening the door; however, these perytons had DMs of 206.7, 204.9, 217.0, 259.2, 189.8 and 195.2 pc cm−3. This process does not generate a peryton every time, however; in fact perytons appear to be generated with an ∼50 per cent success rate.
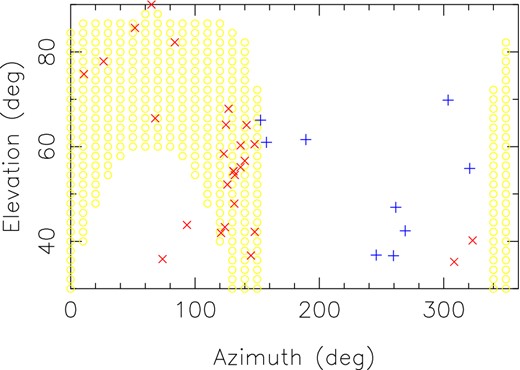
Azimuth and elevation combinations for which there is a direct line of sight from the microwave oven in the Woolshed to the multibeam receiver are broadly shown with circles. The pointing directions for the detected perytons with DMs ∼400 pc cm−3 (crosses) and ∼200 pc cm−3 (pluses) are also shown.
A bimodal distribution of peryton DMs can be accounted from at least two microwave ovens on -site being used and stopped in this manner. The detectability of perytons with a given DM from a microwave oven stopped this way depends on the direction in which the telescope is pointing. The receiver is sensitive to perytons when the microwave oven producing the bursts has a direct line of sight to the focus cabin and receiver of the telescope, i.e. a line of sight not blocked by the surface of the telescope, yet still seeing the underside of the focus cabin. As shown in Fig. 6, for the Woolshed (located 100m from the Dish at an azimuth of 65°), the broadest range of elevations providing a direct line of sight are offset by ∼80° in azimuth.
3.5 The peryton cluster of 1998 June 23
Of the 46 perytons detected at Parkes since 1998 some 16, more than a third of the total, occurred within a period of just seven minutes, on 1998 June 23. All have a DM consistent with an origin in the Woolshed. Kocz et al. (2012) noted that the interval between consecutive events is clustered around 22 s. In this more complete sample, we find that indeed eight of the 15 intervals between consecutive events fall within the range 22.0 ± 0.3 s, which is exceedingly unlikely to have been produced by manually opening the oven. Rather, we believe that the operator had selected a power level of less than 100 per cent, causing the magnetron power to cycle on and off on a 22-s cycle, the period specified in the manufacturer's service manual and confirmed by measurement. It appears likely that over this 7-min period the oven produced a peryton on all or most completions of this 22-s cycle but that the operator stopped the oven manually several times by opening the door, each time restarting the 22-s cycle.
Kocz et al. (2012) also noted a clustering of event times modulo 2 s (their fig. 2). This can be explained if the 22-s cycle is derived from a stable quartz crystal oscillator, which is almost certainly the case as the oven has a digital clock display.
However, we have been unable to repeat the production of perytons in this manner. The principal difficulty is to account for the peryton energy escaping the oven's shielded enclosure without opening the door. A transitory fault condition seems an unlikely possibility, given the oven has continued to operate reliably for a further 17 years. We conjecture that on this occasion the operator inadvertently compromised the shielding by placing conducting material in the oven, perhaps aluminium cooking foil that became caught between the door and the body of the oven, creating a unintended antenna, but we have yet to devise an acceptable test of this scenario.
4 DISCUSSION
The two ovens responsible for most or all of the observed perytons are from the same manufacturer (Matsushita/National) and are both in excess of 27 years of age though still working reliably. Our tests point clearly to the magnetron itself as the source of the perytons since these are not detected unless the oven door is opened. Further, our analysis of the peryton cluster of 1988 June 23 implies the perytons are a transient phenomenon that occurs only when the magnetron is switched off. That we have observed perytons from at least two ovens over 17 years suggests that they are not the product of an unusual failure or fault but are inherent to, and long-lived in, at least some common types of oven. The magnetron used in the Woolshed oven (type 2M210-M1) was used by Matsushita in new microwave ovens for at least a decade and remains readily available.
However, the physical process that generates the swept or ‘chirped’ emission that defines these perytons is obscure. The duration of the perytons is also a puzzle. The Woolshed oven has a simple HV supply comprising a 2kVAC mains step-up transformer and Villard voltage doubler/rectifier, with no additional filtering. The magnetron supply voltage should decay rapidly after switch-off over a few mains cycles (of 20 ms) but the perytons have typical durations of 250 ms or more, decaying in power by only a factor of 3 or so over this time (e.g. fig. 3. of Bagchi et al. 2012).
By nature, magnetrons are highly non-linear devices and the mode competition occurring at the start-up and shut-down of the microwave oven can cause excitation within the magnetron. Magnetron cavities have several spacings through which electrons flow. Over time the edges of these cavities may become worn down and arcing may occur across these cavities during start-up and shut-down. This arcing may produce a spark observable at other frequencies than those intended in the microwave oven specifications. The microwave oven itself should act as a Faraday cage and block these signals from exiting the microwave oven cavity. However, opening the door of the microwave oven during shut-down would allow for these signals to propagate externally. Escaping sparks at 1.4 GHz could be the perytons we see with the receiver (Anderson, Pritchard & Rowson 1979; Yamanaka & Shinozuka 1995).
Further tests on the site microwave ovens over a wider range of frequencies will be performed in near future and reported in an upcoming publication. More extensive testing is expected to provide greater insight into the emission mechanism of the sweep seen at Parkes observing frequencies as well as determining the conditions such as microwave oven power setting, contents and door configuration that are responsible for the observed perytons.
5 RELEVANCE TO FRBs
5.1 Differences in observed properties
Having originally cast doubt on the first FRB discovered, FRB 010724, the origin of perytons has since cast a shadow on the interpretation of FRBs as genuine astrophysical pulses. We therefore wish to explicitly address whether perytons and FRBs could have a common origin. Even with the source of perytons identified as on-site RFI the question may remain as to whether the progenitors of FRBs and perytons are related or even the same event at different distances. Fundamental aspects of the FRB and peryton populations differ. The distribution of perytons in time-of-day occurrence and DM is highly clustered and very strongly indicative of a human-generated signal. The DM and time-of-day detections of perytons and FRBs are compared in Fig. 7. In the case of the perytons, the clustering around the lunchtime hour becomes even more pronounced once this Australian Eastern Daylight Time (AEDT) correction is applied. The FRB distribution in time of day is consistent with a random distribution, which would be observed as essentially flat perhaps with a slight dip in number during office hours where occasional telescope maintenance is performed.
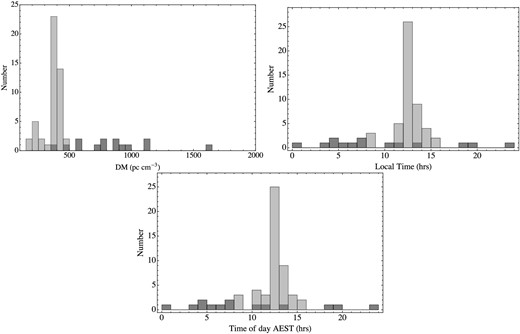
The overlaid FRB (dark) and peryton (light) distributions as a function of the local time with Australian Eastern Daylight Savings Time accounted for (top left), time in AEST (top right) and as a function of DM over the entire range searched (bottom). Clearly, the FRB distribution is uniform throughout the day, whereas the peryton signals peak strongly during office hours (particularly around lunch time). A random distribution would look approximately flat, with a slight dip during office hours where occasional maintenance is carried out. The bimodal peryton distribution with peaks at ∼200 and ∼400 cm−3 pc is evident.
Similarly, the bimodal DM distribution of the peryton population can be clearly seen in the larger peryton sample. No clear DM clustering can yet be identified for the FRBs although such a distribution may become clear with a population of thousands of sources if FRBs are cosmological (McQuinn 2014; Macquart et al. 2015). Finally, a microwave oven origin is generally not well suited to explaining other observed properties of FRBs, such as the clear asymmetric scattering tails observed in some FRBs, the consistency with Komolgorov scattering (Thornton et al. 2013), and the apparent deficit of detections at low Galactic latitudes. These are major indicators of a genuine astrophysical population (Burke-Spolaor & Bannister 2014; Petroff et al. 2014).
5.2 What is FRB 010724?
With an understanding of the conditions under which perytons are generated, we can reconsider the ‘Lorimer Burst’, FRB 010724 (Lorimer et al. 2007). As noted by Burke-Spolaor et al. (2011) and as is evident in Fig. 7, the DM of 375 cm−3 pc for this burst is entirely consistent with the DM ∼ 400 cm−3 pc events we now refer to as Woolshed perytons. However, there are critical differences. The bright detection in three beams is indicative of a boresight detection. Furthermore, the event occurred with the telescope pointing almost due south, and the line of sight from the Woolshed microwave oven to the focus cabin is completely blocked by the telescope surface. While there is line of sight visibility from the visitors centre at this time, the DM is not consistent with the visitors centre microwave oven. Additionally, the event occurred at 19:50 ut, i.e. 5:50 am AEST (Australian Eastern Standard Time), when the visitors centre is closed and unstaffed. We conclude the evidence in favour of FRB 010724 being a genuine FRB is strong.
5.3 Deciphering new transient events
To discern between new millisecond transient detections, this work has demonstrated two critical discriminants that divide FRBs and perytons. A common, known RFI emission from microwave ovens – as detected concurrently to all perytons presented here – is at 2.3–2.5 GHz. Thus, an FRB detected with a non-detection of any 2.3–2.5 GHz, which we propose as a key characteristic of the Parkes perytons, would be another nail in the coffin for any association. It should be noted that while there are 2.3–2.5 GHz events with no L-band detection, there are not the converse, so there is some statistical probability that an FRB occurs by chance around the same time as an FRB, particularly if it is detected during daytime (Fig. 4).
Second, as with FRB 010724, given that the telescope cannot point directly at a microwave oven, fabricating a detection that does not appear in all beams, our results show that perytons can be discerned from FRBs by using a multibeam system to identify sky-localized events. For an event to appear point-like within the multibeam receiver's beam pattern, as FRBs do, the target must be in the Fraunhofer regime.
6 CONCLUSIONS
Three peryton detections were made at the Parkes radio telescope on three separate days during the week of 2015 January 19. The installation of a new broad-band RFI monitor allowed for the first correlation between the peryton events and strong out of band emission at 2.3–2.5 GHz of local origin. Additional tests at Parkes revealed that peryton events can be generated under the right set of conditions with on-site microwave ovens and the behaviour of multiple microwave ovens on site can account for the bimodal DM distribution of the known perytons. Peryton searches in archival survey data also allowed for the detection of a further 21 bursts from the HTRU survey alone. A comparison of the population properties of FRBs and perytons revealed several critical conclusions as follows.
Perytons are strongly clustered in DM and time of day, strongly indicative of man-made origins, whereas FRBs are not.
FRB detections to date faithfully follow cold plasma dispersion; some have shown clear scattering tails whose frequency-dependent width follows a Kolmogorov spectrum; FRBs appear to avoid the Galactic plane. Perytons do not exhibit these properties.
The peryton-causing ovens on Parkes site could not have produced FRB 010724, indicating that this burst is in fact an FRB rather than a peryton.
A direct test of ‘peryton versus FRB’ can be made via the detection or non-detection, respectively, of concurrent 2.3–2.5 GHz emission.
We have thus demonstrated through strong evidence that perytons and FRBs arise from disparate origins. There is furthermore strong evidence that FRBs are in fact of astronomical origin.
We would like to thank Sandy Weinreb for his helpful review of this manuscript and the editor for additional comments. We thank the team from the PULSE@Parkes project for use of the beam 01 data from their observing session. EP would like to thank I. Morrison for useful discussion and support. Following our realization that microwave ovens were the likely source of the perytons we had useful discussions about the functioning of the devices with J. Benford on March 13. This work used the gSTAR national facility which is funded by Swinburne and the Australian Government's Education Investment Fund. The Parkes Radio Telescope is part of the Australia Telescope National Facility, which is funded by the Commonwealth of Australia for operation as a National Facility managed by CSIRO. GMRT is run by the National Centre for Radio Astrophysics of the Tata Institute of Fundamental Research. EP, EDB and EFK acknowledge the support of the Australian Research Council Centre of Excellence for All-sky Astrophysics (CAASTRO), through project number CE110001020. NDRB is supported by a Curtin Research Fellowship.
REFERENCES
