


Abstract
Over the duration of the Kepler mission, KIC 8462852 was observed to undergo irregularly shaped, aperiodic dips in flux of up to ∼20 per cent. The dipping activity can last for between 5 and 80 d. We characterize the object with high-resolution spectroscopy, spectral energy distribution fitting, radial velocity measurements, high-resolution imaging, and Fourier analyses of the Kepler light curve. We determine that KIC 8462852 is a typical main-sequence F3 V star that exhibits no significant IR excess, and has no very close interacting companions. In this paper, we describe various scenarios to explain the dipping events observed in the Kepler light curve. We confirm that the dipping signals in the data are not caused by any instrumental or data processing artefact, and thus are astrophysical in origin. We construct scenario-independent constraints on the size and location of a body in the system that are needed to reproduce the observations. We deliberate over several assorted stellar and circumstellar astrophysical scenarios, most of which have problems explaining the data in hand. By considering the observational constraints on dust clumps in orbit around a normal main-sequence star, we conclude that the scenario most consistent with the data in hand is the passage of a family of exocomet or planetesimal fragments, all of which are associated with a single previous break-up event, possibly caused by tidal disruption or thermal processing. The minimum total mass associated with these fragments likely exceeds 10−6 M⊕, corresponding to an original rocky body of >100 km in diameter. We discuss the necessity of future observations to help interpret the system.
INTRODUCTION
For over four years, NASA's Kepler mission measured the brightness of objects within an ∼100 deg2 patch of sky in the direction of the constellations Cygnus and Lyrae. The program's targets were primarily selected to address the Kepler mission goals of discovering Earth-like planets orbiting other stars. Kepler targeted over >150 000 stars, primarily with a 30-min observing cadence, leading to over 2.5-billion data points per year (>10 billion data points over the nominal mission lifetime).
The Kepler mission's data processing and identification of transiting planet candidates were done in an automated manner through sophisticated computer algorithms (e.g. Jenkins et al. 2010). Complementary to this analysis, the Zooniverse citizen science network provided the means to crowd source the review of light curves with the Planet Hunters project1 (e.g. Fischer et al. 2012). In this framework, Planet Hunter volunteers view 30 d segments of light curves in the ‘Classify’ web interface. A volunteer's main task was to identify signals of transiting planets by harnessing the human eye's unique ability for pattern recognition. This process has shown to have a detection efficiency to identify planetary transits >85 per cent using the first Quarter of Kepler data (Schwamb et al. 2012). The Planet Hunters project has now discovered almost a hundred exoplanet candidates, including several confirmed systems (Fischer et al. 2012; Lintott et al. 2013; Schwamb et al. 2013; Wang et al. 2013; Schmitt et al. 2014).
Because Planet Hunter volunteers look at every light curve by eye, serendipitous discoveries are inevitable, especially in rich data sets such as that which Kepler has provided. As such, a key aspect of the Planet Hunters project is the ‘Talk’ interface. ‘Talk’ is a community discussion board/site where volunteers can discuss light curves and present further analysis on objects viewed in the main ‘Classify’ interface. In a handful of cases, such as the discovery of the unusual cataclysmic variable, KIC 9406652 (Gies et al. 2013), the default aperture mask used to generate the Kepler light curve was not perfectly centred on the object of interest. Because of this, interesting events in the Kepler light curve would appear to come and go as a result of the shifting orientation of the aperture mask when the spacecraft underwent a quarterly rotation. Events such as these are tagged and discussed on ‘Talk’, making it possible to return to the raw data target pixel files (TPF) to extract improved light curves with modified aperture masks, for example.
This paper presents the discovery of a highly unusual dipping source, KIC 8462852, from the Planet Hunters project. In just the first quarter of Kepler data, Planet Hunter volunteers identified KIC 8462852's light curve as a ‘bizarre’, ‘interesting’, ‘giant transit’ (Q1 event depth was 0.5 per cent with a duration of 4 d). As new Kepler data were released in subsequent quarters, discussions continued on ‘Talk’ about KIC 8462852's light-curve peculiarities, particularly ramping up pace in the final observations of the Kepler mission.
In this work we examine the full 4 years of Kepler observations of KIC 8462852 as well as supplemental data provided by additional ground- and space-based observations. In Section 2, we characterize KIC 8462852 using Kepler photometry, spectroscopic analysis, AO imaging, and spectral energy distribution (SED) analysis. We discover a wide M-dwarf companion to the system and argue that with the data sets we have in-hand, we can exclude the presence of an additional massive gravitationally bound companion nearby. In Section 3, we visit possible explanations for the peculiar observations of KIC 8462852, including instrumental artefacts, intrinsic/extrinsic variability, and a variety of scenarios invoking light-blocking events. We formulate a variety of scenario-independent constraints in Section 4, and elaborate on specific occultation scenarios in Section 5. In Section 6, we conclude by discussing future observations needed to constrain the nature of the object.
DATA
KIC 8462852, also known as TYC 3162-665-1 and 2MASS J20061546+4427248, is a V ∼ 12 mag star in the Kepler field of view. Its light curve was identified serendipitously by the Planet Hunters project, and was deemed an interesting object that was worthy of further investigation. In the following sections, we characterize the system with data from Kepler as well as additional data from various targeted and archived programs.
Kepler photometry
The Kepler mission was launched on 2009 March 7, and it started science observations on 2009 May 13. The nominal mission was finished almost 4 years later, on 2013 May 12, after the failure of the second reaction wheel. KIC 8462852 was observed throughout the main Kepler mission (divided into Quarters 0–17) under long-cadence (30-min) observations yielding an ultra-precise, nearly uninterrupted, light curve during this time. Kepler data files provide both the ‘uncorrected’ Simple Aperture Photometry (SAP) and the ‘corrected’ Pre-search Data Conditioning (PDCSAP) fluxes (for details, see Christiansen et al. 2012). In this work, our analysis uses the normalized, PDCSAP data. Note that we have thoroughly validated the data to ensure that any flux variations represent physical events in or near the star (and they do); these processes are described in detail within Section 3.1, and we do not repeat them here.
In Fig. 1, we present a montage of plots capturing much of the interesting flux variations observed in the Kepler timeseries data. The top two panels, ‘(a)’ and ‘(b)’, show the flux time series for the entire Kepler mission, but with different vertical flux scales. These show that the flux is relatively constant for most of that time, but is punctuated by a number of substantial dips in flux, including a 15 per cent drop near day 800, and a whole sequence of dips (with one reaching a depth of 22 per cent) after day 1500. Panel ‘(b)’ marks the occurrence of 10 discrete dips (see Table 1). For convenience, we hereafter refer to the two main dip structures between day 788 and 795 and between day 1510 and 1570, as events ‘D800’ and ‘D1500’, respectively. Panel ‘(c)’ is a zoom in on the dip D800. The remaining three panels are progressively zoomed in around the exotic complex of dips at D1500.
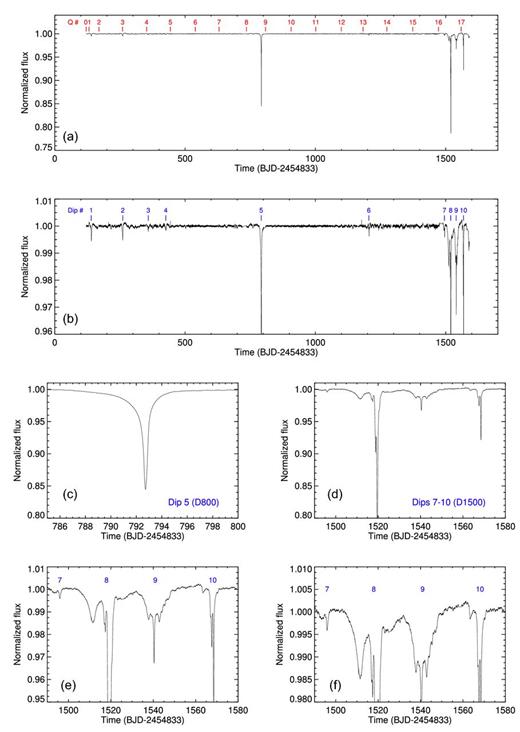
Montage of flux time series for KIC 8462852 showing different portions of the 4-yr Kepler observations with different vertical scalings. The top two panels show the entire Kepler observation time interval. The starting time of each Kepler quarter Q is marked and labelled in red in the top panel ‘(a)’. Dip numbers corresponding to the 10 discrete dips listed in Table 1 are marked and labelled in blue in panel ‘(b)’. Panel ‘(c)’ is a blowup of dip 5 near day 793 (D800). The remaining three panels, ‘(d)’, ‘(e)’, and ‘(f)’, explore the dips (labelled in blue) which occur during the 90-d interval from day 1490 to day 1580 (D1500). Refer to Section 2.1 for details.
The D800 dip feature is clean, sharp, and asymmetric in shape. It possesses a gradual dimming lasting almost a week, and transitions back to its nominal brightness in just a couple of days. The D1500 complex consists of many dips, with variable shape and duration, often occurring concurrently as if several independent occultation events were superimposed upon each other. The D1500 dips persist for ∼100 d until the Kepler mission's end, and only for a small part of this time does it appear ‘quiescent’. There are also other smaller ∼0.5 per cent dips, including three earlier in the mission around day 140, day 260, and day 359, and another after the D800 event, around day 1205 [dips 1, 2, 3 and 6, respectively; Fig. 1 ‘(b)’, Table 1]. Several more 0.5–1 per cent dips appear in and around the two deep D1500 features, including an ∼3 per cent dip around day 1540. Two small dips occurring at day 1205 and day 1540 have shapes with a similar distinctive, ‘triple-dip’, symmetric profile; however, they differ in duration by a factor of 3 and in degree of dimming by a factor of 5. All of the fluctuations in intensity visible on these plots are real, i.e. not due to statistical or instrumental variations (Section 3.1).
Principal dip times of KIC 8462852 versus 48.4-d period.
| Dip no. | Name | Depth | BJD | Cycles | |Residual| |
|---|---|---|---|---|---|
| (−245 4833) | (from dip 5) | (from integer) | |||
| 1 | (D140) | 0.5 per cent | 140.49 | −13 | 0.52 |
| 2 | (D260) | 0.5 per cent | 261.00 | −11 | 0.01 |
| 3 | (D360) | 0.2 per cent | 359.11 | −9 | 0.04 |
| 4 | (D425) | 0.2 per cent | 426.62 | −7 | 0.44 |
| 5 | (D800) | 16 per cent | 792.74 | 0 | 0.00 |
| 6 | (D1200) | 0.4 per cent | 1205.96 | 8 | 0.54 |
| 7 | (D1500) | 0.3 per cent | 1495.97 | 14 | 0.53 |
| 8 | (D1520) | 21 per cent | 1519.60 | 15 | 0.02 |
| 9 | (D1540) | 3 per cent | 1540.40 | 15 | 0.45 |
| 10 | (D1570) | 8 per cent | 1568.49 | 16 | 0.03 |
There are also modulations in the raw flux data at the ∼500 ppm level which are visible by eye. To further explore whether any of these modulations are periodic, or have a periodic component, we generated a Fourier transform (FT) of the data with the dips excised from the data train. Fig. 2 shows the FT of the Kepler photometry and one can see a clear periodicity of 0.88 d (1.14 cycles/day) and its next two higher harmonics.
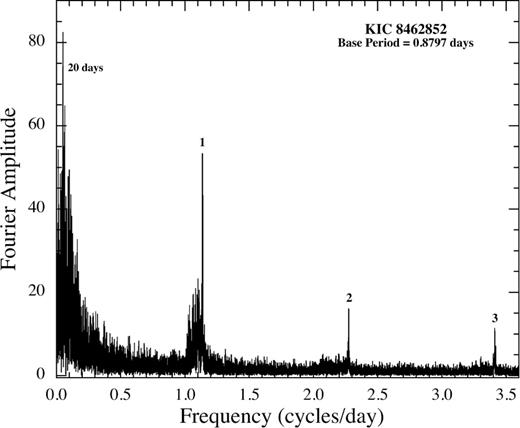
FT for KIC 8462852. The peaks are labelled with the harmonic numbers starting with 1 for the base frequency. Refer to Section 2.1 for details.
This 0.88-d signal is a broad feature that resembles typical FTs of Kepler targets for early-type stars (Balona 2013, see their fig. 6). If this is a rotation period, then the projected rotational velocity (from Section 2.2) of 84 ± 4 km s−1 represents a minimum stellar radius of ∼1.46 R⊙, consistent with the radius of an F-type star (also see Section 2.2). Also seen in Fig. 2 just to the left of the base frequency is a broad collection of smaller peaks. This suggests that something more complicated than a single rotating surface inhomogeneity is producing the observed signal.
We investigate the stability of the frequencies observed in the FT by performing a Short-Term Fourier Transform (STFT), again clipping the data in the dipping regions. In the STFT method, the data are broken up into ‘short’ segments of 43 d. This segment duration has been selected to optimize both time and frequency resolution. The FT is computed and displayed vertically on the plot, and this is repeated as a function of time, with overlap in time segments to gain back some temporal resolution.
The STFT is presented in Fig. 3. This shows that the 0.88 d signal is present in most of the Kepler time series, with the strongest presence occurring around day 1200. Interestingly, however, around day 400 and day 1400, we see major contributions at different frequencies, corresponding to ∼0.96 d and ∼0.90 d, respectively. We conclude that these are the source of the broad collection of peaks to the left of the base frequency noted above. These low-frequency side-bands could possibly be due to regions contrasted in flux (e.g. starspots, chemically peculiar regions) appearing at higher latitudes coupled with differential rotation. This is consistent with the differential rotation (or inferred fractional frequency difference of ∼10 per cent) for F-type stars (Reinhold, Reiners & Basri 2013). We would like to note, however, that we cannot completely discount the possibility that these periods are due to pulsations. The position of KIC 8462852 is within the Gamma Doradus (γ Dor) region of the instability strip, where pulsations are observed at <5 cycles d−1 (e.g. Uytterhoeven et al. 2011). To investigate this, we then compared the STFTs of known γ Dor pulsators to the STFT of KIC 8462852. We found that the dominant frequencies in STFTs for known γ Dor stars do not evolve with time, contrary to the STFT for KIC 8462852. This supports the interpretation that the ∼0.88 d signal is due to the star's rotational period.
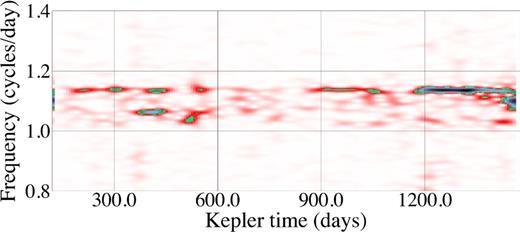
The STFT for the Kepler flux time series. The main base period of ∼0.88 d is present throughout the span of observations. We identify (at least) two additional frequencies appearing around day 400 and 1400, corresponding to periods of 0.96 to 0.90 d, which we attribute to differential rotation. Refer to Section 2.1 for details.
We also report on the presence of variability on the time-scale of 10–20 d (Fig. 2), which, when present, is visible by eye in the light curve.2 We illustrate this in Fig. 4, showing zoomed in regions of the Kepler light curve. The star's 0.88 d period is also evident in each panel as the higher-frequency flux variations. The panel second from the bottom ‘(c)’ shows no low-frequency (10–20 d) variations, but the rest do. While the largest of the dipping structures within the D1500 events could also be described as having a periodic structure close to 20 d, the magnitude of the variability and the temporal behaviour are much different than these low-amplitude variations described here. Thus, we cannot suggest any connection between the D1500 features and the 10–20 d variability. Finally, we note that the 10–20 d variability may actually arise on a faint neighbouring star (see Section 2.3).
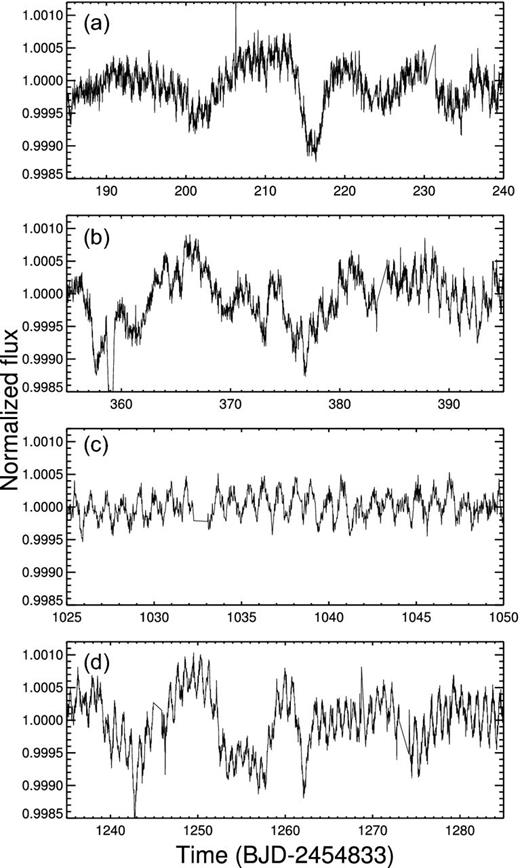
Stacked plots showing a zoomed-in portion of the Kepler light curve. The star's rotation period of 0.88 d is seen in each panel as the high-frequency modulation in flux. With the exception of panel ‘c’, a longer term (10–20 d) brightness variation is observed, also present in the FT shown in Fig. 2. Refer to Section 2.1 for details.
There is another possible periodicity that is worth discussing briefly. In Table 1, we summarize the times and depths of 10 discrete dips present in the Kepler light curve, also labelled in panel ‘(b)’ – ‘(e)’ of Fig. 1. If we examine the two most prominent dips [D1568 and D1520; also see panel ‘(d)’ in Fig. 1], we see that they have a separation of ∼48.8 d. We can also see that the D800 dip (dip 5 in Table 1) is separated from the D1520 dip by 15 of these intervals, if the interval is more precisely defined to be 48.4 d. Furthermore, the very shallow dips early in the Kepler time series at D260 and D360 are very close to 26 and 24 of these 48.4-d cycles from the D1520 dip. The other five identified discrete dips (four of which are very shallow), also listed in Table 1, are about a half cycle out of phase with this period to within ∼± 5 per cent of a cycle. In this exercise, we have neglected the fact that the three most prominent dips in the D1500 region are quite highly structured, and they also have additional minima whose times could have been tagged and included in the analysis. At this time we do not ascribe any particular significance to this period, but it is something to bear in mind as more data on this object become available.
Spectroscopy
We obtained four high-resolution (R = 47 000) spectra of KIC 8462852 with the FIES spectrograph (Frandsen & Lindberg 1999; Telting et al. 2014) mounted at the 2.56-m Nordic Optical Telescope (NOT) of Roque de los Muchachos Observatory in La Palma, Spain. The observations were performed on 11 August 2014, 5 November 2014, 20 November 2015, and 26 November 2015. The data were reduced using standard procedures, which include bias subtraction, flat fielding, order tracing and extraction, and wavelength calibration. The extracted spectra have a signal-to-noise ratio of 45–55 per pixel at 5500 Å.
Following the same spectral analysis procedure described in Rappaport et al. (2015), we use the spectrum code to calculate a grid of synthetic spectra using ATLAS9 models. We then use the co-added FIES spectrum to determine the stellar effective temperature Teff, surface gravity log g, projected rotational velocity vsin i, metal abundance [M/H], and spectral type of KIC 8462852 (Table 2). The plots in Fig. 5 show selected regions of the observed spectrum (black) along with the best fitting model (red). The temperature we derive (Teff = 6750 ± 140 K) is consistent with the photometric estimate of |$T_{\rm eff} = 6584^{+178}_{-279}$| K from the revised Kepler Input Catalogue properties (Huber et al. 2014), as well as with Teff = 6780 K derived from the empirical (V − K) colour–temperature relation from Boyajian et al. (2013). The projected rotational velocity we measure, vsin i = 84 ± 4 km s−1, is also well in line with the one predicted from rotation in Section 2.1, if the 0.88 d signal is in fact the rotation period. Overall, the star's spectrum is unremarkable, as it looks like an ordinary early F-star with no signs of any emission lines or P-Cygni profiles. Finally, we use the stellar properties derived from our spectroscopic analysis to estimate a stellar mass M = 1.43 M⊙, luminosity L = 4.68 L⊙, and radius R = 1.58 R⊙, corresponding to a main-sequence F3 V star based on the empirical calibrations from Pecaut & Mamajek (2013).3 Combining the radius (assuming a conservative value of 20 per cent for the radius error), projected rotational velocity, and rotation period (Section 2.1), we determine a stellar rotation axis inclination of 68° ± 29°.
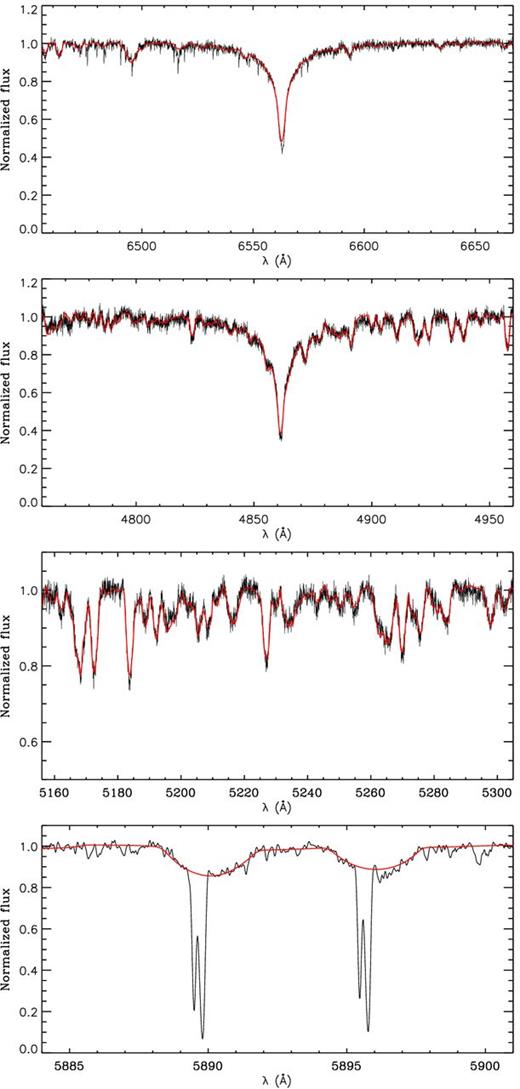
NOT spectrum closeups for KIC 8462852, the best-fitting stellar model shown in red. Panels show region near H α, H β, Mg, and Na D (top to bottom). The bottom panel shows both the stellar (broad) and interstellar (narrow) counterparts of the Na D lines. Refer to Section 2.2 for details.
Properties of KIC 8462852.
| Property | Value | Method/reference |
|---|---|---|
| RA (deg) | 301.564392 | KIC |
| DEC (deg) | 44.456875 | KIC |
| Kp (mag) | 11.912 | KIC |
| B (mag) | 12.262 ± 0.008 | 90 cm Schmidt (Section 2.4) |
| V (mag) | 11.705 ± 0.017 | 90 cm Schmidt (Section 2.4) |
| RC (mag) | 11.356 ± 0.024 | 90 cm Schmidt (Section 2.4) |
| IC (mag) | 11.051 ± 0.098 | 90 cm Schmidt (Section 2.4) |
| J (mag) | 10.763 ± 0.021 | 2MASS |
| H (mag) | 10.551 ± 0.019 | 2MASS |
| K (mag) | 10.499 ± 0.020 | 2MASS |
| W1 (mag) | 10.425 ± 0.023 | (ALL)WISE |
| W2 (mag) | 10.436 ± 0.020 | (ALL)WISE |
| W3 (mag) | 10.591 ± 0.123 | (ALL)WISE |
| W4 (mag) | 9.423a | (ALL)WISE |
| Rotational period (d) | 0.8797 ± 0.0001 | FT (Section 2.1) |
| Spectral type | F3 V | Spectroscopy (Section 2.2) |
| Teff (K) | 6750 ± 120 | Spectroscopy (Section 2.2) |
| log g (cgs) | 4.0 ± 0.2 | Spectroscopy (Section 2.2) |
| [M/H] (dex) | 0.00 ± 0.10 | Spectroscopy (Section 2.2) |
| vsin i (km s−1) | 84 ± 4 | Spectroscopy (Section 2.2) |
| Distance (pc) | 454 | Distance modulus (Section 2.3) |
| E(B − V) (mag) | 0.11 ± 0.03 | SED (Section 2.4) |
| Binary separation (arcsec) | 1.96 | Keck AO (Section 2.3) |
| Binary position angle (deg) | 96.6 | Keck AO (Section 2.3) |
| ΔJ (mag) | 4.209 ± 0.044 | Keck AO (Section 2.3) |
| ΔH (mag) | 3.840 ± 0.017 | Keck AO (Section 2.3) |
| ΔK (mag) | 3.619 ± 0.012 | Keck AO (Section 2.3) |
aUpper limit.
While interstellar medium features are not typically related to indicators of astrophysically interesting happenings in stars, we note the presence of stellar and interstellar Na D lines in our spectra. In the bottom panel of Fig. 5, we show a close up of the region containing the Na D lines (λλ5890, 5896Å). Within the two broad stellar features, there are two very deep and narrow Na D lines with split line profiles, indicating the presence of two discrete ISM clouds with different velocities of ∼20 km s−1.
Imaging
Fig. 6 shows the United Kingdom Infra-Red Telescope image of KIC 8462852 as well as a similarly bright source ∼40 arcsec away. The point spread function (PSF) of KIC 8462852 is asymmetric by comparison, leading us to speculate that KIC 8462852 has a faint companion star about 1.5–2 arcsec away.
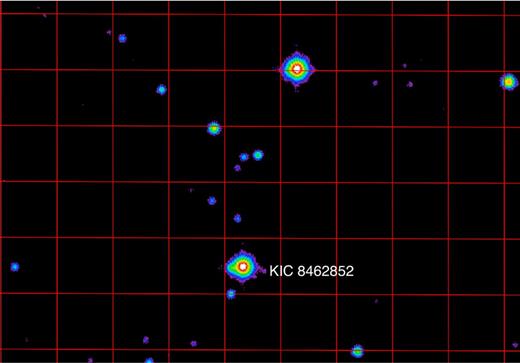
UKIRT image for KIC 8462852 and another bright star for comparison, showing that it has a distinct protrusion to the left (east). For reference, the grid lines in the image are 10 × 10 arcsec2. The colour coding is logarithmically scaled. Refer to Section 2.3 for details.
We observed KIC 8462852 on ut 2014 Oct 16 using the natural guide star adaptive optics (AO) system (Wizinowich et al. 2000) of the 10-metre Keck II Telescope on Mauna Kea, Hawaii. We used the facility IR camera NIRC2 and the J (1.25 μm), H (1.64 μm), and K (2.20 μm) filters from the Mauna Kea Observatories (MKO) filter consortium (Simons & Tokunaga 2002; Tokunaga, Simons & Vacca 2002). We used NIRC2's narrow camera, which produces a 0.00994 arcsec pixel−1 scale and a 10.2 arcsec field of view. Conditions were cloudy with variable seeing, around 1 arcsec full widths at half-maximum (FWHM). KIC 8462852 was observed over an airmass range of 1.26–1.28.
The AO-corrected images have FWHMs of 39 mas, 43 mas, and 51 mas at JHK, respectively, with rms variations of about 1–3 per cent. We obtained a series of nine images in each filter. The total on-source integration time was 65 s per filter. The images were reduced in a standard fashion using custom scripts written in the Interactive Data Language (idl). We constructed flat-fields from the differences of images of the telescope dome interior with and without lamp illumination. We subtracted an average bias from the images and divided by the flat-field. Then we created a master sky frame from the median average of the bias-subtracted, flat-fielded images and subtracted it from the individual reduced images. The individual reduced images were registered and stacked to form a final mosaic (Fig. 7).
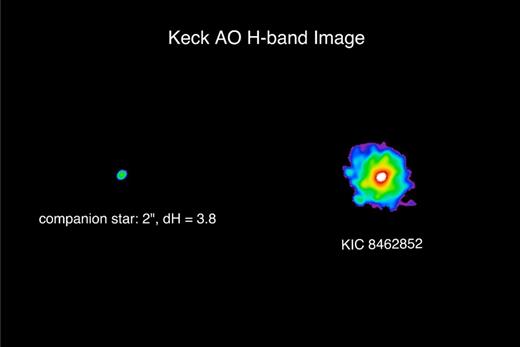
Keck AO H-band image for KIC 8462852 showing the companion was detected with a 2 arcsec separation and a magnitude difference ΔH = 3.8. The colour coding is logarithmically scaled. Refer to Section 2.3 for details.
As suspected from the asymmetric UKIRT image, the Keck AO images reveal an obvious faint companion at a separation of 1.95 arcsec and position angle of 96| $_{.}^{\circ}$|6. To measure the flux ratios and relative positions of the two components, we used an analytic model of the PSF as the sum of two elliptical Gaussian components, a narrow component for the PSF core and a broad component for the PSF halo, as we have done for other binaries (Liu, Dupuy & Ireland 2008). For the individual images obtained with each filter, we fitted for the flux ratio, separation, and position angle of the binary. To correct for optical distortions in NIRC2, we used the calibration of Yelda et al. (2010). The averages of the results were adopted as the final measurements and the standard deviations as the errors (Table 2).
It is unclear whether this is a physical or visual binary, though given the delta magnitude and separation, the chance alignment of the companion being a background or foreground object is only ∼1 per cent (Rappaport et al. 2014). At ∼2 per cent of the flux of the brighter star, this would be an ∼0.4 M⊙M2 V star, if it is indeed at the same distance as our target F-star (Kraus & Hillenbrand 2007). The JHK colours are also consistent with the companion being a dwarf, not a giant (Bessell & Brett 1988). If we take the magnitude of KIC 8462852 as V = 11.705, and the absolute visual magnitude of an F3V star to be V = 3.08 (Pecaut & Mamajek 2013), then the (reddened) distance modulus is 8.625. We derive a de-reddened distance of ∼454 pc using E(B − V) = 0.11 (Section 2.4; corresponding to a V-band extinction of AV = 0.341). Assuming the fainter star is associated with the main F-star target, the angular separation of ∼1.95 arcsec translates to a distance of ∼885 au. At this separation, the second star cannot currently be physically affecting the behaviour of the Kepler target star, though could be affecting bodies in orbit around it via long-term perturbations (see Kaib, Raymond & Duncan 2013). If such a star is unbound from KIC 8462852, but travelling through the system perpendicular to our line of sight, it would take only 400 years to double its separation if travelling at 10 km s−1. So, the passage would be relatively short-lived in astronomical terms.
We also obtained Speckle observations of KIC 8462852 on the night of ut 2015 Oct 22 using the DSSI instrument on the WIYN telescope located on Kitt Peak (Howell et al. 2011). Observations were made simultaneously in two filters with central wavelengths at 692 and 880 nm. Both filters show the source to be single, with no visible companion observed to within 0.08 arcsec and brighter than a delta magnitude of 3.8 and 4.2 mag (for the 692 and 880 nm filters, respectively). The companion star seen in the Keck NIRC2 image was not detected, favouring the conclusion that it is an M-dwarf, which would be too faint to be detected in the reddest DSSI filter (880 nm). However, it is important to note that these speckle results provide an independent confirmation of the results from Keck AO: KIC 8462852 has no additional companion down to a separation of ∼20 au detectable within the relative brightness limits with each instrument.
Finally, we speculate that the 10–20 d periodicity discussed in Section 2.1 might actually arise on the neighbouring faint M-star. The amplitude of those modulations is ∼500 ppm of the total target flux. If they arise on the M-star, then their fractional modulation of that star would be as high as 3 per cent, which would not be unusual for an M-star.
Spectral energy distribution
The SED of KIC 8462852 including optical, 2MASS (Skrutskie et al. 2006), (ALL)WISE (Wright et al. 2010), and Galex NUV (Morrissey et al. 2007) flux densities is shown in Fig. 8. Optical photometry in BV(RI)C filters was obtained by the 90 cm Schmidt telescope of the Konkoly Observatory at Piszkéstető Mountain Station. For standard magnitudes GD391 ABCE photometric standard stars were used as comparison (Landolt 2013). Photometric magnitudes are listed in Table 2.
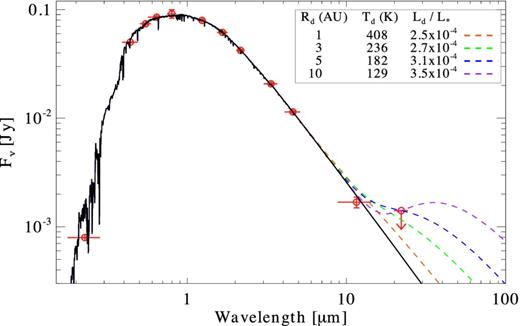
SED for KIC 8462852. The black solid line is a model for a star with Teff = 6750 K and E(B − V) = 0.11. Flux-calibrated photometry are plotted in red, where the extent of the ‘error bars’ in the X-direction indicates the wavelength range of each bandpass and the Y-direction shows the error of the flux measurement. Refer to Section 2.4 for details.
In order to study whether the system exhibits excess at mid-infrared wavelengths, we first fitted an ATLAS9 atmosphere model (Castelli & Kurucz 2004) to the photometric data points between 0.15 and 3.6 μm. From the grid of model atmospheres we selected the one that has the closest metallicity, surface gravity, and effective temperature to those derived from our spectroscopic study. Thus we fixed Teff, log g, and [Fe/H] parameters to 6750 K, 4.0, and 0.0, respectively, and only the amplitude of the model and the reddening were fitted. The best-fitted photospheric model is displayed in Fig. 8. We derive a reddening of 0.11 ± 0.03 mag. By comparing the measured W2 and W3 WISE flux densities at 4.6 and 11.6 μm (at 22 μm we have only an upper limit) with the predicted fluxes derived from the photosphere model we found them to be consistent, i.e. no excess emission can be detected at mid-infrared wavelengths. This lack of significant IR excess is independently confirmed using warm Spitzer/IRAC data by Marengo, Hulsebus & Willis (2015).
However, this does not exclude the existence of a colder debris disc or a warmer, but relatively tenuous disc. Assuming that the emitting grains act like a blackbody, we can derive their characteristic temperature at a specific stellar-centric distance. Using this approach, we compute the SED of a narrow dust belt located at a distance of 1, 2, 3, 5, and 10 au from a star with a luminosity of 4.7 L⊙, corresponding to the main-sequence stage (Pecaut & Mamajek 2013). The W3 and W4 band photometry were then used as upper limits to set the amplitude of the excess. Fig. 8 shows the result of these computations and summarizes the fundamental disc properties (dust temperature, upper limits for fractional luminosity) of the dust belts at different radii. It is worth noting that this very simple model accounts only for large blackbody grains, smaller (μm-sized) grains are ineffective emitters and may be heated to higher temperatures compared to larger grains at the same location. We revisit this analysis in more detail later in Section 4 (also see Fig. 12).
Ground-based photometric surveys
We reviewed the ∼700 photometric intensities from the years 1900–2000 from the Digital Access to a Sky Century at Harvard (DASCH) project4 (Grindlay et al. 2012). The error bars on the photometry are about ∼10 per cent. At this level, we found the star did not do anything spectacular over the past 100 years. However, if it underwent several ∼20 per cent dips in flux lasting for several days each during that period, the chances are high that there were no plates exposed at those times.
SuperWASP data (Butters et al. 2010) are unremarkable for KIC 8462852. We note that there is a 0.2 mag offset between the available SuperWASP data sets. However, we see the same offset when comparing its photometry with a similarly bright source nearby KIC 8462852. Thus, we reject this being real (e.g. due to a flaring event, etc.).
Unfortunately, KIC 8462852 falls outside the area covered by the KELT network (T. Beatty, private communication).
Limits on a close companion
We use the four FIES spectra (Section 2.2) to measure the presence of any Doppler shifts induced by a companion. We traced the radial velocity (RV) drift of the instrument by taking long-exposed ThAr spectra in a bracketed sequence, i.e. right before and after each target observation. RV measurements were derived by cross-correlating the target spectra with the rotationally broadened best-fitting Kurucz model. The RV measurements are listed in Table 3 along with the error bars and the barycentric Julian dates in barycentric dynamical time. To within the ∼400 m s−1 uncertainties in the RV measurements, the four values we measure are quite consistent with no change at all over the 470 d observation interval.
FIES RVs of KIC 8462852.
| BJD | RV | σRV |
|---|---|---|
| (− 245 0000) | (km s−1) | (km s−1) |
| 6881.5183 | 4.160 | 0.405 |
| 6966.3635 | 4.165 | 0.446 |
| 7347.3856 | 3.817 | 0.406 |
| 7353.3511 | 4.630 | 0.436 |
| BJD | RV | σRV |
|---|---|---|
| (− 245 0000) | (km s−1) | (km s−1) |
| 6881.5183 | 4.160 | 0.405 |
| 6966.3635 | 4.165 | 0.446 |
| 7347.3856 | 3.817 | 0.406 |
| 7353.3511 | 4.630 | 0.436 |
See Section 2.6 for details.
In order to quantify what limits we can set on the mass of a hypothetical close companion star, we carried out the following analysis. We assumed a circular orbit because there are insufficient data points to fit for the parameters in an eccentric orbit. Then, for each in a sequence of 4 × 10⁵ trial orbital periods, P, in the range of 0.5 to 3000 d, we fit the four RV points with a sine and cosine term to represent the orbit and a systemic γ velocity. From this fit we computed the velocity semi-amplitude K and added its 2-σ uncertainty to establish a conservative upper limit to K. We then used the upper limit on K to compute the corresponding upper limit on the mass function. Finally, we solved for the upper limit on the mass of the hypothetical close companion by taking the mass of the F-star to be 1.4 M⊙, and assuming three different orbital inclination angles (30°, 60°, and 90°). The results are shown in Fig. 9. The spikes are at values of P where the epochs of the four RV measurements are commensurate with being at orbital phase 0, and the mass constraints are weaker at these periods. For longer periods, the density of these spikes diminishes greatly and the lower locus of points can be taken as a likely upper limit on the mass of any companion. Therefore, we conclude that for periods between ∼30 and 300 d, the mass of any companion is very unlikely to exceed that of a brown dwarf.
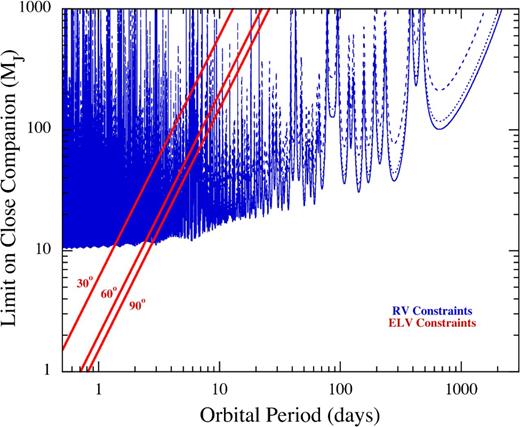
Upper limits (2σ confidence) to a hypothetical companion mass from the lack of ELVs (red curves) and lack of RV variations on four occasions (blue curves). Each type of constraint is shown for three different assumed orbital inclination angles (30°, 60°, 90°); these are marked directly on the ELV constraint curves, and can be inferred from the dashed, dotted, and solid curves, respectively, for the RV constraints. These results indicate that there are no objects heavier than a super-Jupiter in close orbits with Porb ≲ 2 d, and likely no heavier in mass than a brown dwarf for Porb ≲ 300 d. Refer to Section 2.6 for details.
The limits on the companion mass that we can set from the lack of ELVs, as a function of orbital period, are illustrated in Fig. 9. They are plotted as red lines for three different assumed inclination angles. Note that an angle of 90° is not allowed or we would have seen (regular) transits; it is shown in this figure for instructive purposes only. These ELV mass constraints are superposed on those discussed above based on the lack of RV differences among our four measurements (blue curves). Taken together, these results indicate that there is not likely to be a close companion to the F-star more massive than a super-Jupiter with Porb ≲ 2 d, nor more massive than a brown dwarf for Porb ≲ 300 d.
Space motion and age
Using our distance estimate of 454 pc (Section 2.3), the RV obtained from the FIES spectrum (Section 2.6), and proper motions and positions from the UCAC4 catalogue we computed the Galactic space motion of the target, yielding +31.5, −2.5, and +10.2 km s−1 for the U (defined as positive towards the Galactic centre), V, and W velocity components, respectively. Young disc population stars have low velocity dispersion and they occupy a special region within the velocity space. Based on the studies of Eggen (1989), Leggett (1992) defined a box by −50 < U <+20 km s−1, −30 < V <0 km s−1, and −25 < W <10 km s−1, which includes most of the young disc stars in our neighbourhood. Our target lies outside of this box. In fact, its galactic space motion – especially the U component – deviates significantly from the characteristic space motion of any nearby young (<100 Myr) kinematic groups, open clusters, and star-forming regions (Makarov 2007; Mamajek 2015). Altogether, it implies that KIC 8462852 likely does not belong to the youngest stellar population.
In making this distance estimate, we assumed that KIC 8462852 is a main-sequence star (Section 2.3). We note that assuming a pre-main or post-main sequence phase does not change our previous conclusion. These evolutionary stages would be accompanied by larger luminosities and thereby larger distances. This would result in a galactic space motion that deviates even more significantly from that of typical young disc stars. Unfortunately, our star falls outside the region where empirically calibrated age diagnostics such as chromospheric activity or stellar rotation period can be used (e.g. Mamajek & Hillenbrand 2008).
Similar dippers in the Kepler field?
The anomalous dips in KIC 8462852 were serendipitously found by the Planet Hunter citizen science group. Due to its aperiodic nature, it likely never would have been flagged/recovered by most searches for transits, eclipsing binaries, or asteroseismologically interesting stars. However, knowing the existence of KIC 8462852's light curve, we naturally wondered if there are, in fact, numerous other such objects in the main-field Kepler data base. We therefore applied a simple algorithm to search the data base for other systems similar to KIC 8462852. The algorithm consisted of searching for dips with depths of greater than 10 per cent (i.e. normalized fluxes of <0.9) that consist of five or more consecutive Kepler long-cadence samples (i.e. lasting more than ∼2.5 h). In all, this search turned up more than 1000 targets with this signature. The vast majority of them, however, were due to (1) eclipsing binaries, (2) the rotation signature of large amplitude starspots, and (3) some obvious Kepler data artefacts. We carefully examined the remaining small number of systems by eye, but could identify none that was reminiscent of KIC 8462852. We also lowered the threshold for dips to 5 per cent, but the search likewise turned up no candidates that one would believe closely resemble KIC 8462852. Of course, some of the visual comparison work is necessarily qualitative, but we were satisfied that there are at most a few similar systems to be found in the main Kepler field.
POSSIBLE EXPLANATIONS OF THE OBSERVED DIPPING EVENTS OBSERVED IN KIC 8462852
The main issue in explaining the peculiar light curve for KIC 8462852 is related to the presence of multiple dimming events, which are not periodic and of which the D800 single event has a smooth, yet highly asymmetric, profile, and the D1500 events are the deepest and most complex. Here, we introduce several scenarios to explain KIC 8462852 and discuss how the observational data do and do not support each theory.
Instrumental effects or data reduction artefacts?
The Kepler light curve for KIC 8462852 is unique, and we have thoroughly explored the raw data for defects/instrumental effects, which could cause the observed variations in KIC 8462852's flux. We use the PyKe software tools for Kepler data analysis to check the data for instrumental effects. We check the following possibilities.
We checked that the same flux variations, i.e. the ‘dips’, are present in the SAP_FLUX data set.
We verified that data gaps and cosmic rays events5 do not coincide with the dipping events, as they are prone to produce glitches in the corrected fluxes.
We verified at the pixel-level that there are no signs of peculiar photometric masks used in making the light curves.
We verified at the pixel level that the image light centroid does not shift during the ‘dipping’ events
We inspected the Kepler light curves of neighbouring sources and find that they do not show similar variability patterns in their light curves.
We determined that CCD cross talk, reflection, and column anomaly cannot be the cause (Coughlin et al. 2014).
We verified with the Kepler team mission scientists that the data were of good quality.
This analysis concludes that instrumental effects or artefacts in the data reduction are not the cause of the observed dipping events, and thus the nature of KIC 8462852's light curve is astrophysical in origin.
Intrinsic variability?
An example of a class of stars which display intrinsic variability are the R Coronae Borealis (RCB) type variables. These are highly evolved F–G supergiants (e.g. Clayton 1996) that have light curves which show pulsations (of the order of months) and irregular deep dips (lasting weeks to months). Their ‘dipping’ variability is associated with formation of clouds that obscure the photosphere, and is often observed as a sharp decrease in flux followed by a more gradual, and sometimes staggered, recovery. In the case of KIC 8462852 the time-scales of the dips are different than those of a RCB variable. Likewise, the ingress at D800 has a gradual decrease in flux, which is inverse to what is expected in a RCB, and the dip shapes at D1500 are also non-characteristic of a RCB. Lastly, the spectroscopic log g and vsin i are far from those of a supergiant. These items together strongly rule out the possibility of KIC 8462852 being a RCB variable.
Another possibility is the self-emission of disc material from the star itself, as in the case of Be-stars. Be stars are rapidly rotating (almost near breakup) stars that are usually of spectral class O and B, but sometimes A, and exhibit irregular episodic outbursts. Usually, these outbursts are in emission, but in some cases it can also result in dimming (see Hubert & Floquet 1998). Be stars also often exhibit quasi-periodic oscillations in the range of ∼0.5–1.5 d. This also fits the bill for what we see in the FT of KIC 8462852 (Section 2.1). It has been hypothesized (e.g. Rappaport & van den Heuvel 1982) that most, if not all, Be stars have a binary companion which originally transferred mass to the current Be star to spin it up to near breakup (the remnant of that star is sometimes found to be a neutron star). The periods of these binaries range from a couple of weeks to thousands of days (perhaps longer). If KIC 8462852 is a Be star, we would get an unprecedented look into the inner disc behaviour. In such a case, the broad peak in the FT at frequencies just below the 0.88 d periodicity could be explained by ejected material in a so-called ‘excretion disc’ that is moving outward but with roughly Keplerian velocity.
The lack of observed IR excess does not support the existence of an excretion disc. There is also an absence of Hα emission in the star's spectrum (although, as noted above, Be star Hα emission is known to be variable and turn off and on with time-scales from days to years). Furthermore, the temperature of KIC 8462852, Teff = 6750 K, is too cool to be a Be star. It is also unlikely to have been spun-up by a donor star whose remnant is still orbiting the F-star because of the constraints set by the four RV measurements and the limits on any ELVs (see Section 2.6). Though, we cannot rule out remnants orbiting with P ≳ a few years.
Extrinsic variability?
Related to the secondary star
We first consider whether KIC 8462852's flux is contaminated by the nearby M-dwarf detected with high-resolution images (Section 2.3). Whether or not the system is bound, the faint companion contributes light in the Kepler photometric aperture, which in turn affects the observed signal in the light curve. Our observations show that the flux ratio in the infrared is ∼30, which translates to a factor of several hundred in the Kepler bandpass. Thus, the maximum imprint that the M-dwarf has on the light-curve variability is ∼30 mmags; this is insufficient to make an impression on KIC 8462852's light curve at anything greater than ∼3 per cent, and, in particular, it could not possibly explain any of the large dips.
Occultation by circumstellar dust clumps
The dips could be readily explained in terms of occultation by an inhomogeneous circumstellar dust distribution. However, this does not mean that the dust distribution that would be required to explain the observations is physically plausible or would necessarily apply to KIC 8462852.
Inhomogeneous dust distributions have been invoked to explain dips seen towards some young stars such as UX Orionis or AA Tau-like ‘dipper’ systems (Herbst et al. 1994; Herbst & Shevchenko 1999; Morales et al. 2009; Cody et al. 2014; Ansdell et al. 2016). At an age of only a few tens of Myrs, these dipper stars have V-band light curves characterized by sporadic photometric minima with amplitudes of 2–3 mag and with durations of days to many weeks. These objects also generally exhibit strong infrared excess, starting at ∼2 − 5 μm and show signs of accretion (emission) in their spectra. However, in contrast to such systems, KIC 8462852 has no detectable IR excess or accretion signature to suggest that it is a young T Tauri star (Sections 2.2 and 2.4). Thus a scenario in which material in a gas-dominated protoplanetary disc occults the star due either to accretion columns or non-axisymmetric azimuthal or vertical structure in the inner disc (e.g. Herbst et al. 1994; Bouvier et al. 1999; Herbst & Shevchenko 1999; McGinnis et al. 2015) is strongly disfavoured.
We therefore are left to consider scenarios that could arise around a main-sequence or weak-line T Tauri star that has dispersed its protoplanetary disc, but still hosts a gas-poor planetary system that may include planets, asteroids, and comets. The ‘clumps’ of dust passing in front of the star could perhaps lie within an optically thin asteroid belt analogue that is otherwise undetected, or be more isolated objects such as remnants of a broken up comet. As in the above scenarios, the typical minimum sizes of the dust grains are ∼ μm (e.g. Backman & Paresce 1993), which are able to cause stellar variation by absorbing and scattering starlight at optical wavelengths. Before considering such scenarios in more detail, we start with some scenario-independent constraints that can be gleaned from the observations.
SCENARIO-INDEPENDENT CONSTRAINTS
To understand what could be the origin of the clumps it would help to know where they are located in the system; how big they are; and how long they last. To aid with this discussion, Fig. 10 shows some scenario-independent constraints on the size and orbital distance of the clumps that are discussed further below. The only assumption for now is that the clumps are on circular orbits, but this assumption is relaxed later in Section 5.4. Some of the constraints also assume the clumps to be opaque, but again this assumption is relaxed later.
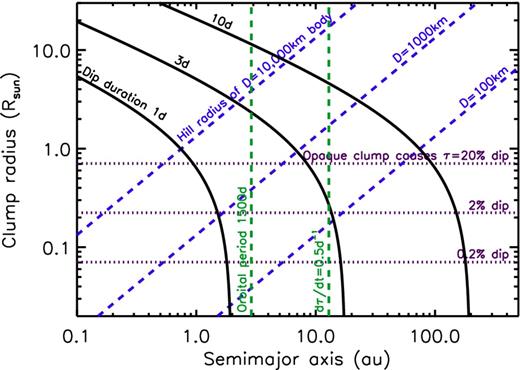
Size versus semi-major axis parameter space for optically thick, spherical dust clumps on circular orbits around a star of M* = 1.43 M⊙ and R* = 1.58 R⊙. The solid lines represent dips of equal duration (as labelled). Dotted lines show minimum clump sizes for dips of different depths. Vertical dashed lines show where the orbital period is 1500 d, and where the light-curve gradient for an optically thick ‘knife edge’ could be as high as 0.5 d−1. Diagonal dashed lines show Hill radii of planetesimals of different sizes, assuming a density of 3 g cm−3. Combined, the period, gradient, and duration constraints in the circular orbit scenario suggest the clumps lie between ∼3 and 10 au, and have sizes similar to the star.
Dip depth: a minimum clump size is set by the depth of the dimming events, which we characterize as 1 minus the normalized flux, which we call τ. For example, even if the clump is completely opaque, the maximum dip depth is max(τ) = (s/R*)2. The deepest τ = 20 per cent dimming event at D1500 thus implies that at least some clumps are a sizeable fraction of the stellar size. A dip caused by a fully optically thick symmetrical clump would also have a characteristic symmetrical shape which does not resemble those observed (e.g. panel ‘c’ in Fig. 1), so this can be regarded as a strong lower limit. While there appear to be a range of event durations, the duration of the deepest events is at most about 3 d. The middle solid line in Fig. 10 (for tdip = 3 d and a depth of τ = 20 per cent) therefore decreases the outer limit on the clump locations mentioned above to closer to 8 au.
Light-curve gradient: a similar, but independently derived, outer constraint on the clump location can be set by examining the gradients in the light curve, which are at most half of the total stellar flux per day (i.e. 0.5 d−1 when the light curve is normalized to 1). Orbiting material can change the light curve most rapidly when it is optically thick and passing the stellar equator (i.e. the ‘knife edge’ model of van Werkhoven, Kenworthy & Mamajek 2014). The high rate of change in the KIC 8462852 light curve translates to a lower limit on the transverse velocity of the orbiting material of about 9 km s−1, which corresponds to an upper limit of 13 au for material on circular orbits, although as discussed in Section 5.4, this upper limit is closer to the star if the clump is optically thin.
Non-periodicity: the lack of evidence for a clear periodicity in the dips in the observed light curve excludes orbital periods shorter than ∼1500 d, which thus constrains the location to lie beyond about 3 au. This constraint could be broken if the clumps disperse within a single orbit. Likewise, if the two deep dipping events at D800 and D1500 are from the same orbiting body (or bodies), a period of 700–800 d remains a possibility.
Gravitational binding: to address the survival of the clumps, we note that in any scenario where the clumps are not self-gravitating, they cannot be long-lived in the face of orbital shear (e.g. Kenyon & Bromley 2005) and their internal velocity dispersion (e.g. Jackson & Wyatt 2012). Fig. 10 therefore shows planetesimal sizes required to retain dust clouds within their Hill sphere, RHill = a(Mpl/[3M*])1/3, as one way of ensuring long-lived clumps.
Thus, under the assumption of circular orbits, the depth, duration and lack of periodicity of the dimming events constrains their location to a region roughly corresponding to that occupied by the giant planets in the Solar system (i.e. between the green dashed lines). Clump sizes would thus be comparable to, but larger than, the star (i.e. above the uppermost horizontal dotted purple line), and they would have to have high, but not necessarily unity optical depth. It might be possible to explain the clumps as dust bound to planetesimals larger than around 1000 km, which means such planetesimals are not necessarily large enough for direct transit detection (the lack of which could provide another constraint).
This cross-sectional area can then be converted to fractional luminosity at a given distance from the star using f = σtot/(4πa2). The blue lines in Fig. 12 show the limits on the dust fractional luminosity f = Ldust/L* derived from the SED (Section 2.4). These can be thought of as the maximum luminosity of blackbodies at a range of dust temperatures (or stellocentric radii) that fit under the WISE photometry. The dust estimate from equation (4) is shown as a green line, and the fact that it lies below the blue line at all radii beyond 0.2 au indicates that it is perhaps not particularly surprising that no mid-IR excess was seen.
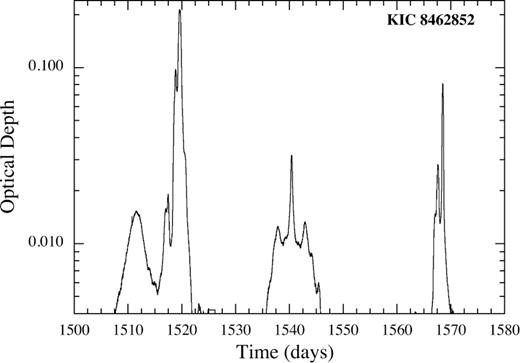
Inverted light curve for KIC 8462852 portraying the blocking factors needed to reproduce the light curve as a function of time. Refer to Section 4 for details.
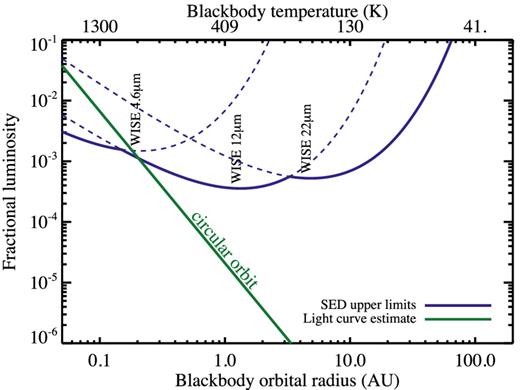
Fractional luminosity limits (blue lines) and an estimate of the system dust content from the light curve (green line). The dust level is constrained to lie below the blue line by the WISE photometry (4.6 μm, 12 μm, and 22 μm). The green line integrates the optical depth in the light curve assuming that clumps are similar in size to the star and on circular orbits. If the clumps lie beyond about 0.2 au the IR non-detection of the dust is unsurprising, although many scenarios require more emission than that from dust seen to pass along our line of sight to the star. Refer to Section 4 for details.
However, this dust area estimate is only a lower limit since it only includes the dust which passed in front of the star during the lifetime of the Kepler mission. The true area would be larger if there are more clumps further along the orbit which have yet to pass in front of the star, and could also be larger if the dips do not capture all of the cross-sectional area in their clumps. Furthermore, for some specific scenarios discussed in the following sections, the presence of clumps that pass in front of the star requires the existence of other clumps that do not pass along our line of sight. The lack of infrared emission thus places constraints on how many such clumps are there in the system. For example, Fig. 12 shows that for clumps at a few au the cross-sectional area can only be increased by 3 orders of magnitude before it is detectable by WISE. The calculation is further complicated should the clumps be considered to be short-lived, or on non-circular orbits.
Mass estimates: the minimum possible cross-sectional area required to cause the observed dips, σtot (equation 5), can also be used to determine a minimum possible dust mass, mtot. If the dust all has the same diameter D and density ρ then mtot/σtot = 2ρD/3, resulting in a total mass of 6.7 × 10¹⁸ g for 1 μm diameter dust of density 3 g cm−3 orbiting at 3 au (and scaling as a−1/2ρD for different assumptions). If all of this mass were put in a single body of the same density ρ, this would have a diameter of 16 km. This illustrates that the minimum mass of the parent body required to cause this phenomenon is approaching the mass of comet Hale–Bopp. However, this calculation has a few caveats. For one, the value derived for σtot is an absolute minimum given that it only accounts for the material which passed in front of the star during the observations. It also does not account for the possibility that the dust in the clump has a range of sizes. For example, for dust with a power-law size distribution with index of 3.5 (Dohnanyi 1969) extending from Dmin to Dmax, the ratio of mass to cross-sectional area scales |$\propto \rho \sqrt{D_{\rm min}D_{\rm max}}$|. Thus, this estimate would be 100 times larger than that derived above if the size distribution extended from 1 μm up to 1 cm.
Given these basic constraints we now consider several scenarios that may explain the observations. The first two are related to collisions within an asteroid belt (Section 5.1) or unstable planetary system (Section 5.2), the third considers dust that orbits within the Hill spheres of large planetesimals which may reside in an asteroid belt but are not required to collide (Section 5.3), and the fourth is that the dips are the passage of a series of fragments from a broken-up comet or asteroid on a highly elliptical orbit (Section 5.4).
SPECIFIC OCCULTATION SCENARIOS
Aftermath of catastrophic collisions in asteroid belt
One possibility is that the dimming events are caused by dust thrown off in collisions between planetesimals in an otherwise unseen asteroid belt analogue (e.g. Wyatt & Dent 2002; Zeegers, Kenworthy & Kalas 2014). The dust clouds created in these destructive collisions expand at roughly the planetesimals’ escape velocity from the colliding bodies, eventually spreading and shearing out to form a smooth dust component in which the clumps reside. Such a scenario is a promising explanation for the star RZ Psc (de Wit et al. 2013), though in that case evidence that the underlying asteroid belt exists is given by a strong IR excess.
There are several problems with this scenario as applied to KIC 8462852 however. Probably the most fundamental of these is the absence of an IR excess from the smooth component. This is because for every clump we see, remembering that these were inferred to be slightly larger than the star, there should be many more that have spread out. The infrared emission from the dispersed clumps would likely sum up to a detectable level, even before counting dust produced in non-dip forming events. Moreover, we should see dips from the clumps in the middle of being dispersed (i.e. dips with longer duration albeit lower optical depth), as well as dips with a continuum of depths and durations from the many different scales of planetesimal impacts that would occur. The clustering of dips at D1500 also points to these events being correlated which is hard to reconcile with this scenario, though the planetesimals in the belts could be shepherded by planets into confined azimuthal regions (e.g. Wyatt 2003; Nesvorný, Vokrouhlický & Morbidelli 2013).
Aftermath of giant impact in planetary system
A possible way around the issues in Section 5.1 is to invoke dust thrown off in a single collision, perhaps analogous to the Earth–Moon system forming event (Jackson & Wyatt 2012). In this case there need not be an underlying asteroid belt, as the collision could be between planets whose orbits recently became unstable, or between growing planetary embryos. Such events are expected to result in strong IR excesses (e.g. Jackson & Wyatt 2012; Genda, Kobayashi & Kokubo 2015), and are indeed seen in systems such as HD 172555 where giant impacts are the favoured explanation (Lisse et al. 2009). In this scenario, the putative collision would need to have occurred between the WISE observation taken in Kepler Q5 and the first large dip at D800. The dip at D1500 is then interpreted as the same material seen one orbit later, with the ∼750 d period implying an orbit at ∼1.6 au. The difference in the dip structure from D800 to D1500 could arise because the clump(s) created in the original impact are expanding and shearing out. This scenario therefore predicts that KIC 8462852 may now have a large mid-IR excess, but the most recent IR observations taken in 2015 January with Spitzer IRAC show no significant excess for KIC 8462852 (Marengo et al. 2015). However, non-detection of an excess would not necessarily rule this scenario out, as the dust levels derived in Section 4 (which account for the dust seen passing in front of the star) were shown to be consistent with a non-detection. A more robust prediction is that future dimming events should occur roughly every 750 d, with one in 2015 April and another in 2017 May.
Two new issues arise with this scenario however. First, if the period of the orbiting material is a few years, what is the origin of the two small 0.5 per cent dips seen in the first few hundred days (D140 and D260; Table 1), and why did they not repeat 750 d later? It is a concern that these could require the existence of an outer planetesimal belt, which may contradict the lack of infrared emission to this star. Perhaps more problematic is the probability that this star (of unknown age) should suffer such an event that occurs within a few-year window between the WISE observation and the end of the prime Kepler mission, and that the geometry of the system is such that material orbiting at ∼1.6 au lies almost exactly between us and the star. Taking this few year window, the main-sequence lifetime, and an optimistic estimate for the scale height of giant impact debris, and the number of Kepler stars observed, this suggests that every star would have to undergo 104 such impacts throughout its lifetime for us to be likely to witness one in the Kepler field. Thus, while this scenario is attractive because it is predictive, the periodicity argument may be inconsistent, and the probability of witnessing such an event may be very low (though of course difficult to estimate).
Dust-enshrouded planetesimals
Scenarios in which the clumps can be long-lived are attractive because they suffer less from being improbable. Thus, one possibility is that the clumps are held together because they are in fact themselves orbiting within the Hill sphere of large planetesimals. They can therefore be thought of as planetesimals enshrouded by near-spherical swarms of irregular satellites, which are themselves colliding to produce the observed dust. This scenario is therefore analogous to that suggested for the enigmatic exoplanet Fomalhaut b (Kalas et al. 2008; Kennedy & Wyatt 2011), which borrows from the irregular satellites seen in the Solar system (e.g. Jewitt & Haghighipour 2007; Bottke et al. 2010). This scenario suffers from several problems. First, the observed dips already require multiple large planetesimals. Unless these all orbit within the same plane to a high degree (i.e. to within a few stellar radii), there must be many more large planetesimals which never (or have yet to) pass in front of the star. Debris discs with low levels of stirring are theoretically possible (Heng & Tremaine 2010; Krivov et al. 2013). However, these low stirring levels require the absence of large planetesimals which through mutual interactions would stir the relative velocities to their escape speeds. This is in addition to the problem of filling the Hill sphere of such planetesimals almost completely with dust. This may be reasonable if the planetesimals are embedded in a belt of debris. However, that would incur the problem of the lack of infrared excess. The question also remains why the D1500 events are so clustered, and why there are several deep dimming events and no intermediate ones. A population of planetesimals should have a variety of inclinations with respect to our line of sight, so they should pass in front of the star at a range of impact parameters and cause a range of dip depths.
A related scenario is that the planetesimals are surrounded by large ring systems, similar to that invoked to explain the ∼50 d dimming event seen for 1SWASP J140747.93−394542.6 (normally called ‘J1407’, Mamajek et al. 2012; van Werkhoven et al. 2014; Kenworthy & Mamajek 2015). In that case, however, a single relatively time-symmetric dimming event was seen, whereas KIC 8462852 has multiple asymmetric events. Thus, a single ringed planet(esimal) would not reproduce the observed light curve, and a scenario with multiple ringed-planetesimals would be essentially the same as the irregular satellite scenario above.
A family of objects on a comet-like trajectory
One of the scenario-independent constraints considered in Section 4 was the presence of light-curve gradients as large as 0.5 d−1, which results in an upper limit of 13 au for the clumps’ semi-major axis assuming optically thick clumps (Fig. 10). However, the star is never completely occulted, so this estimate should be corrected for the optical depth of the clump τ. That is, the steepness of the gradient is diluted either by flux transmitted through a large optically thin clump (or by unocculted parts of the star for an optically thick small clump). Assuming τ = 0.2 the velocity estimate given by the gradients is then five times higher than assumed in Section 4; this would predict a more realistic minimum transverse velocity of ∼50 km s−1 to cause the observed gradient, which for a circular orbit yields a maximum semi-major axis of a = 0.5 au. While this estimate is uncertain, for example because of the unknown optical depth structure of the different clumps, this highlights the possibility that the material may be moving so fast that the velocity for a circular orbit is inconsistent with the non-repetition of the events.
One solution to this problem is that the orbits need not be circular. That is, we could be seeing material close to the pericentre of a highly eccentric orbit, reminiscent of comets seen in the inner Solar system at pericentre (Marsden 1967; Sekanina 1984). Comets around other stars have also been detected, the first of these being found around Beta Pictoris (Smith & Terrile 1984; Lagrange-Henri et al. 1989; Beust et al. 1990). We therefore envision a scenario in which the dimming events are caused by the passage of a series of chunks of a broken-up planetesimal on a comet-like orbit. That planetesimal may have been analogous to what we refer to in the Solar system as a ‘comet’, in which case it could be volatile-rich and may have broken up as a result of thermal processes. However, it may alternatively have closer analogy with Solar system asteroids in having a more refractory composition, which might require non-thermal processes such as tidal disruption to break it up. The disruption mechanism and composition of the planetesimal are not defined for this scenario, just its orbit which is comet-like, and so we refer to it here-on as a ‘comet-like’ without bias to their origin or physical make-up. Regardless of its disruption process, the resulting chunks would have to have since spread around the orbit, and may be continuing to fragment to cause the erratic nature of the observed dips.
To assess this scenario, Fig. 13 revisits the clump–orbit parameter space of Fig. 10 (discussed in Section 4), but now uses the pericentre of the clump's orbit instead of its semi-major axis. The orbits are assumed to be highly eccentric (e ≈ 1), with the dips arising from material close to pericentre, so that their orbital velocity is roughly |$\sqrt{2}$| times the circular Keplerian velocity at that distance. The limits from the dip depths and light-curve gradient are again shown, as are lines of constant dip duration. The planetesimal Hill radius lines are not shown, because they are not applicable to the cometary scenario considered here, though these would be slightly modified versions of those in Fig. 10 (see equation B5 of Pearce & Wyatt 2014). In general, the main change compared with Fig. 10 is that the higher orbital velocity relaxes the constraints on how far out the clumps can be orbiting. However, as mentioned above, if the clumps are optically thin (as opposed to optically thick as assumed in Fig. 13) the constraint from the light-curve gradient may be more stringent. For example, decreasing the optical depth to 0.2 would result in a transverse velocity of 50 km s−1 (see above), thereby moving the light-curve gradient constraint on the upper limit from 26 au closer to 1 au.
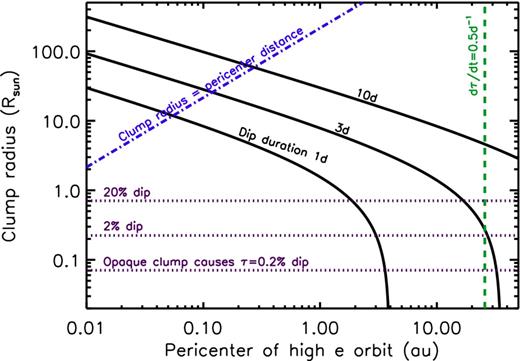
Size versus pericentre parameter space for high eccentricity comet-like orbits. Dotted lines show lower limits on the clump sizes from the dip depths. The dashed line is the outer limit set by the light-curve gradient, noting that this limit decreases with decreasing optical depth, e.g. the limit would be at a pericentre that is 25 times smaller than that plotted if the clumps have optical depth of 0.2 (line not shown in figure). The dot–dashed line is where the clump radius equals the pericentre distance, though the clumps could exist above here if they are elongated along the orbital direction. The solid lines are of constant dip duration.
The proximity of the comet-like clump to the star when causing the dip does not present a problem for this scenario, as it did when the clump was on a circular orbit. This is because the pericentre distance does not necessarily bear any relation to the period with which the comet-like fragments return to pass in front of the star. That period is set by the semi-major axis which has the same constraint as shown in Fig. 10, and there is no such constraint on the pericentre in Fig. 13. Thus, the point of note from Fig. 13 is that the pericentre could be significantly within 1 au. Closer pericentres are favoured both because this geometry results in a higher probability of the clumps occulting the star along our line of sight, and because of the greater opportunities for fragmentation of the bodies. The temperatures of comets (i.e. with volatiles) at such close proximity to the star (>410 K) would render them susceptible to thermal stresses. The existence of multiple super-Earth planets orbiting <1 au from many main-sequence stars also points to the possibility that the body could have been tidally disrupted in a close encounter with one such planet. It is even possible that the body came close enough to the star for tidal disruption in the absence of other considerations; e.g. a comet similar to Halley's comet would fall apart by tidal forces on approach to within 3–7 stellar radii (0.02–0.05 au). By contrast, a rocky body would require a closer encounter to tidally disrupt.
For close pericentres it is important to point out that while the constraint is discussed in terms of the clump's radius, the clump cannot in fact be spherical at that size. Fig. 13 shows a blue dot–dashed line where the ‘clump radius’ is the same as the pericentre distance. At such proximity, the clump could not be elongated in the radial direction, but could only be elongated azimuthally along the orbit. In fact, this mostly linear clump structure is the correct way to visualize debris from the breakup of a comet or planetesimal. The small velocity kicks (from fragmentation or tidal disruption) would cause a small dispersion in semi-major axis for material in the clump, and the resulting differential orbital motion causes the material to spread around the orbit. These small kicks do not significantly change the periastron distance or the orbital inclination angle.
This scenario is attractive, because comets are known in the Solar system to have highly eccentric orbits and disrupt for various reasons near pericentre, and infalling comets are the most robust explanation for the falling evaporating body (FEB) phenomenon seen around many nearby A-type stars (e.g. Kondo & Bruhweiler 1985; Beust et al. 1990; Welsh & Montgomery 2013; Kiefer et al. 2014). Also, since fragments of the comet family would all have very similar orbits, this mitigates the problem noted in Section 5.1 that the detection of multiple transits may require orders of magnitude more clumps to be present in the system. Instead, the observed clumps may be essentially in a single orbit which is that of the progenitor, and that orbit happens to be preferentially aligned for its transit detection. That is, it is not excluded that we have observed all the clumps present in the system. While a quick look at Fig. 12 suggests that the lack of infrared excess might still be problematic for the closest pericentres (noting that σtot also needs to be increased by |$\sqrt{2}$| due to the higher transverse velocity at pericentre in equation (5)), in fact that is not necessarily the case. Rather, in that figure we assumed that the clumps were present at the given distance at all times, whereas the clumps in the comet-like group scenario were at much larger separation from the star at the time of the WISE observations. The total mass of the fragmented body was considered in Section 4, but since the clumps can be closer to the star in this scenario, and are moving faster than circular Keplerian velocity, a better minimum mass estimate for clumps seen at a pericentre of 0.1 au is ∼3 × 10¹⁹ g. Again, the size distribution and any material not contributing to the observed dips will increase this minimum mass, perhaps by a factor of 100, leading to a more realistic parent body mass of 3 × 10²¹ g, consistent with a rocky body ∼100 km in diameter.
It remains to be shown that this model can explain the more detailed structure of the light curves. Some potential positives are that the clustered nature of the dips could be explained by subsequent fragmentation of a large fragment from an earlier break-up. The smaller dips could also potentially be explained by smaller fragments which may also be expected to receive larger kicks during fragmentation. However, the structure of individual clumps may be problematic. For example, a fairly generic prediction of transits of comet-like bodies may be that their light curves show signs of their tails. The light curve expected for a typical event then has a relatively fast ingress as the head of the comet passes in front of the star, but a slower egress as the tail passes (e.g. Lecavelier Des Etangs, Vidal-Madjar & Ferlet 1999; Rappaport et al. 2012). However, the D800 event shows the opposite (see panel ‘c’ in Fig. 1). Possible resolutions of this issue are that the D800 comet fragment received a large kick with an orientation that sheared it out in such a way to form a ‘forward tail’. Such forward comet tails produced by the fragments being kicked towards the star have been studied in the literature, but require the grains in the tail to be large enough to overcome the effects of radiation pressure (Sanchis-Ojeda et al. 2015). Alternatively, this event could comprise two dips superimposed to have the appearance of a forward tail. While several issues remain to be explored, of the scenarios considered we conclude that a cometary-like group of bodies seems most consistent with the data at hand.
SUMMARY AND CONCLUSIONS
In this paper, we have shown that KIC 8462852 is a unique source in the Kepler field. This otherwise seemingly normal F-star undergoes erratic and completely unpredictable dips in flux ranging from ≲ 1 per cent to more than 20 per cent. Most of the approximately seven dips observed before D1500 have fairly smooth, but unexplained, dip profiles that are each several days long. The D1500 sequence lasts continuously for at least 80 d, but the majority of that time is spent with the flux depressed by less than ∼2 per cent.
We have conducted numerous follow-up investigations of the star and its environment, including spectroscopy, AO imaging, construction of a spectral energy distribution, generation of an FT and a sonogram using the Kepler time series, and examination of ground-based photometry. Our analysis characterizes the object as both remarkable (e.g. the ‘dipping’ events in the Kepler light curve) and unremarkable (ground-based data reveal no deviation from a normal F-type star) at the same time.
An extensive set of scenarios has been presented to explain the occurrence of the dips, most of which are unsuccessful in explaining the observations in their entirety. Of these, the scenarios invoking intrinsic variability, such as the Be star framework, were deemed unlikely, but they are not entirely ruled out as a plausible option to explain the dips. However, we pointed out that the relatively low Teff and lack of Hα emission and IR excess in KIC 8462852 are not suggestive of Be-star activity.
A broad range of scenarios for the dipping behaviour that involve occultation by circumstellar dust clumps was considered. Among these, we find that the break-up of one or more massive exocomets (or planetesimals on comet-like orbits) provides the most compelling explanation consistent with the data in hand. The required mass of the original body may have been in excess of 3 × 10²¹ grams (only ∼0.3 per cent the mass of Ceres, and perhaps ∼100 km in diameter).
We can envision a scenario in which a barrage of bodies, such as described above, could be triggered by the passage of a field star through the system. And, in fact, as discussed in Section 2.3, there is a small star nearby (∼1000 au; Section 2.3) which, if moving near to KIC 8462852, but not bound to it, could trigger such a barrage into the vicinity of the host star. On the other hand, if the companion star is bound, it could be pumping up comet eccentricities through the Kozai mechanism. Measuring the motion/orbit of the companion star with respect to KIC 8462852 would be telling as to whether or not they are physically associated, and we could then be better able to make assessments about the time-scale and repeatability of comet showers based on bound or unbound star–comet perturbing models.
Continuing observations of KIC 8462852 should aid in unravelling the peculiar dips in its light curve. First and foremost, long-term photometric monitoring is imperative in order to catch future dipping events. It will be helpful to know whether such observations reveal continued, possibly periodic dips, or no further dips. If the dips continue, it will be important to search for a clear periodicity, and to look for changes in depth or shape. To completely solidify the hypothesis that the dips are due to dust, observations should study the wavelength dependence of the obscuration soon after a new dip is discovered. In the case of a family of giant comet-like bodies there presumably should be at least a few events similar to those seen with Kepler over the next decade. However, if the comet-like objects actually populate a very long eccentric orbit (i.e. that of the original planetesimal), the material may be spread out around that orbit, and future dippings events could continue to appear over hundreds of years.
Several of the proposed scenarios are ruled out by the lack of observed IR excess (Section 2.4), but the comet/planetesimal fragments scenario has the least stringent IR constraints. In the comet scenario, the level of emission could vary quite rapidly in the near-IR as clumps pass through pericentre (close to the time they are transiting) and are shedding new material. If the system is currently in the aftermath of a giant impact, there could be a semi-steady increase in IR flux over years/decades. The WISE observations were made in Q5, and assuming that an impact occurred in Q8 (D800, Section 5.2), detecting the IR emission from such an impact is still a possibility in the future. The only Spitzer IRAC observation of KIC 8462852, taken in 2015 January, showed a marginal, but below 3σ, excess at 4.5μm, disfavouring the impact scenario (Marengo et al. 2015). Continued monitoring in the IR will allow us to firmly distinguish between the giant-impact and cometary-group scenarios.
In summary, it will require some observational skill and patience to find the next dipping event from this object using ground-based observations. As we pointed out, the source spent a rather small fraction of its time during the 4-yr Kepler mission with dips of greater than 2 per cent. Nonetheless, the key to unravelling the mysterious dips will require such observations.
We thank Jason Wright and Jason Curtis for fruitful discussions on the object. We further acknowledge Planet Hunter user ‘Exoplanet1’ for their contributions to the discussion of this object. We are grateful to Sherry Guo and Bhaskar Balaji for running an automated search through the Kepler set to find other similar dippers. We acknowledge Mike Jura for very insightful comments about the required mass of the body that is the origin of the obscuring material. We thank Josh Carter for pointing out the possible 48-d periodicity. We appreciate the efforts of Jeff Coughlin, Jon Jenkins, and Jeffrey Smith for taking a careful look at the raw Kepler photometry to decide if it was all good, i.e. not artefacts. We thank Mark Everett and Lea Hirsch for making the DSSI observations. We thank Huan Meng, Massimo Marengo, and Casey Lisse, for insightful comments related to the IR excess. We are grateful for thoughtful discussions with members of the Kepler Eclipsing Binary Working Group, and attendees of the K2 SciCon 2015. Last but not least, we are grateful for the anonymous referee's comments to help us improve the paper.
TSB acknowledges support provided through NASA grant ADAP12-0172 and ADAP14-0245. MCW and GMK acknowledge the support of the European Union through ERC grant number 279973. The authors acknowledge support from the Hungarian Research Grants OTKA K-109276, OTKA K-113117, the Lendület-2009 and Lendület-2012 Program (LP2012-31) of the Hungarian Academy of Sciences, the Hungarian National Research, Development and Innovation Office – NKFIH K-115709, and the ESA PECS Contract No. 4000110889/14/NL/NDe. This work was supported by the Momentum grant of the MTA CSFK Lendület Disc Research Group. GH acknowledges support by the Polish NCN grant 2011/01/B/ST9/05448. Based on observations made with the NOT, operated by the Nordic Optical Telescope Scientific Association at the Observatorio del Roque de los Muchachos, La Palma, Spain, of the Instituto de Astrofisica de Canarias. This research made use of The DASCH project; we are also grateful for partial support from NSF grants AST-0407380, AST-0909073, and AST-1313370. The research leading to these results has received funding from the European Community's Seventh Framework Programme (FP7/2007-2013) under grant agreements no. 269194 (IRSES/ASK) and no. 312844 (SPACEINN). We thank Scott Dahm, Julie Rivera, and the Keck Observatory staff for their assistance with these observations. This research was supported in part by NSF grant AST-0909222 awarded to M. Liu. The authors wish to recognize and acknowledge the very significant cultural role and reverence that the summit of Mauna Kea has always had within the indigenous Hawaiian community. We are most fortunate to have the opportunity to conduct observations from this mountain. KS gratefully acknowledges support from Swiss National Science Foundation Grant PP00P2_138979/1. HJD and DN acknowledge support by grant AYA2012-39346-C02-02 of the Spanish Secretary of State for R&D&i (MINECO). This paper makes use of data from the first public release of the WASP data (Butters et al. 2010) as provided by the WASP consortium and services at the NASA Exoplanet Archive, which is operated by the California Institute of Technology, under contract with the National Aeronautics and Space Administration under the Exoplanet Exploration Program. This publication makes use of data products from the Wide-field Infrared Survey Explorer, which is a joint project of the University of California, Los Angeles, and the Jet Propulsion Laboratory/California Institute of Technology, and NEOWISE, which is a project of the Jet Propulsion Laboratory/California Institute of Technology. WISE and NEOWISE are funded by the National Aeronautics and Space Administration. This research made use of the SIMBAD and VIZIER Astronomical Databases, operated at CDS, Strasbourg, France (http://cdsweb.u-strasbg.fr/), and of NASA's Astrophysics Data System.
Based on observations obtained with the Nordic Optical Telescope, operated on the island of La Palma jointly by Denmark, Finland, Iceland, Norway, and Sweden, in the Spanish Observatorio del Roque de los Muchachos of the Instituto de Astrofisica de Canarias.
The data presented herein were obtained at the W.M. Keck Observatory, which is operated as a scientific partnership among the California Institute of Technology, the University of California, and the National Aeronautics and Space Administration. The Observatory was made possible by the generous financial support of the W.M. Keck Foundation.
Also present in the raw SAP data.
The times of these events are recorded in the headers of the fits files.
REFERENCES
