-
PDF
- Split View
-
Views
-
Cite
Cite
J. C. Muzzio, Partially chaotic orbits in a perturbed cubic force model, Monthly Notices of the Royal Astronomical Society, Volume 471, Issue 4, November 2017, Pages 4099–4110, https://doi.org/10.1093/mnras/stx1922
Close - Share Icon Share
Abstract
Three types of orbits are theoretically possible in autonomous Hamiltonian systems with 3 degrees of freedom: fully chaotic (they only obey the energy integral), partially chaotic (they obey an additional isolating integral besides energy) and regular (they obey two isolating integrals besides energy). The existence of partially chaotic orbits has been denied by several authors, however, arguing either that there is a sudden transition from regularity to full chaoticity or that a long enough follow-up of a supposedly partially chaotic orbit would reveal a fully chaotic nature. This situation needs clarification, because partially chaotic orbits might play a significant role in the process of chaotic diffusion. Here we use numerically computed Lyapunov exponents to explore the phase space of a perturbed three-dimensional cubic force toy model, and a generalization of the Poincaré maps to show that partially chaotic orbits are actually present in that model. They turn out to be double orbits joined by a bifurcation zone, which is the most likely source of their chaos, and they are encapsulated in regions of phase space bounded by regular orbits similar to each one of the components of the double orbit.
1 INTRODUCTION
In autonomous Hamiltonian systems of 3 degrees of freedom, regular orbits obey two isolating integrals besides energy and, in principle, chaotic orbits may either conserve only the energy or obey also an additional integral. In fact, Contopoulos et al. (1978) found in one of those systems three regions where the motions obeyed, respectively, two integrals besides energy, one integral besides energy or only the energy integral. The existence of at least three disjoint invariant regions with a different ‘degree of stochasticity’ on the same energy surface of two Hamiltonian systems [one of them that of Contopoulos et al. (1978)] was also reported by Pettini & Vulpiani (1984), who, from the very title of their paper, noted that this fact would imply a possible failure of Arnold diffusion.
Several studies of the dynamics of triaxial stellar systems noticed the presence of two types of chaotic orbits (see, e.g., Goodman & Schwarzschild 1981; Merritt & Valluri 1996), but no importance was assigned then to recognizing one from the other. Nevertheless, Muzzio (2003) reported that, in a strongly triaxial model elliptical galaxy, the orbits with only one positive Lyapunov exponent had a spatial distribution different from that of orbits with two positive exponents, dubbing them partially and fully chaotic orbits, respectively. He identified the former with the orbits that have one additional integral besides energy and the latter with those that obey the energy integral only. His results were confirmed by Muzzio & Mosquera (2004) and Muzzio et al. (2005), and the distinction between partially and fully chaotic orbits was included in all the subsequent work on triaxial stellar systems by him and his co-workers (see Carpintero & Muzzio 2016, and references therein). It should be noted that their partially chaotic and fully chaotic orbits are just the same as, respectively, the weakly chaotic and strongly chaotic orbits of Pettini & Vulpiani (1984). The change of wording was justified by Muzzio et al. (2005) because the terms weak and strong chaos had been used in connection with the maximum value of the Lyapunov exponent (Contopoulos 2002).
The phenomenon of ‘stable chaos’ in the Solar system investigated by Milani & Nobili (1992) and Milani et al. (1997) might be another astronomical example of partially chaotic motion. Although those authors only computed the largest Lyapunov exponent for the cases they considered, the fact that the size of their chaotic regions in phase space is small suggests that possibility.
Nevertheless, Froeschlé (1970a) investigated a case of the restricted three-body problem and found that, when varying one parameter, the two isolating integrals other than energy seemed to vanish at the same time, rather than one after the other. Later on, using a four-dimensional mapping, Froeschlé (1971) concluded that a system with 3 degrees of freedom has in general either none or two isolating integrals besides energy, and that the disappearance of one of those integrals entails the disappearance of the other.
Lichtenberg & Lieberman (1992) discussed the Lyapunov exponents computed by Benettin et al. (1980) for the Hamiltonian system investigated by Contopoulos et al. (1978) and raised an important point. They argued that, due to Arnold diffusion, an orbit initially in the region where Contopoulos et al. (1978) found partially chaotic orbits would end up in their region of fully chaotic orbits after a sufficiently long time. Thus, since Lyapunov exponents are computed over finite time intervals, an orbit with only one positive exponent might turn out to have two positive exponents if integrated over a long enough interval, and partially chaotic orbits found with this and similar methods might actually be fully chaotic orbits in disguise. They concluded that such methods should be supplemented by other techniques in order to clarify the true nature of the chaotic motion. Clearly, any proof obtained with numerical methods that cover a certain time interval can be regarded as valid only over that interval, and its extension to infinite time can only be obtained by analytical methods. From a practical point of view, however, a numerical proof that covers an interval much longer than the lifetime of the system investigated may be all that is needed (e.g. many Hubble times for galactic astronomy).
Since few authors have distinguished partially from fully chaotic orbits, the phenomenon of stickiness (see, e.g., Shirts & Reinhardt 1982; Menyuk 1985; Contopoulos & Harsoula 2010) is usually described as the behaviour of a chaotic orbit (either partially or fully chaotic) that remains for long intervals close to regions of regularity mimicking a regular orbit and then moves into chaotic regions showing its true nature. To that phenomenon we should add now the one indicated by Lichtenberg & Lieberman (1992), i.e. a fully chaotic orbit can remain for a long time behaving as a partially chaotic one and, later on, display its fully chaotic character. Thus, a sticky orbit can be not only a chaotic orbit that behaves as regular for a long time, but also a fully chaotic orbit that behaves as partially chaotic for a long time.
As noted by Pettini & Vulpiani (1984) and Lichtenberg & Lieberman (1992), the existence, or not, of partially chaotic orbits and Arnold diffusion are closely related, so that we will analyse that relationship in more detail. Ultimately, the basis of Arnold diffusion is the fact that a region of N dimensions (ND hereafter) can be partitioned in disjoint subregions only by objects of (N−1)D. For example, we can partition a surface (2D) using curves (1D), but not points (0D). And we can partition a 3D volume using surfaces (2D), but not curves (1D) or points (0D). Now, in an autonomous Hamiltonian system with 2 degrees of freedom, chaotic motion takes place in a 3D space (the 4D phase space minus one dimension due to the energy integral) and the tori of the regular orbits are 2D (another dimension is subtracted by the additional integral), so that chaotic orbits are constrained to regions bounded by those tori. But for autonomous systems with 3 degrees of freedom, the situation is very different. Their phase space is 6D, so that fully chaotic orbits are 5D, partially chaotic orbits are 4D and regular orbits are 3D. Clearly, the 3D orbits cannot prevent the 5D fully chaotic orbits from moving through all the space allowed to them by the energy integral (except for the 3D space occupied by the regular orbits themselves) and that is Arnold diffusion in a nutshell (a caveat is that the regular 3D tori should still remain, when they broke we have resonance superposition rather Arnold diffusion). Such a scenario is clearly altered if partially chaotic orbits actually exist because, in that case, the 3D regular orbits could limit the motion of the 4D partially chaotic orbits that, in turn, would place barriers to the motion of the 5D fully chaotic orbits.
The present paper is just a first step to try to establish whether that situation is possible. Here we show that partially chaotic orbits are present in a toy model and that they are bounded by regular orbits. We computed the six Lyapunov exponents of orbits and, besides, we used cuts and slices in the 5D space to generalize the usual Poincaré maps of the 3D space. We also made extensive use of 3D plots using colour as the fourth dimension, a technique developed by Patsis & Zachilas (1994) and extensively used later on by them and their co-workers (see, e.g., Katsanikas & Patsis 2011; Katsanikas et al. 2011, 2013), including studies of the relative location of chaotic orbits with respect to tori in 3D Hamiltonian systems. Colour and slices were also used by Richter et al. (2014) to investigate 4D symplectic maps.
Our methods cannot be easily extended to check whether fully chaotic orbits are, in turn, bounded by partially chaotic orbits, and that will be the subject of a future investigation.
The following section describes our model and the numerical techniques we used to study its orbits. The results of a search for possible partially chaotic orbits using Lyapunov exponents are presented in Section 3, where we also use the concept of the second integral to isolate one of them and, in Section 4, we show that it is actually a partially chaotic orbit bounded by regular orbits. Finally, our conclusions are presented in Section 5.
2 MODEL AND NUMERICAL METHODS
2.1 The model
This model was thoroughly investigated by Cincotta et al. (2003), and we refer the reader to that paper for full details. Here we will only mention a few properties of the model that are important for the present investigation.
2.2 Numerical methods
We explored the phase space of our model using orbits with initial coordinates x = y = z = 0 and different initial velocity components (all positive) such that u2 + v2 + w2 = 2, in order to have H = 1. In the region of the double resonance mentioned above, the interval between two crossings of the x = 0 plane is of the order of 12.6 time units (t.u. hereafter), which can be taken as a characteristic time of our investigation. To follow each orbit and at the same time compute the six Lyapunov exponents (LEs hereafter), we used the liamag routine, kindly provided by D. Pfenniger (see Udry & Pfenniger 1988). However, we replaced the original Runge–Kutta–Fehlberg subroutine by the high-order Taylor subroutine of Jorba & Zou (2005, subroutine and documentation can be obtained at http://www.maia.ub.es/∼angel/taylor/), which allowed us to perform about 50 times longer integrations, with the same precision as the original subroutine. The LEs λ1 > λ2 > … > λ5 > λ6 have the property that λi = −λ7−i, due to the conservation of the volume in phase space, and that λ3 = λ4 = 0, due to the conservation of the energy integral. Besides, each additional isolating integral makes zero another λi = −λ7−i pair so that, considering only the three largest LEs, we have that all three are zero for regular orbits, only two are zero for partially chaotic orbits, and only the third one is zero for fully chaotic orbits.
Nevertheless, the properties of the numerically computed LEs differ somewhat from those described above, because theoretical LEs are defined for an infinite time interval while the orbit integrations that allow their numerical computation are necessarily finite. Therefore, numerical LEs can tend towards zero as the integration time increases, but they remain always larger than a limiting value that can be estimated to be of the order of ln T/T, where T is the length of the integration interval. This is a coarse estimate only, and the limiting value should be determined in every case (see, e.g., Zorzi & Muzzio 2012, for details). In the present investigation, we used integration times of 5 × 10⁶, 5 × 10⁷, 5 × 10⁸ and 5 × 10⁹ t.u., and energy conservation was better than about 0.5 × 10⁻¹², 1.5 × 10⁻¹², 5.0 × 10⁻¹² and 20.0 × 10⁻¹², respectively. Notice that 5 × 10⁹ t.u. corresponds to 4 × 10⁸ characteristic times in the present investigation, while 1 Hubble time corresponds to about 200 characteristic times for the elliptical galaxies we investigated previously (see, e.g., Zorzi & Muzzio 2012), so that our longest integrations cover intervals equivalent to 2 × 10⁶ Hubble times in a galactic context.
A powerful method for the investigation of autonomous Hamiltonian systems with 2 degrees of freedom is offered by the Poincaré maps. In those systems, chaotic orbits are 3D and regular orbits 2D so that if we make a cut, e.g. requesting that x = 0 (with u > 0 to avoid the sign indetermination) and plot the resulting points on the (y, v) plane, chaotic orbits appear as surfaces and regular orbits as lines. It is tempting to try to extend this method to systems with 3 degrees of freedom where fully chaotic orbits are 5D, partially chaotic orbits 4D and regular orbits 3D: with two cuts, we could obtain plots where partially chaotic orbits would appear as surfaces and regular orbits as lines. But there are several complications on such a naive extension of the method. To begin with, while one can make a very precise first cut using the method of Hénon (1982), the second cut can only be done approximately (e.g. taking |y| ≤ 0.000 10), and that is why the method has been dubbed ‘slice cutting’ by Froeschlé (1970b). But as the width of the slice is reduced to get more accuracy in the plots, the number of points is drastically reduced so that very long integrations of the orbit are necessary to get a reasonable number of accurate points. Besides, the two cuts do not generally give a plane, as happens with the original Poincaré method, but a warped surface, because it is embedded in a 3D space rather than in the 2D space of the original method. Finally, in order to compare orbits, one has to take orbits that not only have the same energy (as in the usual 2D Poincaré maps) but also the same value of the second integral, and we have no mathematical expression for that integral. Therefore, the graphical representation and interpretation of these plots, which we will call hereafter 3D Poincaré maps, are much less straightforward than those of the original method.
Despite those difficulties, we thought that the 3D Poincaré maps might offer a useful tool to prove whether partially chaotic orbits can be bounded by regular orbits. We resorted again to the high-order Taylor routine of Jorba & Zou (2005) to make a program that allowed us to follow orbits for a long time, to do a precise first cut using the method of Hénon (1982) and a second, less precise, cut simply selecting a small range of values for another variable. Most of the results presented here correspond to a first cut taking x = 0 (with u > 0), a second cut with |y| ≤ 0.000 10 (plus v > 0) and a total integration time of about 1 × 10⁹ t.u. Energy conservation for our 3D Poincaré maps was better than 1.3 × 10⁻¹¹. The 1 × 10⁹ t.u. interval corresponds to 8 × 10⁷ characteristic times of our system so that, repeating the comparison we did above for the integration time of the LEs, we may conclude that it is equivalent to about 4 × 10⁵ Hubble times in a galactic context.
It was very important at several stages of our investigation to get a clear view of orbital structures and, for that purpose, we found very useful the technique of Patsis & Zachilas (1994), who used 3D plots plus colour to represent the fourth dimension. We have adopted their method using gnuplot (Copyright (C) 1986 - 1993, 1998, 2004, 2007 Thomas Williams, Colin Kelley) to make the plots.
As mentioned above, in 3D the cuts yield warped surfaces and not planes, so that the graphic representation of the Poincaré maps is quite a challenge. But for our purposes, the problem is simplified, because what we need to show is that the surfaces that represent the partially chaotic orbits are bounded by the lines that represent the regular orbits. Nevertheless, the separation between those orbits is very small compared with the size of the orbits themselves, so that a simple plot on, say, the (e1, e2) plane will lose all the details. After careful examination of the orbits on different projections and on 3D plots using colour as the fourth dimension (Patsis & Zachilas 1994), we adopted the following method. We chose the e1, e2 and z variables and, for an orbit selected as reference, we normalized each one of those variables subtracting the corresponding value for the centre of the orbit and dividing the result by the dispersion of the variable in question. Then we transformed that normalized coordinate system into a spherical one and, using the azimuth angle ϕ as argument, we obtained the best-fitting Fourier series for the polar angle θ and the radius r. For nearby orbits, we obtained the differences between the values of their parameters (normalized using the same centre and dispersions of the orbit taken as reference) and those given by the corresponding Fourier series, so that we have ϕ as a ‘long’ variable, and the differences between their θ and r values and the corresponding ones of the orbit taken as reference can be plotted with considerable detail.
We experimented with different numbers of terms and found that the mean square error decreased as we increased that number up to about 121 terms (that is, up to terms sin(60ϕ) and cos(60ϕ)) and reached a plateau where increasing the number of terms did not significantly decrease the mean square error any further, so that we adopted that number of terms for our computations. For slices with |y| ≤ 0.000 10, the resulting mean square errors of the e1, e2 and z variables turned to be of the order of 0.3 × 10⁻⁵, 0.5 × 10⁻⁵ and 0.4 × 10⁻⁴, respectively, which imply errors relative to the range of the corresponding variable of the order of 0.03, 0.04 and 0.005 per cent, respectively. For slices with |y| ≤ 0.000 20 and |y| ≤ 0.000 05, the errors were twice larger and one half smaller, respectively, i.e. proportional to the width of the slice as could be expected. To estimate the errors of integration, we obtained the Fourier series using only the first 20 per cent points and computed the mean square errors of the last 20 per cent points with respect to those series. The dispersions turned out to be essentially the same, so that the errors of integration should be much smaller than the dispersion caused by the slice widths.
3 PARTIALLY CHAOTIC ORBITS
The first step of our investigation was to search for possible partially chaotic orbits in regions of the phase space populated mainly by regular orbits and, as indicated above, we chose the region of the double resonance (2, −1, 0) and (0, 1, −1). We performed our search using LEs, so that the already-mentioned warning of Lichtenberg & Lieberman (1992) applies: we can never be sure that LEs obtained with longer integrations would not reveal that the partially chaotic orbits found in that way are actually fully chaotic orbits on disguise. Thus, it should be recalled that the orbits that we will refer to as partially chaotic in the present section can be regarded as such only over time intervals of the order of those covered by our numerical integrations.
3.1 The search
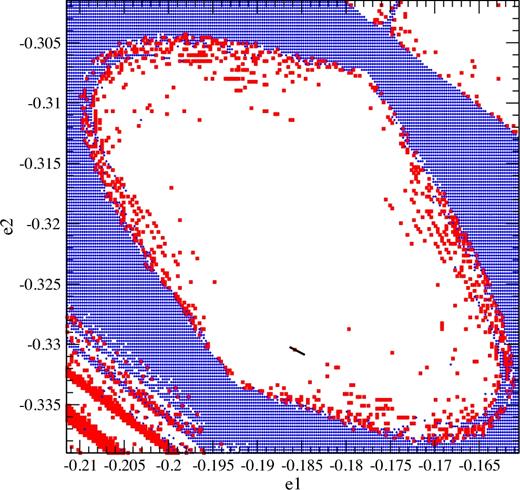
The (2, −1, 0) and (0, 1, −1) resonances of the unperturbed Hamiltonian [equation (1), with ε = 0] cross on the (e1, e2) plane at |$(-5/(11\sqrt{6}, -5/(11\sqrt{2}) \simeq (-0.185\,57, -0.321\,41)$|. Therefore, we prepared a sample of initial conditions taking H = 1, x = y = z = 0 and a grid of e1 and e2 values, with 2−12 ≃ 2.44 × 10⁻⁴ spacing, centred at that point. The advantage of taking these initial conditions is that the energy of our full Hamiltonian is the same as that of the unperturbed Hamiltonian there. Besides, as we will take cuts with x = 0 later on, the energies of the unperturbed and perturbed Hamiltonians at those cuts will again be the same, i.e. the value of the coordinate e3 will be conserved. With those initial conditions, and using the full Hamiltonian with ε = 0.005, we computed the orbits and obtained the LEs with an integration time of 5 × 10⁶ t.u., which we used to classify the orbits as regular, partially or fully chaotic. Our results are presented in Fig. 1, where we note a central region dominated by regular orbits, surrounded by another one dominated by fully chaotic ones, with most of the partially chaotic orbits lying on the border between those regions. That border is by no means clear cut and displays considerable structure but, what interests us here is that many partially chaotic orbits appear also well inside the regular domain and they even seem to form chains there. In all likelihood, they correspond to resonances.
Initial conditions on the (e1, e2) plane of orbits classified as regular, partially and fully chaotic from the values of their LEs near the double resonance (2, −1, 0) and (0, 1, −1). The blank areas correspond to regular orbits, partially chaotic orbits are shown as filled squares (red in the electronic version) and fully chaotic orbits as plus signs (blue in the electronic version). The short black line shows the region covered by Fig. 2. (A colour version of this figure is available in the online version.)
Three sectors of one of those chains are shown in Fig. 2, which was obtained in the same way as Fig. 1, but with a much finer grid spacing of 2−17 ≃ 7.63 × 10⁻⁶. The same region is shown by a short black line in Fig. 1. The chain extends continuously in between the sectors shown and beyond the third one, but it seems on the verge of disappearance on the first sector and probably it does not extend much further in that direction. Several of the partially chaotic orbits found here were followed with integrations of 5 × 10⁷, 5 × 10⁸ and 5 × 10⁹ t.u. and their LEs were computed, and in all cases they continued to appear as partially chaotic.
High-resolution plots of small sections of Fig. 1. Regular orbits are shown as crosses and partially chaotic orbits as filled squares.
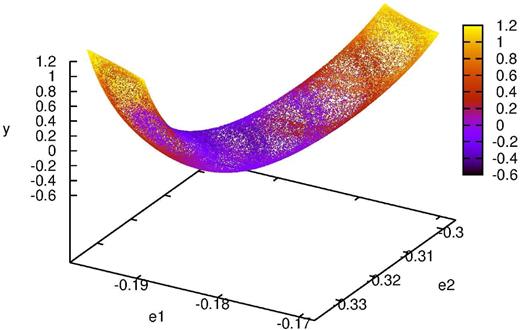
Fig. 3 shows, in the 3D space (e1, e2, y) and using colour to represent the fourth dimension z, the cut x = 0(u > 0) of the orbit whose initial condition lies on e1 = −0.184 903 65 and e2 = −0.330 786 44 and that we will dub pch hereafter; it was obtained with an integration over 1. × 1010 t.u. This is one of the partially chaotic orbits that lie on the chain shown in Fig. 2, and the form of the cut reminds that of a croissant. Some mixing of the colours might be present, a characteristic of chaotic orbits in this sort of plot as indicated by Patsis & Zachilas (1994) but, if it exists, it is far from clear. In fact, except perhaps for the colour distribution, similar plots for other orbits from the same region, either regular or partially chaotic, look very much the same. Thus, while Fig. 3 is useful to show us the general aspect of these orbits, we need more precise ways to proceed with our investigation. As indicated above, the croissant is approximately symmetric with respect to a plane normal to the (e1, e2) plane and parallel to the line drawn on the latter plane by the (0, 1, −1) resonance.
A cut with the plane x = 0 (u > 0) of a partially chaotic orbit from the chain shown in Fig. 2. It is shown in the 3D space (e1, e2, y) with the fourth dimension z given by the colour scale in the electronic version. (A colour version of this figure is available in the online version.)
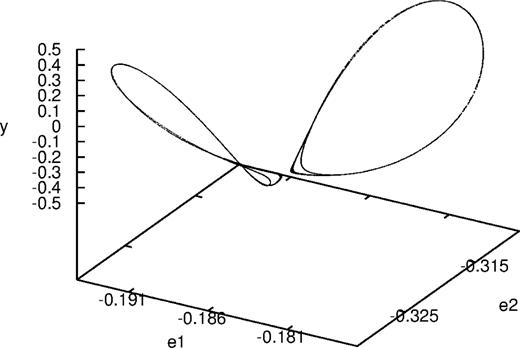
Fig. 4 shows the result of taking a slice |y| ≤ 0.000 10(v > 0) from the x cut of Fig. 3 in the 3D space (e1, e2, z). As anticipated, the points lie on a warped surface (actually, it has a very small width because there is a finite range of y values) and not on a plane. There are two separate lobes that correspond to the two slices taken from the croissant by the slice |y| ≤ 0.000 10 (compare with Fig. 3). For the time being, we will concentrate on the lobe that corresponds to the larger values of e1 and e2.
A slice |y| ≤ 0.000 10 (v > 0) of the cut of Fig. 3 in the 3D space (e1, e2, z).
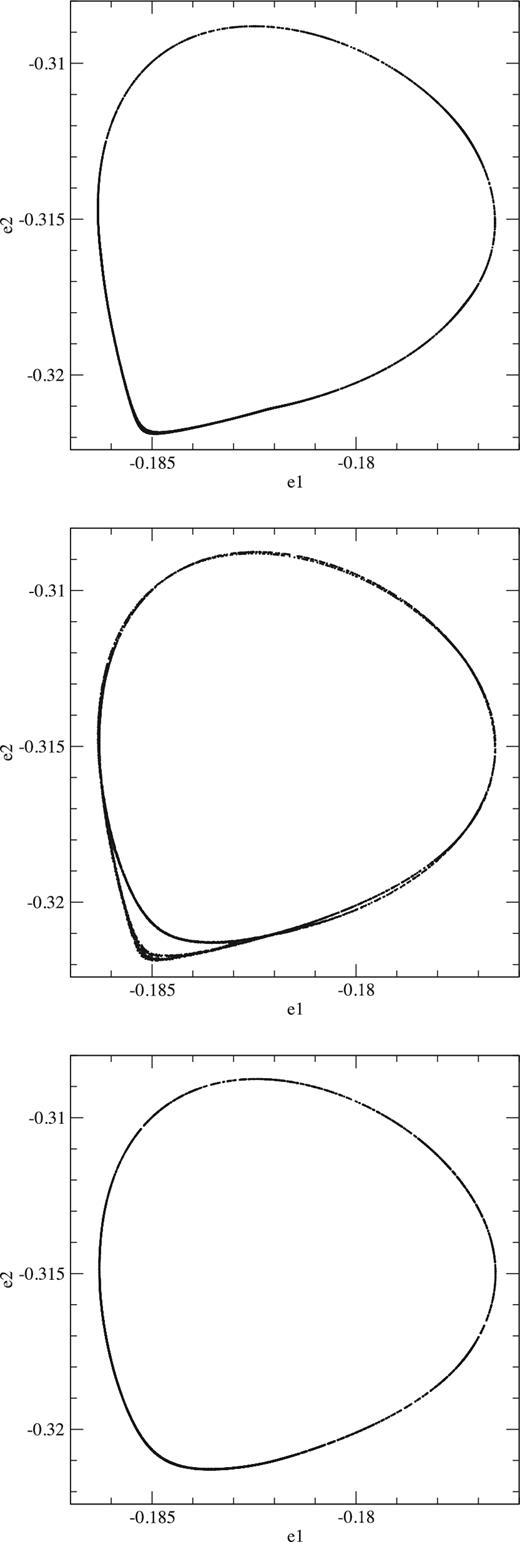
Fig. 5 shows the projections of that lobe on the (e1, e2) plane, for the same partially chaotic orbit of the previous two figures, and for two regular orbits with initial conditions e1 = −0.184 892 701, e2 = −0.330 778 44 (r1 hereafter) and e1 = −0.184 908 51 and e2 = −0.330 792 72 (r2 hereafter), respectively, which lie each one on each side of the partially chaotic lane of Fig. 2. We notice that the partially chaotic orbit is double and, as we will see later, it is not just a double loop but the two parts cross themselves, i.e. it bifurcates and that is the cause of its chaoticity. One can already note that the outer tip of the orbit near e1 = −0.1852 and e2 = −0.3218 is thicker than the neighbouring inner tip, and the reason is that the former is a surface and not a line, as we will see later on. Interestingly, each one of the two regular orbits is similar to each one of the two parts of the regular orbit. In other words, the lane of partially chaotic orbits shown in Fig. 2 is a transition zone from regular orbits similar to r1 to regular orbits similar to r2. Thus, it seems reasonable to assume that the 4D partially chaotic orbits of that lane are bounded by the 3D tori of the regular orbits that border the lane and, in terms of Fig. 3, we could expect the 3D croissant of a partially chaotic orbit to be bounded by 2D croissants of regular orbits. Let us explore how to check that possibility.
Projections on the (e1, e2) plane of the cuts x = 0(u > 0) and |y| ≤ 0.000 10(v > 0) of the orbits r1 (top), pch (centre) and r2 (bottom).
3.2 The second integral of motion
As we mentioned above, for our 3D Poincaré maps we have to select orbits with the same value of the energy and the same value of the second integral, but the problem is that we do not know the mathematical expression of that second integral. Since the initial conditions we used to map the unperturbed energy plane had all the same energy and x = y = z = 0, Fig. 2 is, except for the fact that it includes orbits with different values of the second integral, a kind of Poincaré map resulting from the three cuts x = 0, y = 0 and z = 0, so that every partially chaotic orbit should appear there are as a 1D curve. Therefore, the lane of partially chaotic orbits in Fig. 2 can be seen as the surface that results from the superposition of the curves corresponding to partially chaotic orbits with different values of the second integral. Our problem is, thus, to identify the individual curves that make up that surface. A simple idea would be to follow a single partially chaotic orbit and to take a third cut, or slice, z ≃ 0 in addition to x = 0 and y ≃ 0, but it fails because it is impossible to get a reasonable number of points with sufficient accuracy: if one uses small widths for the y and z slices, one gets almost no points, and if one increases those widths to get enough points, they appear distributed on a surface rather than on a line. Another simple idea, to take the points that result from the x = 0 and y ≃ 0 cuts and lie near z = 0, to fit them to a surface and to determine the intersection of that surface with the plane z = 0 also fails for similar reasons, plus the fact that the surface in question is warped and difficult to adjust. Finally, we reasoned that the points in Fig. 2 are all very accurate, because the initial conditions of the corresponding orbits had been selected by ourselves, so that what we had to do was to determine which points of the partially chaotic lane corresponded to the same orbit, i.e. we had to find which initial conditions gave the same distribution of points resulting from the x = 0 and y ≃ 0 cuts.
The first step to that approach was to find a suitable sector of the partially chaotic orbits to do the comparison, and the tip near e1 = −0.1852 and e2 = −0.3218 (see Fig. 5) was an obvious choice. In 3D plots in the (ep, en, z) space [see equations (9) and (10)], it looks like a half cylinder with its axis lying on the (en = −0.000 55, z) plane. The z height of its minimum turned out to be highly dependent on the orbit in question, so that we decided to take a slice of 0.000 10 width around en = −0.000 55, plus similar slices around en = −0.000 45 and −0.000 35 as additional aid.
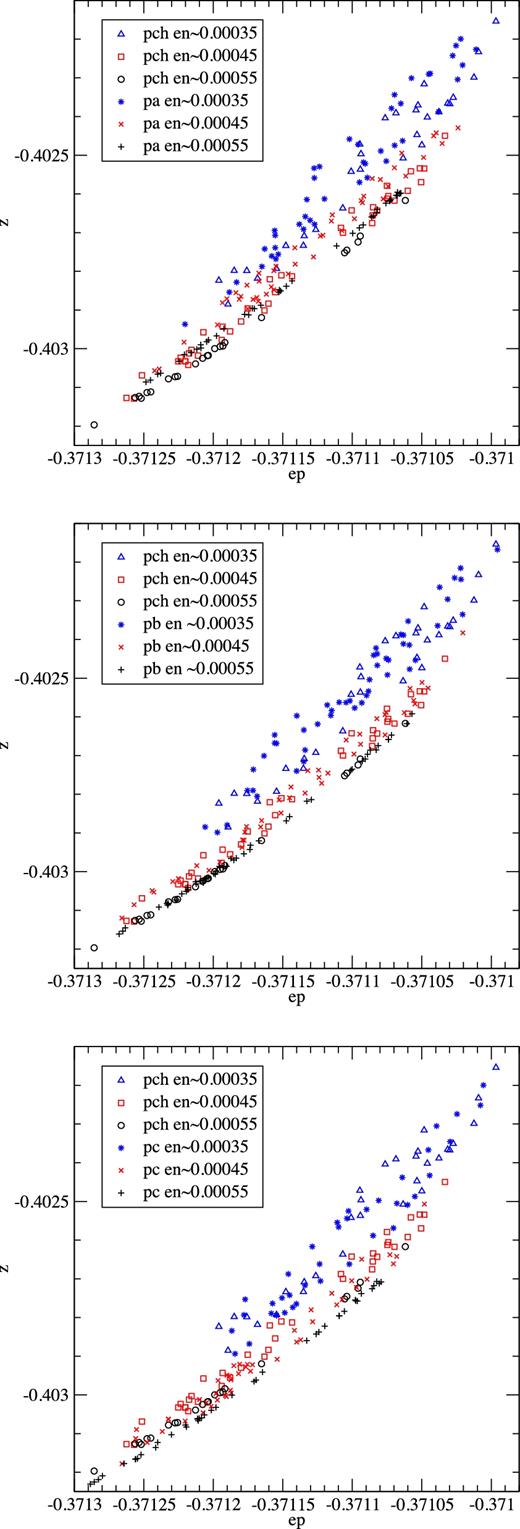
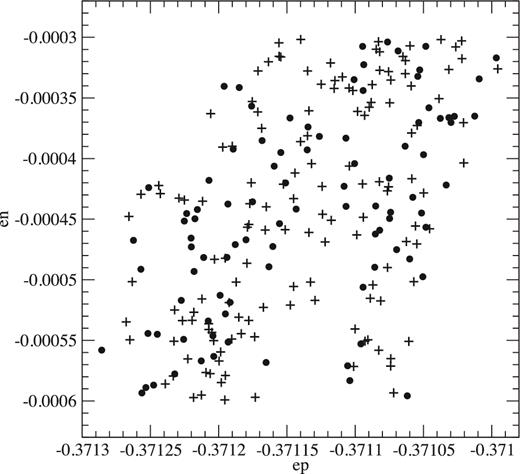
Fig. 6 shows the results for the partially chaotic orbit pch from Figs 3–5 together with three other partially chaotic orbits from the lane shown in Figs 2: pa (top) with initial conditions at e1 = −0.184 898 18 and e2 = −0.330 780 78, pb (centre) with initial conditions at e1 = −0.184 897 36 and e2 = −0.330 781 26 and pc (bottom) with initial conditions at e1 = −0.184 896 53 and e2 = −0.330 781 74. Despite the very small differences among the initial conditions, it is clear that orbits pa and pc are not the same as orbit pch, while orbit pb coincides perfectly well with it. Fig. 7 shows the projections of orbits pch and pb on the (ep, en) plane confirming the excellent fit.
Projections on the (ep, z) plane of slices around en = −0.000 55, −0.000 45 (red in the electronic version) and −0.000 35 (blue in the electronic version) of the cuts x = 0(u > 0) and |y| ≤ 0.000 10(v > 0) of the orbit pch, together with those of the orbits pa (top), pb (centre) and pc (bottom). (A colour version of this figure is available in the online version.)
Projections on the (ep, en) plane of the cuts x = 0(u > 0) and |y| ≤ 0.000 10(v > 0) of the orbits pch (filled circles) and pb (plus signs).
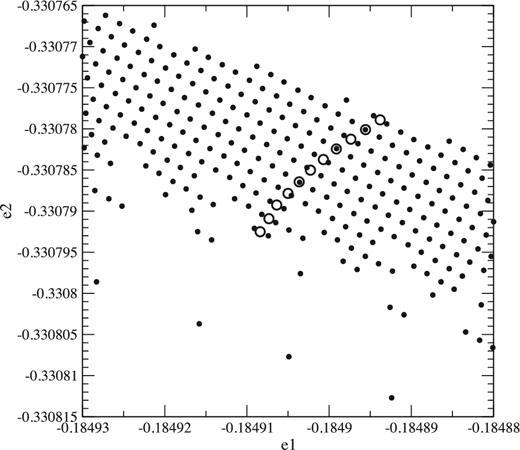
Then we prepared a plot of the initial conditions on the (e1, e2) plane that produce regular and partially chaotic orbits, similar to those of Fig. 2 but with a finer grid spacing of 2−19 ≃ 1.91 × 10⁻⁶ and with the grid tilted 60° to follow better the direction of the partially chaotic lane. It is shown in Fig. 8 with blank spaces for the regular orbits and filled small circles for the partially chaotic ones. Taking the results of orbit pch as reference, we prepared plots similar to those of Fig. 6 for partially chaotic orbits with the initial conditions of nearby points on the (e1, e2) plane and used them to select the initial conditions that provided good fits. In several instances, the points from the grid did not give a good enough fit, and we used additional points interpolated between those that gave results above and below those of orbit pch. It was hard work, indeed, because for each (e1, e2) point we had to compute the orbit and the x = 0, y ≃ 0 cuts, do the plots and examine them by eye, but the results were excellent and are shown as big open circles in Fig. 8. Those open circles correspond all to one single partially chaotic orbit and, therefore, they trace the line along which the second integral is constant.
Initial conditions on the (e1, e2) plane of orbits subsequently classified as regular (blank space) or partially chaotic (small filled circles). The large open circles correspond all to the same partially chaotic orbit; see the text for explanation.
4 BOUNDING REGULAR ORBITS
4.1 Finding the boundaries
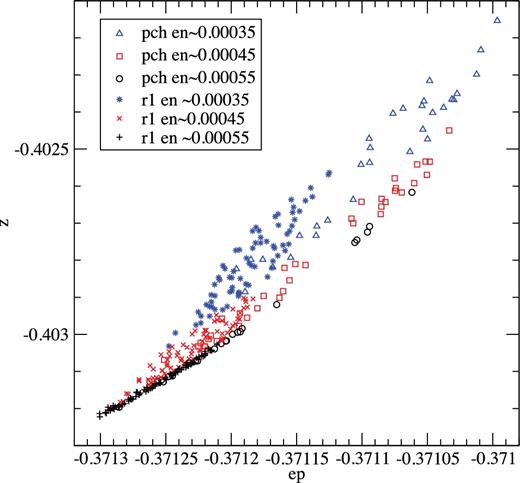
It seems natural to try to extend the method we used to find the trace of the second integral of a partially chaotic orbit to search for the regular orbits that have the same value of that integral and, therefore, bound that orbit. For that purpose, we selected from our grid on the (e1, e2) plane points that corresponded to regular orbits and were located near the extrapolation of the line we had found for the second integral. Taking again the partially chaotic orbit pch as reference, we used plots like the one shown in Fig. 9 to find which regular orbits offered the best extrapolation to the results of pch. In that way, we selected the orbit r1 shown in that figure (see also Fig. 5). Of course, since the tori of the regular orbits that have the same values of the energy and of the second integral fit one inside the other like Russian dolls, many can be found and orbit r1 is just one reasonable choice among other possible ones.
Same as Fig. 6, but for partially chaotic orbit pch and regular orbit r1.
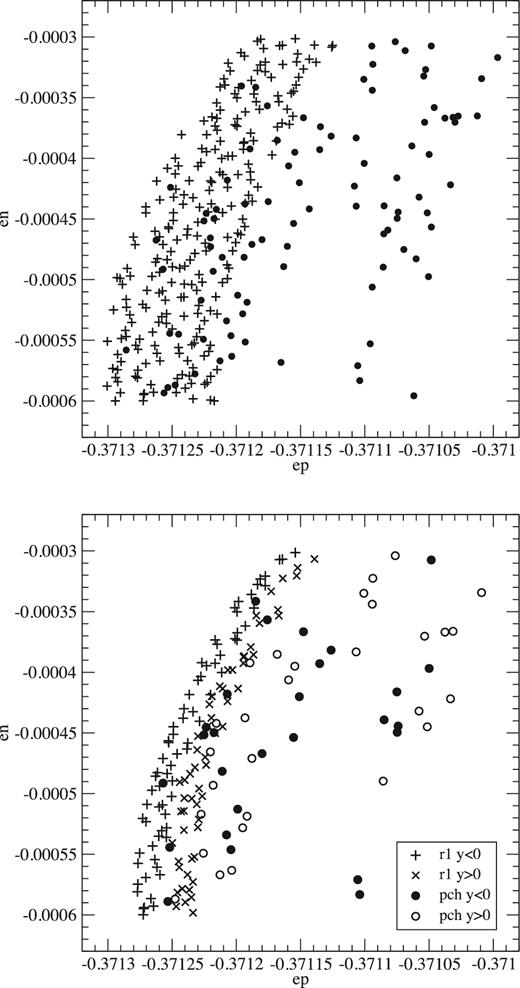
Fig. 10 shows the projection of the same orbits pch and r1 on the (ep, en) plane, and one can notice again the good fit. The upper part of the figure was obtained with a slice |y| ≤ 0.000 10(v > 0), as used for all the previous figures, and the lower part with a slice |y| ≤ 0.000 05(v > 0). Clearly, the reduced slice width reduces almost in half the width of the band occupied by the regular orbit, as could be expected since for y = 0 we should get a line. But the global width of the region occupied by the partially chaotic orbit is only slightly reduced, as should happen because for y = 0 we should get a surface. Besides, we note that for the regular orbit the points with y < 0 are clearly separated from those with y > 0, the former lying towards the left and the latter towards the right, further proof that the width of the band of r1 points is essentially due to the width of the y slice. Moreover, we note that for the partially chaotic orbit the points with positive and negative values of y appear mixed, as they should because such an orbit lacks the second isolating integral besides energy that has the regular orbit. Nevertheless, the effect of the width of the y slice can also be noticed for orbit pch because its points that lie on the extreme left have y < 0 and those that lie on the extreme right have y > 0. Last but not least, it is clear that the apparent overlap of the r1 and pch orbits in Figs 9 and 10 is only apparent and just caused by the thickness of the y slice.
Projections on the (ep, en) plane of the cuts x = 0(u > 0) and |y| ≤ 0.000 10(v > 0) (top) and |y| ≤ 0.000 05(v > 0) (bottom) of the orbits r1 (crosses) and pch (circles).
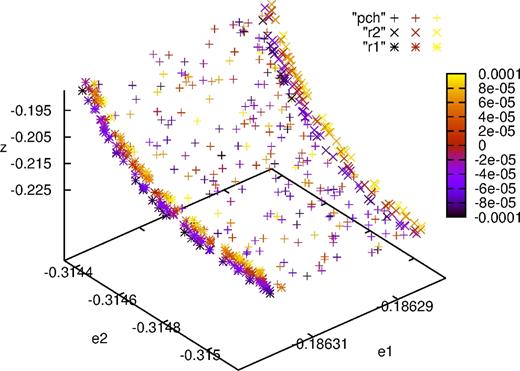
Unfortunately, one cannot apply the same procedure to find the bounding regular orbits below the partially chaotic lane because regular orbits there lack the tip near e1 = −0.1852 and e2 = −0.3218 (see Fig. 5), so that we had to look for another region of the partially chaotic orbit where the x and y cuts yielded a suitable surface. The bifurcation regions seemed an obvious choice, and Fig. 11 shows one of those regions of orbit pc together with the adjacent regions of regular orbits r1 and r2. We had found r1 as described above, and we found r2 searching for another good boundary in the way we describe below. The plot presents the cut x = 0 (u > 0) and |y| ≤ 0.000 10(v > 0) in the (e1, e2, z) space and using colour for the fourth dimension y. We note that, as indicated by Patsis & Zachilas (1994), the colours appear mixed on the surface that corresponds to the partially chaotic orbit because, since one integral of motion is lacking, y is not correlated to the other variables. For the regular orbits, instead, there is a clear progression from negative values of y at left and below to positive values at right and above, i.e. these orbits are, as they should, lines and their thickness is only due to the width of the y slice.
One of the bifurcation zones of the partially chaotic orbit pch together with the nearby sections of regular orbits r1 and r2. We show the result of cuts x = 0 (u > 0) and |y| ≤ 0.000 10(v > 0) in the (e1, e2, z) space and using colour for the fourth dimension y in the electronic version. (A colour version of this figure is available in the online version.)
The form of the partially chaotic surface resembles again that of a half cylinder, so that we might proceed in a similar way as we did to find the bounding orbit r1. But, in that case, the sector of the partially chaotic surface was oriented in the (ep, en, z) space in a way that facilitated our purposes. In the present case, we need to find a system of coordinates that allows us to see part of the cylinder edge on so as to be able to select an adequate bounding orbit as the limit of that edge. We found that three rotations were necessary: (1) one of an angle θ around the z axis, to bring the (e1, e2, z) system to a new (d1, d2, z) system; (2) a second one of an angle ψ around the d1 axis to bring the latter to the (g1, g2, d1) system; (3) a final one of an angle τ around the g2 axis to obtain the (q1, q2, g2) system. We took the points of the orbit pch shown in Fig. 11 and, for different trial values of θ, we determined the ψ and τ angles that aligned the region covered by those points with the d2 and z axes and with the g1 and d1 axes, respectively, and we computed the z thickness of the (d2, z) projection. Finally, we adopted the angles that minimized that thickness, which turned out to be θ = 43|$_{.}^{\circ}$|60, ψ = 89|$_{.}^{\circ}$|21 and τ = 89|$_{.}^{\circ}$|25. It is quite possible that other systems of coordinates might be used for the same purpose, but the one described worked well and that was all we needed here. To search for the regular orbit that bounded the partially chaotic orbit pch, we used plots on the (q2, g2) and the (q2, q1) planes; in the first case, we plotted separately the points within the slices (−0.235 < q1 < −0.228), (−0.228 < q1 < −0.221) and (−0.221 < q1 < −0.214), in a similar way as we had done to search for the limiting regular orbit r1 on the other side of the partially chaotic lane.
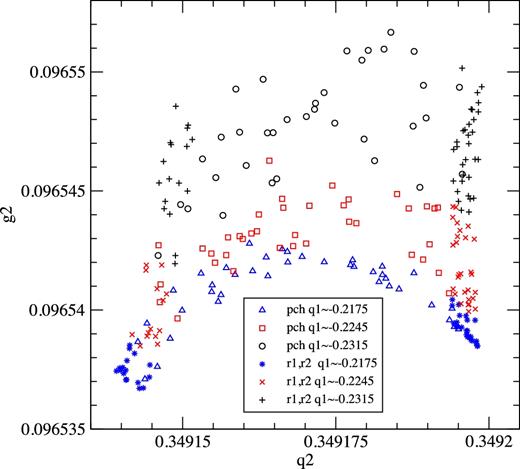
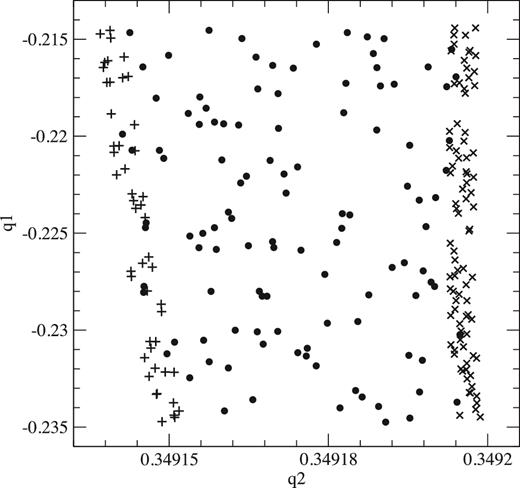
Fig. 12 shows the diagram we used to select regular orbit r2 as the boundary to partially chaotic orbit pch and we have included also orbit r1, which provides the other boundary. While r2 was found searching for a good boundary to the surface shown in the figure, r1 had been found from fits to a completely different region of the partially chaotic orbit, so that its excellent agreement with this new region gives a strong support to our method. Fig. 13 shows the projection on the (q2, q1) plane confirming our results.
Projection on the (q2, g2) plane of slices around q1 ≃ −0.2175 (blue in the electronic version), −0.2245 (red in the electronic version) and −0.2315 of the cuts x = 0(u > 0) and |y| ≤ 0.000 10(v > 0) of the partially chaotic orbit pch and of regular orbits r1 (right) and r2 (left). (A colour version of this figure is available in the online version.)
Projection on the (q2, q1) plane of the cuts x = 0(u > 0) and |y| ≤ 0.000 10(v > 0) of the partially chaotic orbit pch (filled circles) and the regular orbits r1 (crosses) and r2 (plus signs).
4.2 3D Poincaré maps
We adopted as our reference orbit the upper-right lobe that results from the cuts x(u > 0) and |y| ≤ 0.000 05(v > 0) of orbit r2, and we computed the mean values (〈e1〉, 〈e2〉 and 〈z〉) and the dispersions (σ1, σ2 and σz), of its e1, e2 and z values. Adopting those mean values as the centre of the orbit, we computed the normalized values (e1 − 〈e1〉)/σ1, (e1 − 〈e1〉)/σ1 and (z − 〈z〉)/σz and used these normalized values to define a new spherical system of coordinates, with azimuth angle ϕ, polar angle θ and radius r. Then, taking ϕ as argument, we adjusted each normalized coordinate with a Fourier series and we used them to iteratively improve the centre of the orbit. Finally, we obtained new Fourier series to represent θ and r as functions of ϕ. The differences between the true values and those given by the series, i.e. the residuals, were used to represent orbit r2 in our 3D Poincaré maps, that is, straight lines with some dispersion through θ = 0 and r = 0, respectively.
For other orbits, we normalized their e1, e2 and z values using the same centre and dispersions adopted for the r2 orbit and obtained the corresponding ϕ, θ and r values. Finally, using their ϕ values as argument of the Fourier series obtained for r2, we obtained the differences between their θ and r values and those given by the series. In other words, our 3D Poincaré maps are just the differences between each orbit and r2, so that we can clearly represent those small differences as we follow the orbit through all the different azimuth angles.
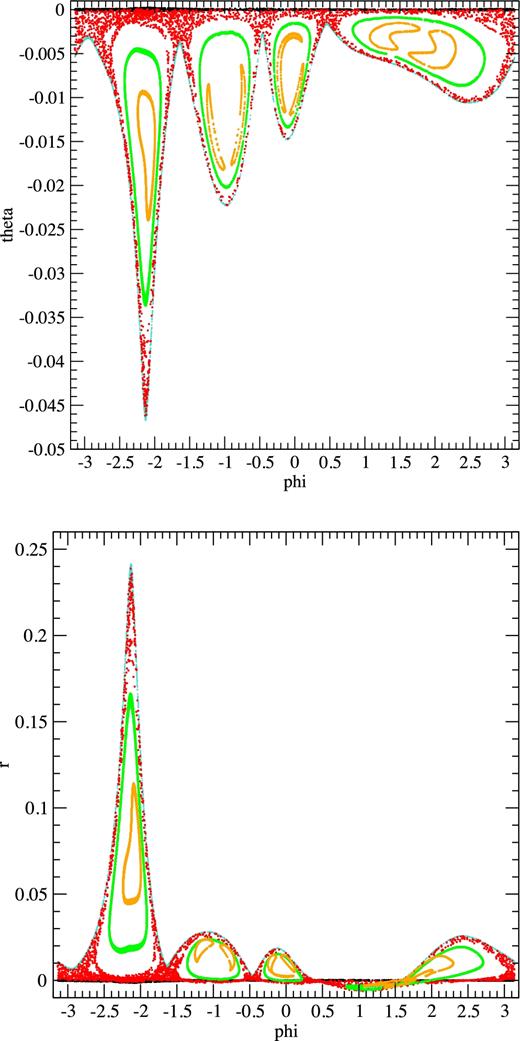
Fig. 14 presents the result. Besides the partially chaotic orbit pch (red dots in the electronic version) and the bounding orbits r1 (turquoise dots in the electronic version) and r2 (black dots), we included regular orbits r3 (green dots in the electronic version) and r4 (orange dots in the electronic version) that lie in the main holes of the partially chaotic orbit. r3 and r4 were found interpolating values within those holes, and have initial condition x = 0, plus e1 = −0.186 370 00, e2 = −0.319 920 00, y = −0.397 200 00, z = 0 for r3 and e1 = −0.185 280 00, e2 = −0.323 720 00, y = 0, z = −0.394 980 00 for r4. As those orbits have velocities of opposite signs in alternate holes, in this case the conditions u > 0, at the x cut, and v > 0, at the y cut, were not applied. The fact that they are regular orbits is supported not only because they appear as lines on the Poincaré map, but also by computations of their LEs. We even found a regular orbit that lies in the smaller holes of the partially chaotic orbit, with initial conditions x = 0, y = 0, z = −0.402 825 00, e1 = −0.185 100 00, e2 = −0.321 681 00, but we preferred not to include it in the figure in order that those smaller holes could be better seen. One should recall that we are dealing with warped surfaces and not with planes, and that is the reason why some orbits seem to cross on the (ϕ, r) plot, but there are no crossings on the (ϕ, θ) plot and, therefore, neither are there in space. Except for that caveat, there are no significant differences between our plots, particularly the (ϕ, θ) plot, and a standard Poincaré map for an autonomous Hamiltonian with 2 degrees of freedom: the partially chaotic orbit pch occupies a surface and is bounded by the lines that represent the regular orbits r1 and r2; besides, it has holes where other regular orbits lie.
3D Poincaré maps (ϕ, θ) (top) and (ϕ, r) (bottom) of orbits r1 (turquoise in the electronic version), r2, pch (red in the electronic version), r3 (green in the electronic version) and r4 (orange in the electronic version). They correspond to the x = 0 (u > 0) and |y| ≤ 0.000 05(v > 0) cuts and to the right lobe. The ordinates give the differences between the values of θ and r, respectively, of each orbit and those given by the Fourier series fitted to the corresponding values of orbit r2. See the text for explanation. (A colour version of this figure is available in the online version.)
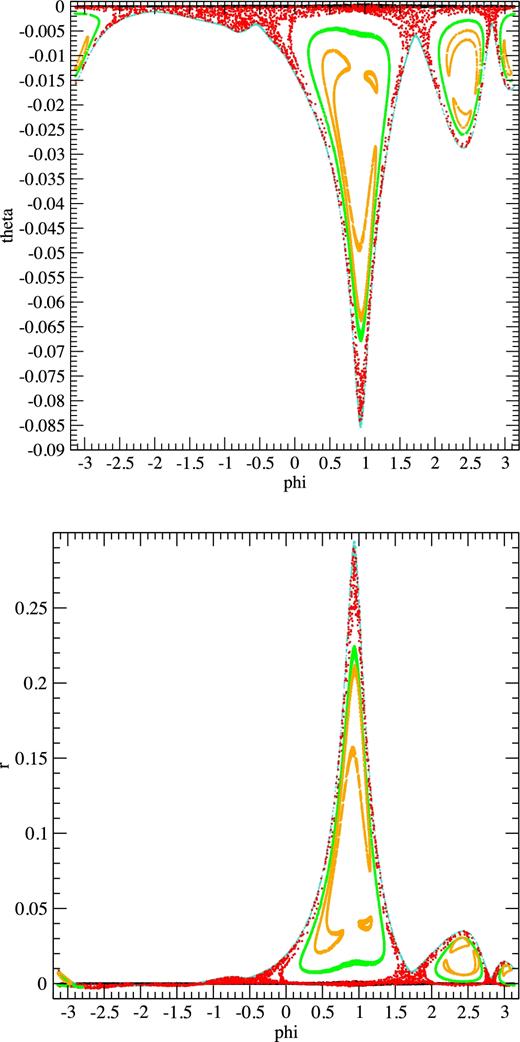
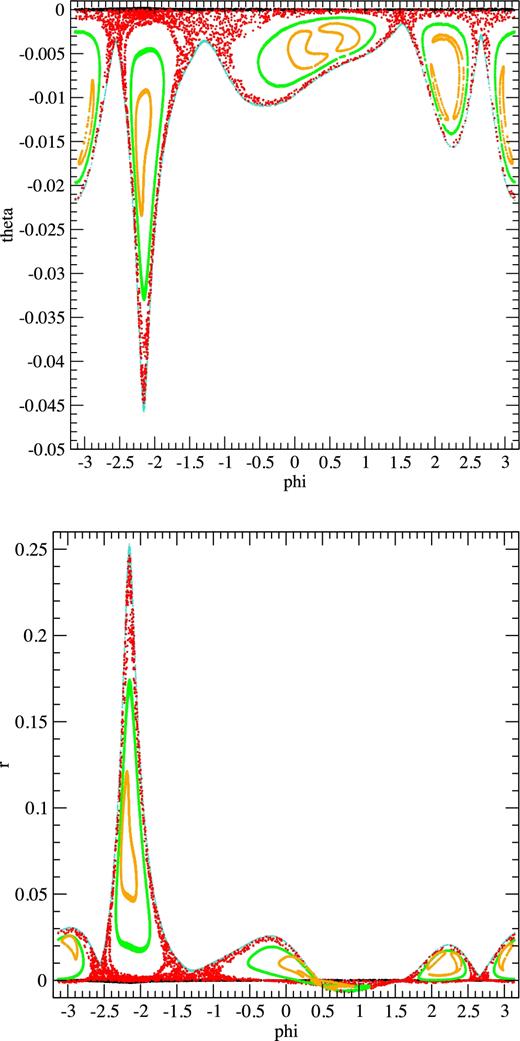
It is remarkable that, although we found the bounding regular orbits r1 and r2 using only fits to very small sections of those orbits and of the partially chaotic orbit pch, we find now a perfect match to the whole orbits, but there is still more. Fig. 15 is similar to the previous one, but it corresponds to the left lobe, i.e. the one that had not been used at all to find r1 and r2. Again, it is very similar to ordinary Poincaré maps, with the partially chaotic orbit pch bounded by the regular orbits r1 and r2 and with a hole that contains the regular orbits r3 and r4. Finally, Fig. 16 presents again results for the right lobe, but this time they come from the cuts x(u > 0) and |z| ≤ 0.000 05(w > 0), i.e. using z instead of y and, once again, different from the cuts used to find r1 and r2. The conclusion that pch is a partially chaotic orbit bounded by regular orbits r1 and r2 seems therefore unavoidable, but it should be recalled that it is valid over time intervals of the order of that covered by our numerical integrations.
Same as Fig. 14, but for the cuts x = 0 (u > 0) and |z| ≤ 0.000 05(w > 0).
5 CONCLUSIONS
We have found a group of partially chaotic orbits immersed in the mostly regular domain around the double resonance (2, −1, 0) and (0, 1, −1) of the unperturbed Hamiltonian 1. They are double orbits joined by a bifurcation that is the likely cause of their chaotic nature. Those orbits, all with initial conditions with x = y = z = 0, occupy a lane on the (e1, e2) plane, sections of which are shown in Fig. 2. That lane is, therefore, made up of the 1D curves that result from cutting 4D partially chaotic orbits with the planes x = 0, y = 0 and z = 0, and we could identify one of those curves, corresponding to our orbit pch and shown in Fig. 8. Moreover, a 4D partially chaotic orbit can be bounded by 3D regular orbits, and we found two such bounding orbits, r1 and r2, in Section 4.1. Finally, in Section 4.2, we presented 3D Poincaré maps that (1) are very similar to the usual Poincaré maps for autonomous Hamiltonians with 2 degrees of freedom; (2) show that the partially chaotic orbit pch is actually bounded by the regular orbits r1 and r2; (3) show that, as in some 2D cases, the partially chaotic orbit has holes that contain additional regular orbits. In brief, we have made up a strong case for the existence of partially chaotic orbits in cocoons well isolated from the Arnold web by the regular orbits. Our conclusions are supported by numerical integrations and, therefore, are valid over time intervals of the order of those covered by the integrations, but for elliptical galaxies those intervals are equivalent to about one million Hubble times, i.e. much longer than the galactic lifetimes.
An important by-product of our work is that, despite the difficulties to extend to 3D the use of the Poincaré maps, we have shown that it is possible and, actually, 3D Poincaré maps were a very important tool for the present investigation.
We have already noted that other chains of probably partially chaotic orbits can be seen in our Fig. 1, in the region of the double resonance (2, −1, 0) and (0, 1, −1), so that the example shown here does not seem to be just a rara avis. Moreover, we have found similar lanes of probably partially chaotic orbits near other double resonances of the same Hamiltonian investigated here, e.g. near e1 = 0.352 773 69 and e2 = −0.349 759 17 in the region of the double resonance (2, −3, 0) and (4, 0, −3). Nevertheless, the structure of those orbits is different from that of the simple croissants studied here, and to prove that they are actually partially chaotic will demand a whole new investigation.
Of course, the big prize would be to show that partially chaotic orbits bound fully chaotic ones, placing even more significant limits to chaotic diffusion. But it is hopeless to try to do that by simply extending the same techniques used here. In order to get a significant number of points, our 3D maps demand much longer integration times than the regular 2D ones and, to make one additional cut (say, x = y = z = 0), will require prohibitively longer numerical integrations. Besides, there is another limitation: we know from theory that regular orbits are tori and, therefore, that they can bound partially chaotic orbits, but we do not know whether the latter are closed surfaces or not and, therefore, we do not know whether they can actually bound fully chaotic orbits. Nevertheless, partially chaotic orbits, having only one dimension less than fully chaotic ones, can at least pose some barriers to the latter and, therefore, they might be a factor to be taken into account in studies of chaotic diffusion. Therefore, we plan to continue investigating this subject.
Acknowledgements
We are very grateful to A. Jorba, M. Zou and D. Pfenniger for the use their codes, and to D. D. Carpintero, R. E. Martínez (sadly, recently deceased), M. E. Muzzio, P. Santamaría, H. R. Viturro and F. C. Wachlin for their assistance. Special thanks go to an anonymous reviewer whose suggestions were very useful to improve the original version of the present paper. This work was supported with grants from the Consejo Nacional de Investigaciones Científicas y Técnicas de la República Argentina, the Agencia Nacional de Promoción Científica y Tecnológica and the Universidad Nacional de La Plata.
Actually, if two resonant conditions are fulfilled, any linear combination of them is fulfilled too, so that we have an infinite number of resonances. For simplicity, however, we will refer to that condition as a double resonance.
REFERENCES


