


Abstract
We present high-sensitivity eMERLIN radio images of the Seyfert galaxy NGC 4151 at 1.51 GHz. We compare the new eMERLIN images to those from archival MERLIN observations in 1993 to determine the change in jet morphology in the 22 yr between observations. We report an increase by almost a factor of 2 in the peak flux density of the central core component, C4, thought to host the black hole, but a probable decrease in some other components, possibly due to adiabatic expansion. The core flux increase indicates an active galactic nucleus (AGN) that is currently active and feeding the jet. We detect no significant motion in 22 yr between C4 and the component C3, which is unresolved in the eMERLIN image. We present a spectral index image made within the 512 MHz band of the 1.51 GHz observations. The spectrum of the core, C4, is flatter than that of other components further out in the jet. We use HST emission-line images (H α, [O iii] and [O ii]) to study the connection between the jet and the emission-line region. Based on the changing emission-line ratios away from the core and comparison with the eMERLIN radio jet, we conclude that photoionization from the central AGN is responsible for the observed emission-line properties further than 4 arcsec (360 pc) from the core, C4. Within this region, a body of evidence (radio-line co-spatiality, low [O iii]/H α and estimated fast shocks) suggests additional ionization from the jet.
1 INTRODUCTION
At the centre of every galaxy is thought to lie a super-massive black hole (SMBH) (Magorrian et al. 1998; Ferrarese & Merritt 2000; Gebhardt et al. 2000). Broad-band emission from SMBHs is observed from the X-ray through to the radio regime. When they accrete matter, they turn into active galactic nuclei (AGN) (Ho 2008). Most of the AGN in the local Universe are radio-quiet, defined by Terashima & Wilson (2003) as those where the logarithm of the ratio of the radio (5 GHz) to X-ray (2−10 keV) luminosity, denoted log(RX), is ≥ −4.5. Kilo-parsec radio jets are seen in such AGN (Condon 1987; Ulvestad 2003; Ghisellini, Haardt & Matt 2004). Radio variability has been detected in the nuclei of some such AGN, e.g. Wrobel (2000); Mundell et al. (2009) though not in others, e.g. Jones et al. (2011), Jones, McHardy & Maccarone (2017). However temporal studies of larger scale jets in radio-quiet AGN are rare due to their intrinsic radio weakness. Thus, changes in jet morphology that might indicate jet motion or regions of particle acceleration cannot be measured. One exception is the jet in the well-known Seyfert 1.5 NGC 4151. It is one of the brightest AGN in the sky in X-rays (Gursky et al. 1971; Boksenberg et al. 1995; Ogle et al. 2000; Wang et al. 2010, 2011b) and the radio-brightest of the radio-quiet AGN (Zdziarski, Poutanen & Johnson 2000). As such, it is a great probe of the intermediate regime of radio-loudness to explore the mechanisms of jet propagation through the interstellar medium (ISM). NGC 4151 is a nearly face-on (i ≈ 21°) barred spiral galaxy. It has one of the most precise distance measurements of an AGN to date, due to dust-parallax measurements, of 19 Mpc (Hönig et al. 2014). This corresponds to an angular scale of ∼91 pc arcsec−1.
NGC 4151 has been extensively studied in the radio for several decades (Booler, Pedlar & Davies 1982; Johnston et al. 1982; Wilson & Ulvestad 1982; Harrison et al. 1986; Carral, Turner & Ho 1990; Pedlar et al. 1993; Mundell et al. 1995; Ulvestad et al. 1998; Mundell et al. 2003; Ulvestad et al. 2005). The radio structure is characterized by a double-sided jet at PA ∼ 77° extending from a nucleus with VLBI centre at |$\alpha _{J2000}=12^{\rm h}\, 10^{\rm m}\, 32{^{\rm m}_{.}}5758$| and δJ2000 = +39d 24m |$21{^{\rm s}_{.}}060$| (Ulvestad et al. 2005). Archival VLA/MERLIN observations (Carral et al. 1990; Pedlar et al. 1993; Mundell et al. 1995) detect six radio components along this structure named C1 to C6 with the naming convention going from west to east. Further resolved components were discovered with VLBA/VLBI images by Ulvestad et al. (2005), who renamed the components A to I (Fig. 1). Throughout this paper, we shall use the original C1–C6 nomenclature, unless specified otherwise. The core radio component (named C4) is co-incident with the optical nucleus in Mundell et al. (1995) (hereafter referred to as M95), leading to its identification as the AGN. Here, we present deep 1.51-GHz observations with the upgraded eMERLIN radio interferometer allowing, by comparison with M95, study of changes in the jet morphology over a 22-yr period.
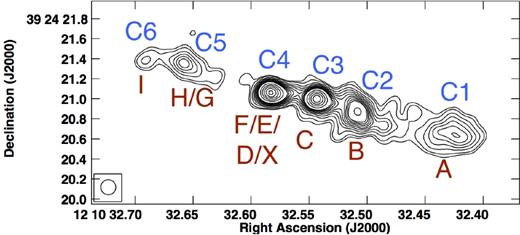
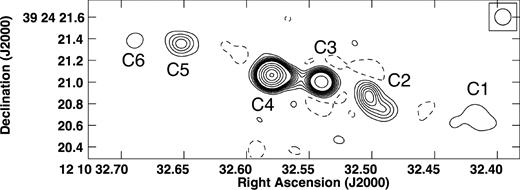
Naturally weighted archival MERLIN image of the central, 4 × 2 arcsec2 (∼360 × 180 pc2) radio structures of NGC 4151, re-reduced with the MERLIN pipeline. The FWHM of the restoring beam was set to 0.15 × 0.15 arcsec2 (14 × 14 pc2) and the entire uv-range with all eight antennas in the MERLIN array was used to produce this image in aips. For consistency, the contours are the same as fig. 2 in M95: 1.5, 2, 3, 4, 5, 6, 7, 8, 9, 10, 15, 20, 25 and 30 mJy beam−1. The naming conventions are shown above with Carral et al. (1990) nomenclature in blue and the Ulvestad et al. (2005) nomenclature in red.
With the exception of the decommissioning of the Wardle (Mk III) antenna, the configuration of eMERLIN is identical to that of MERLIN, providing an angular resolution of 150 mas at 1.5 GHz. The bandwidth of eMERLIN is wider than that of MERLIN, leading to improved uv-coverage. The eMERLIN observations of NGC 4151 were made as part of the Legacy eMERLIN Multi-band Imaging of Nearby Galaxies Survey (LeMMINGs; Beswick et al. 2014). LeMMINGS is the second largest of the eMERLIN legacy surveys and consists of observations of all 280 galaxies above δ ≥ 20° from the Palomar sample of nearby galaxies (Filippenko & Sargent 1985; Ho, Filippenko & Sargent 1995, 1997a,d,e, 2003; Ho et al. 1997b,c, 2009).
A number of observers (Perez et al. 1989; Evans et al. 1993; Robinson et al. 1994; Boksenberg et al. 1995; Winge et al. 1997; Hutchings et al. 1998, 1999; Winge et al. 1999; Kaiser et al. 2000; Kraemer, Schmitt & Crenshaw 2008) have shown optical emission-line images of the nuclear regions of NGC 4151. Whilst it is generally agreed that photoionization from the AGN is an important contributor to the ionization, the importance of the radio jet is not so clear. Here, by combining the eMERLIN image with HST H α, [O ii] and [O iii] images, we explore the contribution of the jet in more detail.
In Section 2, we present the eMERLIN observations and data reduction. In Section 3, we discuss morphological changes between the present image and the previous MERLIN image. In Section 4, we discuss the relationship between the radio jet and the optical line emission region, and we summarize our conclusions in Section 5.
2 OBSERVATIONS AND DATA REDUCTION
2.1 eMERLIN data reduction
Observations of NGC 4151 were performed at L band (weighted central frequency of 1.51 GHz) with the eMERLIN array as part of the LeMMINGs deep sample. This subsample consists of a small number of galaxies for which particularly deep observations have been taken including NGC 4151 (this paper), IC 10 (Westcott et al. 2017), NGC 5322 (Dullo et al., in preparation) and NGC 6217 (Williams et al., in preparation). All seven antennas in the array participated in the observation on 2015 April 29, including the Lovell telescope. NGC 4151 was observed on-source for 3.81 h with data reduction and imaging following the steps outlined in the eMERLIN cookbook and pipeline (Belles et al. 2015; Argo 2015) with aips (Wells 1985). The full uv-plane of the eMERLIN observations is shown in Fig. 2. The observational set-up used a total bandwidth of 512 MHz, centred on 1.51 GHz. The 512-MHz band was split into eight intermediate frequencies (IFs) of width 64 MHz and consisting of 128 channels in each IF. The calibrator NVSS J120922+411941 (J1209+4119) was used for phase referencing, and OQ208 and 3C286 were used as the band pass and flux calibrators, respectively. The target and phase calibrator alternated during the observing run, with blocks of approximately 2.5 min on the phase calibrator and 7 min on the target, with the flux and band pass calibrators observed at the end of the observing run.
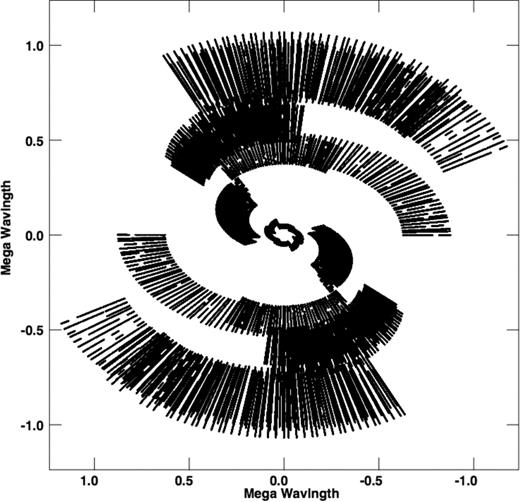
Full observed uv-plane of NGC 4151 at 1.5 GHz, using the LeMMINGs (eMERLIN) deep data with all seven antennas included.
To calibrate the data, we followed the procedure outlined in the eMERLIN cookbook (Belles et al. 2015), a summary of which we include below. Correlation and averaging of the data was performed before the serpent1 flagging code was used to remove the worst instances of radio frequency interference (RFI) from the data. The raw data were then inspected with the aips tasks spflg and ibled to remove any low-level RFI not picked up by the automatic flagger. In addition to the RFI flagging, the first two IFs of the LL polarization were flagged on all Lovell baselines due to the inclusion of a test filter on the antenna. The channels showing no coherent phase at the ends of each IF were also flagged. It is estimated that approximately 15 per cent of the on-source data was flagged during this process and further calibration rounds before the final images were made.
To begin the calibration procedures, we fitted the offsets in delays using the aips task fring before calibrating for phase and gain. Band pass solutions were also calculated with bpass and applied followed by imaging of the phase calibrator, which was self-calibrated until solutions converged. The complex antenna solutions from self-calibration of the phase calibrator were then applied to the target field.
2.1.1 eMERLIN Radio Imaging
These data were imaged with imagr, and phase self-calibration was applied to further refine the data before the visibilities were re-weighted using reway to account for variable sensitivity as a function of antenna, as eMERLIN comprises of an inhomogeneous set of antenna types, frequency and time to maximize the resultant sensitivity of the data. Further self-calibration improved the signal-to-noise ratio (S/N), and the final image was created with the noise in the naturally weighted image of 35 μJy as shown in Fig. 3. Due to the complex nature of this source and its brightness, great care was taken to include only real features deemed to be genuine emission features in the self-calibration process. An amplitude and phase self-calibration did not produce stable phases or amplitudes, so only the final phase self-calibrated data are shown. This data set was then used to create all further images of NGC 4151.
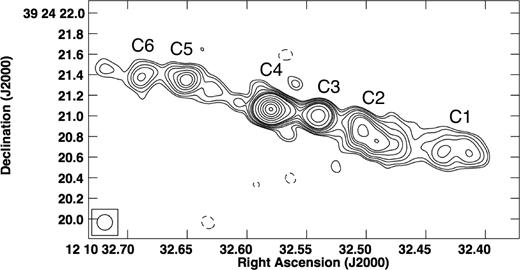
New full-resolution eMERLIN image of the central 4 × 2 arcsec2 (∼360 × 180 pc2) region of NGC 4151 using all seven eMERLIN antennas and a natural weighting. As in Fig. 1, the entire uv-range was used with a 0.15 × 0.15 arcsec2 FWHM restoring beam. Contours set are at −0.25, 0.75, 1, 1.5, 2, 3, 4, 5, 9, 16, 25, 36, 49 and 64 mJy beam−1.
2.1.2 Archival MERLIN data reduction and imaging
Archival data originally published in M95 were re-reduced to compute accurate positions and flux density measurements to compare to the new eMERLIN data set. NGC 4151 was observed in 1993 November at 1.42 GHz. The MERLIN data were calibrated with the MERLIN pipeline2 in aips and re-imaged to account for RFI, alter the beam size and re-weight the data. As the data were originally taken in spectral line imaging mode to study the neutral hydrogen absorption in NGC 4151 (see M95), to create a continuum image we flagged all channels that were contaminated by this line to ensure the flux measurements on the core component C4 were not affected by this absorption feature. The amount of on-source time was 9.8 h, achieving an rms noise of 0.25 mJy beam−1. We thus see the large improvement in S/N achieved by eMERLIN compared to the previous MERLIN array. All stations in the MERLIN array took part in this observation including the Lovell telescope. All images produced were made at the same resolution as those published by M95, in order to be able to directly compare all data. The re-reduced natural image of the data is shown in Fig. 1 together with the contouring scheme from M95. Note that the extended low surface brightness structures seen to the south of C2 in fig. 2 of M95 are not present in our re-reduced image, probably due to improved imaging fidelity of these new eMERLIN data due to the large bandwidth (512 MHz compared to 8 MHz) resulting in more complete sampling of spatial scales.
2.1.3 Comparison between the two radio epochs
When comparing the two epochs of data, some caution needs to be taken since archival MERLIN data does not completely match the new eMERLIN data in terms of uv-range, number of antennas, bandwidth, central frequency and observing time.
Therefore, to make an unbiased comparison of the source structure at the two data epochs, we made two additional images with similar conditions for each data set. The uv-range was limited to between 100 and 1000 kλ, where the two data sets overlapped. We exclude the now defunct Mark III (Wardle) antenna from the MERLIN data. All of the images were made with the same FWHM restoring beam size of 0.15 × 0.15 arcsec2, corresponding to 14 × 14 pc. The final images are shown in Figs 4 and 5 based on MERLIN and eMERLIN, respectively. Subsequently, this enables us to compare emission on the same spatial scales.
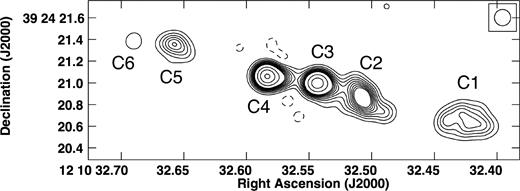
Naturally weighted archival MERLIN image of the central 3.6 × 1.2 arcsec2 (∼330 × 110 pc2) region of NGC 4151, re-reduced with the MERLIN pipeline here. The beam was set to 0.15 × 0.15 arcsec2 and a restricted uv-range of 100–1000 kλ was used to produce this image in aips to overlap with the same uv-range in the eMERLIN image. All antennas except the Mk III (Wardle) in the MERLIN array were used so as to include only those antennas in the current eMERLIN array. The contours are −0.75, 1, 2, 3, 4, 5, 6, 7, 8, 9, 16, 25, 36, 49 and 64 mJy beam−1. The naming convention from Carral et al. (1990) is overlaid in black.
The eMERLIN data were then loaded into CASA to produce an in-band spectral index image with clean and nterms set to 2. The spectral index image is shown in Fig. 6.
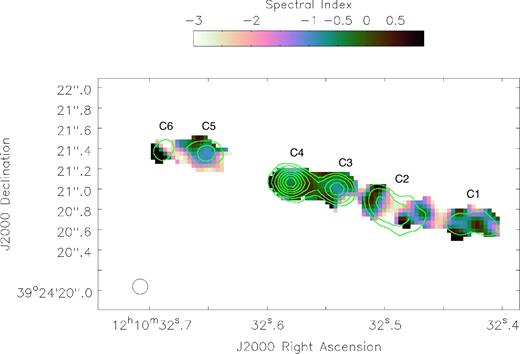
eMERLIN spectral index image obtained with casa of the central 3.7 × 1.8 arcsec2 (∼340 × 160 pc2) of NGC 4151 at 1.51 GHz. The contours plotted are 2, 4, 9, 16, 25, 36, 49 and 64 mJy beam−1 from the full resolution eMERLIN image. Data were clipped at 2 mJy in the full resolution casa eMERLIN image so that spurious low-S/N regions were removed. All data were displayed with casa and the range of colours restricted to range between −3.0 and 1.0 so as to remove any further spurious regions of non-physical spectral index from the image. The naming convention from Carral et al. (1990) are overlaid in white.
2.2 Optical data
Perez et al. (1989) presented [O iii] and H α ground-based imaging of NGC 4151 and show that the ratio of [O iii]/H α defines a large (∼10 arcsec, 910 pc) cone-like structure to the south-west of the nucleus of PA ∼ 50°, misaligned with respect to the radio structure. Evans et al. (1993) and Boksenberg et al. (1995) have presented HST Planetary Camera (PC) images in [O iii] and H α. HST Wide Field Planetary Camera 2 (WFPC2) images in [O ii], [O iii] and H α have been presented by Hutchings et al. (1998, 1999); Kaiser et al. (2000) and Kraemer et al. (2008).
High-resolution HST Wide-Field Planetary Camera 2 (WFPC2) images of NGC 4151 , from the GO-5124 program (PI: H. Ford), in the F336W, F375N ([O ii]), F502N ([O iii]), F547M, F658N (H α) and F791W filters were retrieved from the public Hubble Legacy Archive (HLA3). The data were observed on the 1995 January 22. Here, we re-reduce these data, using the state-of-the-art techniques described in Dullo, Martínez-Lombilla & Knapen (2016), providing [O ii], [O iii] and H α emission-line images and produce an HST [O iii]/H α image that has not been previously presented. These images are considered, together with the eMERLIN radio image, in Section 4.
In order the create the emission-line images, we used the WFPC2 PC1 F336W, F375N, F502N, F547M and F658N images and followed the procedures outlined in Knapen et al. (2004), Sánchez-Gallego et al. (2012) and Dullo et al. (2016) and compared the narrow-band F375N ([O ii]) image with the broad-band F336W image to create the [O ii] continuum-subtracted emission-line image (Fig. 7). Similarly, we created the [O iii] and H α emission-line images by comparing the F502N ([O iii]) and F658N (H α) images with the F547M image of the galaxy. Figs 7 and 8 show our new eMERLIN L-band image overlaid on these three ([O ii], [O iii] and H α) line images and on the [O iii]/H α emission-line ratio, respectively.
![HST emission-line images of NGC 4151 for (a) H α, (b) [O iii] and (c) [O ii]. The full resolution eMERLIN radio contours are plotted on top and are at 2, 4, 9, 16, 25, 36, 49 and 64 mJy beam−1. In all images, north is up and east is to the left-hand side. All three images correspond to the central ∼8 × 6 arcsec2 (∼740 × 550 pc2) of the nucleus of NGC 4151.](https://oup.silverchair-cdn.com/oup/backfile/Content_public/Journal/mnras/472/4/10.1093_mnras_stx2205/2/m_stx2205fig7.jpeg?Expires=1716433047&Signature=UHVZ~dwrSzEnvdXjFhHg22qyJwhJFBzpleWVHnkrRMC9BvFDu12hk5Ci5ida8iKT92q8tA0JmCaojDpMCzfEDa6X-9WV5H5x5ZiUFCl16eRJa-MUSmjml-CwlNLxohf28ykulFk5EFfwZyQ8MHwKay9Jv7SQZWOaMIQ0YCec2pS8d1LLtvlCsbsK3QCnh0IaeCTw8oPjxJdHFgMkqFwDy4qzefVj9NWYcckeukwN4LPhcOaeEBBRdfgt6ocl-YoKVarwK4IIvuuHSoGvE6wH2EzzMuJmUmvJ9jamBtUNP5LxoAx3GWxZ7bvSrIP~ABUDt99HUk4bJme8Gf1FDim3Ng__&Key-Pair-Id=APKAIE5G5CRDK6RD3PGA)
HST emission-line images of NGC 4151 for (a) H α, (b) [O iii] and (c) [O ii]. The full resolution eMERLIN radio contours are plotted on top and are at 2, 4, 9, 16, 25, 36, 49 and 64 mJy beam−1. In all images, north is up and east is to the left-hand side. All three images correspond to the central ∼8 × 6 arcsec2 (∼740 × 550 pc2) of the nucleus of NGC 4151.
![Image showing the ratio of the optical [O iii] to H α line emission from HST imaging of the central ∼21 × 12 arcsec2 (∼1.9 × 1.1 kpc2) of NGC 4151. The full resolution eMERLIN radio contours are plotted on top and are at 2, 4, 9, 16, 25, 36, 49 and 64 mJy beam−1 We clipped out any pixels with S/N <4 to remove spurious artefacts. The larger scale structure of the ionization region is seen southwest of the core. This lines up more closely with the PA of the overall line emission ∼50° but it is clear that the inner region bounded by the radio jet is at a slightly different angle at ∼57°. In this image, north is up and east is to the left.](https://oup.silverchair-cdn.com/oup/backfile/Content_public/Journal/mnras/472/4/10.1093_mnras_stx2205/2/m_stx2205fig8.jpeg?Expires=1716433047&Signature=WOPANPHxEO8w4lMCBvMioAupcP0CHFpBiOFNVssphOuCet2ePUzsBmBBy7htN5SWGmearw6HM~Hto3vxErhW31qBp0IeEQuOnnBcnoUF-qyBXaP-Abgmf9OPQgpbkElZcq38-9cvoGVkYgtdmXY4PHRMkx38~dKCgBkh0mFh~Ybe-RgzpZLZCbBjSa0QV8adXpJKteOucSfEBDCn8aYhb687rZTuryFQGawIKtqsw~iPbxlvs~uQbHU0Sz9m0cI9X6tEkl7ZefpvWkvLUKcHfxV~u0gLbQRfHcgAtxqfpf-62NnPOwoBA0TlVUA3i7oHjgT3usmuQ65tYeV-Wc4sGQ__&Key-Pair-Id=APKAIE5G5CRDK6RD3PGA)
Image showing the ratio of the optical [O iii] to H α line emission from HST imaging of the central ∼21 × 12 arcsec2 (∼1.9 × 1.1 kpc2) of NGC 4151. The full resolution eMERLIN radio contours are plotted on top and are at 2, 4, 9, 16, 25, 36, 49 and 64 mJy beam−1 We clipped out any pixels with S/N <4 to remove spurious artefacts. The larger scale structure of the ionization region is seen southwest of the core. This lines up more closely with the PA of the overall line emission ∼50° but it is clear that the inner region bounded by the radio jet is at a slightly different angle at ∼57°. In this image, north is up and east is to the left.
The V − H dust map of NGC 4151 by Martini et al. (2003, their fig. 1) shows that the galaxy has spiral dust arms at R ≳ 100 pc. However, this dust map and the visual inspections of the HST images (see Fig. 7) show that the emission-line regions in the galaxy are only weakly obscured by dust. Therefore, we did not attempt to correct for the spiral dust arms, although dust extinction may somewhat affect our [O ii] line flux measurement since dust absorption is relatively higher at shorter wavelengths. However, when we extract emission-line fluxes from the images (Section 4), we take into account the reddening using the extinction law from Calzetti et al. (2000).
We note that the coordinates of the radio core (component C4) in the eMERLIN image (Fig. 3) differ by 0.2 arcsec (18 pc) from those of the continuum core in the HST images. The radio positions are linked to the positions of VLBI phase calibrator sources. Systematic positional uncertainties are ≲ 1 mas, which can be neglected here. The HST positions are linked to the positions of stars in the Guide Star catalogue (Jenkner et al. 1990), which are typically accurate to 0.3 arcsec (27 pc at this distance). Thus, the discrepancy between the radio and optical core positions is likely attributed to uncertainties in the HST positions. We therefore align the radio and optical images so that the maximum surface brightness at the core of each optical image is coincident with the radio core, C4. We only move the images in right ascension and declination and do not rotate. To align the radio and optical data, we used astropy4 to edit the FITS file header for the central right ascension and declination values.
3 RADIO MORPHOLOGY AND SPECTRAL INDEX
The full-resolution naturally weighted 1.51 GHz eMERLIN image of NGC 4151 (Fig. 3) shows the six previously known components, C1–C6, extending over 4 arcsec (360 pc), similar to the twin-jet morphology observed in M95. The morphology shown in this image is similar to the naturally weighted MERLIN image (Fig. 1), but the core, C4, is definitely brighter, by a factor of 1.5, in the eMERLIN image. The jets, particularly the western jet, also appear narrower.
Below, we will consider the morphological changes in the radio components, from C1 to C6, between the MERLIN and eMERLIN images, as well as changes in positions and fluxes. We fitted two-dimensional (2D) Gaussian components to each of the components C1–C6 using the aips task JMFIT. The peak flux density, integrated flux, RA and Dec, and size of each component were extracted and are shown in Tables 1 and 2. The positions of the components stated in Table 2 refer to the self-calibrated data. These positions are consistent with the values from the dirty image without any self-calibration applied, to within 0.001 arcsec, much smaller than the FWHM of the restoring beam. Note that in those tables we list only the error given by JMFIT from fitting the components. The true error, including the rms noise level on the image, possible contamination by sidelobes from other components and uncertainties in the flux density calibrator, is hard to define but is likely to be at least three times larger. In the following sections, we will focus on each component of the jet in turn to study their morphology, possible movement and flux density change with respect to the two epochs. In terms of the radio morphology, the full resolution images are compared, while flux density variations come from the comparison of the uv-range restricted images (Figs 4 and 5).
Flux densities obtained from Figs 4 and 5, where the resolution of the data is matched, of each component in NGC 4151. The spectral index was obtained from the spectral index image in Fig. 6, the size of the components as found from the fitting process in Section 3 and the minimum energy and magnetic field obtained from this process.
| Peak flux | Integrated flux | Peak flux | Integrated flux | Spectral | Component Size | |||
|---|---|---|---|---|---|---|---|---|
| density | density | density | density | index | in eMERLIN | Bmin | log(Umin) | |
| MERLIN | MERLIN | eMERLIN | eMERLIN | |||||
| Comp. | (mJy beam−1) | 1993 (mJy) | (mJy beam−1) | (mJy) | eMERLIN | image (mas2) | (mG) | (J) |
| C1 | 5.92 ± 0.06 | 2.74 ± 0.35 | 1.94 ± 0.04 | 6.09 ± 0.05 | −0.9 | 346.8 × 203.4 | 0.39 | 44.02 |
| C2 | 13.64 ± 0.07 | 28.69 ± 0.20 | 6.51 ± 0.04 | 15.36 ± 0.04 | −0.9 | 327.0 × 162.9 | 0.59 | 44.16 |
| C3 | 31.66 ± 0.07 | 42.38 ± 0.15 | 22.92 ± 0.04 | 25.74 ± 0.02 | −0.7 | 172.0 × 147.0 | 0.76 | 44.01 |
| C4 | 37.14 ± 0.07 | 46.68 ± 0.14 | 66.76 ± 0.04 | 72.00 ± 0.02 | −0.4 | 161.2 × 150.6 | 0.96 | 44.21 |
| C5 | 6.05 ± 0.07 | 10.69 ± 0.17 | 4.83 ± 0.04 | 6.85 ± 0.03 | −0.9 | 202.8 × 157.3 | 0.54 | 43.85 |
| C6 | 1.87 ± 0.07 | 1.98 ± 0.13 | 1.95 ± 0.04 | 1.86 ± 0.02 | −0.9 | 156.5 × 137.5 | 0.44 | 43.43 |
Astrometric measurements of radio components compared to the position of the core C4 obtained from the self-calibrated data. As the data are self-calibrated, we caution that the absolute values of RA and Dec. are not absolute. These positions are compared to observations first published in M95, but have been re-reduced here (see Section 2.1). All positions given are in J2000 coordinates, with the difference calculated from the core C4 in that given image. The difference of these two values is shown in column 8, which is used as a measure of the relative shift of each component. The errors in the position from the fitting process are of the order half the beam size, i.e. ∼0.075 arcsec (7 pc).
| Comp. | RA eMERLIN | Dec eMERLIN | Difference | RA MERLIN | Dec MERLIN | Difference | Relative Shift |
|---|---|---|---|---|---|---|---|
| C1 | 12 10 32.41726 | +39 24 20.6601 | 1.928 arcsec | 12 10 32.42493 | +39 24 20.6475 | 1.877 arcsec | +0.051 arcsec |
| C2 | 12 10 32.49967 | +39 24 20.8362 | 0.959 arcsec | 12 10 32.50832 | +39 24 20.8694 | 0.886 arcsec | +0.073 arcsec |
| C3 | 12 10 32.54025 | +39 24 21.0026 | 0.466 arcsec | 12 10 32.54319 | +39 24 20.9964 | 0.464 arcsec | +0.002 arcsec |
| C4 | 12 10 32.57989 | +39 24 21.0646 | – | 12 10 32.58279 | +39 24 21.0597 | – | – |
| C5 | 12 10 32.65199 | +39 24 21.3570 | 0.884 arcsec | 12 10 32.65756 | +39 24 21.3505 | 0.913 arcsec | −0.029 arcsec |
| C6 | 12 10 32.68911 | +39 24 21.3844 | 1.306 arcsec | 12 10 32.68911 | +39 24 21.3885 | 1.275 arcsec | +0.031 arcsec |
We caution, however, that small differences in uv-coverage can have a noticeable effect in imaging, particularly of low brightness structures. Here, although we are able to restrict the 1D uv-range to be the same for the MERLIN and eMERLIN images (Figs 4 and 5), we are not able to take the final step of restricting the 2D uv-coverage of the MERLIN image to be the same as for eMERLIN as the reduction in sensitivity is then too great to allow useful imaging of low brightness structures.
3.1 The individual components
3.1.1 C1 and C2
Comparing Figs 4 and 5, the overall peak flux density of C1 and C2 appears to have decreased. However, we caution that the different uv-coverage of the MERLIN and eMERLIN data sets may affect the detection of large-scale structure, giving rise to negative bowls underlying the more compact emission and hence reducing peak flux densities, in the eMERLIN image. In this respect, it is interesting to note that with the lower contour levels for the full-resolution eMERLIN image (Fig. 3), the extended structures of C1 and C2 resemble those of the MERLIN image (Fig. 1).
3.1.2 C3 and C4
C3 is unresolved, even at the highest angular resolution achievable with eMERLIN. Similar to components C1 and C2, the flux density in C3 decreased by a factor of ∼1.5. We again caution that at least part of this change may be due to changes in 2D uv-coverage, but for an unresolved component, the differences in uv-coverage should not be so important. Higher resolution 1.4-GHz VLBA observations (Ulvestad et al. 1998) show a faint (2.6 mJy total flux density) component at the location of C3. This indicates that the emission associated with component C3 by MERLIN and eMERLIN must be related to an extended and diffuse region, undetectable with the VLBA.
The core, where the jet base is located, corresponds to component C4. It is slightly elongated on the western side towards C3, where the 4 mJy beam−1 contour level connects it to C3 as it did in the previous M95 image. In addition, other weaker extensions are associated with C4 towards the north, south and east. We cannot conclude anything about their nature because of their small size and weakness.
C4 is the brightest component, with a peak flux density of ∼67 mJy beam−1, higher than in the MERLIN observations by nearly a factor of ∼2 and corresponding to a luminosity of 3.87 × 1037 erg s−1. VLBI observation at 18 cm (Ulvestad et al. 1998; Mundell et al. 2003; Ulvestad et al. 2005) with an angular resolution of a few mas shows several components along the jet axis located within the core C4, which are not resolved by eMERLIN. The flux density of one of these VLBI components (D3b) increased by ∼30 per cent in 4 yr between the observations of Ulvestad et al. (1998) and Ulvestad et al. (2005). The larger flux density changes seen between the MERLIN and eMERLIN observations are quite consistent with these VLBI changes and confirm that C4 contains a currently active AGN core, injecting relativistic particles into the inner jet.
3.1.3 C5 and C6
Moving to the eastern side of the jet, a 0.4 arcsec (36 pc) significant elongation bridges C4 and C5 (Fig. 3). C5 has a clear extension to the west, similar to that in the 1993 observations. Furthermore, this extension overlaps with a VLBA component G (Mundell et al. 2003). The peak intensity of component C5 remains mostly unchanged. C6 is the last component of the eastern jet and is consistent in flux and morphology with previous MERLIN images. This element has a PA 125°, clearly different from the other components, suggesting a possible bending of the jet spine. A further weak component appears east of C6, which is not present in the previous MERLIN data. This component requires further investigation with eMERLIN to confirm its presence and morphology.
3.1.4 Summary
C4 has definitely increased in flux density (by factor nearly 2) in the 22-yr period between the MERLIN and eMERLIN observations. Components C5 and C6 in the eastern jet have not changed noticeably. This lack of change leads confidence to the finding of a decrease in flux density of components C3, C2 and C1 in the western jet is real.
3.2 Estimation of the jet speed
Pedlar et al. (1993), Robinson et al. (1994) and Vila-Vilaro et al. (1995) estimate that the pointing angle of the radio jet with respect to the line of sight is ∼40° based on a combination of geometric arguments, velocity images of the narrow line region (Winge et al. 1997; Hutchings et al. 1998; Winge et al. 1999) and the galactic disc inclination. We take this pointing angle into account when calculating the jet speed.
To accurately estimate the jet speed, components with reliable positions are needed. Hence only the unresolved components with no significant extensions can provide a precise astrometric position by fitting them with a 2D-Gaussian provided by the JMFIT task. This is the case for C3 and C4. As the data are self-calibrated, we lose absolute astrometric positions of the components between the two epochs of data. However, we do not lose relative positions and so we can still measure possible changes in separation between C3 and C4. We measure a change in separation of 2 mas but given a beam size of 150mas, we do not claim any detectable movement. Taking the 2-mas figure at face value would give a velocity of 0.04c, completely consistent with the upper limits measured from VLBI observations by Ulvestad et al. (2005) but over a period of 4 yr.
3.3 Radio spectral index
We use the definition of radio spectral index, α, where the flux density, S at frequency ν is given by Sν ∼ να. A flat spectrum (α ≳ −0.3) is representative of a compact synchrotron self-absorbed source. Most AGN cores have flat spectra whereas extended, optically thin, emission has a steeper spectrum (α ≲ −0.7).
We derive the spectral index for the full-resolution eMERLIN image, using the full 512 MHz bandwidth. We use the casa task clean with nterms = 2 to interpolate through all the IFs (Rau & Cornwell 2011). We consider only the emission above 2mJy beam−1 to remove unreal fluctuations due to low S/N. The spectral index image is presented in Fig. 6. The calculated α values range between −3 and 1.
Table 1 contains the radio spectral index of the components along the jet, ascertained from Fig. 6 at the location of the flux peak of each component. The unresolved bright components, i.e. C3 and C4, provide the most reliable spectral indices. The core C4 shows the flattest radio spectrum within the eMERLIN bandwidth with a value of ∼ −0.4. This is consistent with α obtained with wider band spectra by Pedlar et al. (1993) (5−8 GHz) and by Carral et al. (1990) (1.6−15 GHz), both with the MERLIN array. The component C3 has a steeper index ∼ −0.7, consistent with the broad-band values in the literature from MERLIN (Carral et al. 1990; Pedlar et al. 1993) and also with our assertion that most of the flux density from C3 comes from a region that is extended on VLBI scales.
The remaining components show steeper spectra still, although the lower S/N in these regions leads to large sporadic variations at the edges of components, which are almost certainly not real. Broadly, we note a steepening spectrum further away from the core, consistent with the classical picture of a jet losing energy by electron ageing and expansion (Condon & Ransom 2016).
3.4 Estimation of the magnetic field along the jet
One possible explanation of a reduction in radio luminosity is simple radiative losses. To estimate the loss time-scale, it is necessary first to estimate the magnetic field strength, which we do here.
Assuming the minimum energy condition applies to our target, we can estimate the magnetic field Bmin of each component along the jet. This assumption folds in information on the spectral index, size, flux density, the jet composition and the pitch angle of the magnetic field. We assume that the depth of the source is equivalent to the minor axis of the component, unity in the ratio of energy in electrons and ions, no angular dependence on the direction of the magnetic field and the line of sight and a frequency range of 0.01–100 GHz. The observational constraints come from the integrated flux densities, the spectral indices and the deconvolved sizes of the components shown in Table 1.
We compute the magnetic field for all the components. However, as discussed above, the low S/N can significantly degrade the accuracy of the fitting parameters for each component. Since C3 and C4 are bright resolved components, the estimates of their magnetic fields are likely more reliable and are of the order of 1mG. The remaining components show slightly smaller values of Bmin, decreasing down the jet. Booler et al. (1982), performing a similar analysis for NGC 4151 using MERLIN data, estimated magnetic fields of the same order.
VLBI/VLBA observations resolve further structure in components C3 and C4, corresponding to smaller physical regions in the jet (Ulvestad et al. 1998; Mundell et al. 2003; Ulvestad et al. 2005). Therefore, we calculate Bmin using these higher resolution data (flux, size5 and spectral index) for the VLBI central core, D3, located at our component C4, and the VLBA component, C, located at C3. The Bmin for D3 is 5.38 × 10⁻² G, while it is 1.35 × 10⁻² G for VLBA component C. We note that these values are larger by a factor of several tens than the eMERLIN values due mainly to the smaller size of the component used when calculating Bmin. Broadly, the range of Bmin values obtained with this approach are consistent with the values of the magnetic field of radio jets from the literature for AGN jets/cores (Marscher & Gear 1985; Biretta, Stern & Harris 1991; Jester et al. 2005; Worrall & Birkinshaw 2006).
3.5 The cause of the reduction in radio flux density: synchrotron cooling or adiabatic losses?
The synchrotron decay time-scale, τ, is related to the magnetic field strength and observing frequency by τ∝ B−1.5 ν−0.5. Although much of the emission from C3 is extended on scales larger than those probed by VLBI, we can estimate the fastest decay time-scale by taking the magnetic field strength from VLBI measurements. This decay time-scale for C3 is ∼700 yr. Thus in 22 yr, we would only expect a 3 per cent decrease, compared to the observed decrease of nearly 30 per cent. For the lower surface brightness components, C1 and C2, the time-scales would be longer. Thus, assuming that the flux density decrease is real, additional energy loss processes are required, e.g. adiabatic expansion losses. Scheuer & Williams (1968) show that, for a linear expansion factor F (and for Sν ∝ ν+α), the flux density at a particular frequency will change by F(4α − 2). Thus, for α = −0.70 from our spectral fitting of component C3, the flux density changes by ∼ F−5. Thus, we require only a very small expansion (F = 1.06) to produce a decrease of 25 per cent. The source size is not known, but to explain the flux seen by eMERLIN but not detected by VLBA, it will probably exceed a few VLBA beam sizes, i.e. ∼1 pc.
Given this size and expansion factor, the expansion speed of the component C3 in 22 yr would be ∼2600 km s−1, but as the source size and decrease in flux are not accurately known, this speed is uncertain. However, velocities of order ∼1000 km s−1 are not unexpected for shocks around expanding radio sources (Axon et al. 1998; Bicknell et al. 1998; Capetti et al. 1999) and so it is plausible that adiabatic expansion could explain the decrease in flux of C3.
For the lower surface brightness components, the characteristic radiation decay time-scale is ∼105 yr, which is similar to the value estimated by Pedlar et al. (1993). However, given our uncertainty in measuring the flux density changes we do not speculate further about these components. Clearly, for C4, injection of new high energy particles dominates over any radiation or expansion losses.
4 THE POSSIBLE CONNECTION BETWEEN THE RADIO JET AND THE EMISSION-LINE REGION
In Fig. 7, we show the HST emission-line images from our new reduction in H α, [O iii] and [O ii], and in Fig. 8, we show an emission-line-ratio image, [O iii]/H α. eMERLIN radio contours are superimposed in all cases.
In the emission line images (Fig. 7), there is a relatively bright region of emission of size ∼8 × 3 arcsec2 (730 × 270 pc2) broadly surrounding the radio jet, although the emission-line region (major PA ∼ 57°) and jet (PA ∼ 79°) are not exactly aligned. The [O iii]/H α ratio image defines a larger cone-like structure (PA ∼ 53°) extending at least 11 arcsec (1 kpc) from the core. The emission-line images show the presence of sub-structures, arches and haloes, indicating a clumpy distribution of the gas.
The range of [O iii]/H α ratio we show is between 0 and 5, based on values obtained for similar Emission-Line Region (ELR) for radio galaxies (Baldi et al., in preparation). This ratio is a useful diagnostic tool for investigating the nature of the ionizing source, i.e. shocks or photoionization (Kewley et al. 2006; Allen et al. 2008; Capetti & Baldi 2011). [O iii]/H α < 1 can be reproduced by shocks or by a weak radiation field from an AGN or star-formation, while strong illumination from the AGN or a young stellar population can yield [O iii]/H α > 2 (Baldi et al., in preparation).
The [O iii]/H α values increase from very low values (∼0.5) near the core and around the radio jet to >1.5 in the more distant parts of the cone. This change in ratio suggests a change in the mechanism of ionization from shock heating near the core to AGN photoionization further out. We therefore next consider in more detail whether shocks, such as might be associated with the jet, can explain the ionization of the inner, brighter, ionization region. The bright region 2 arcsec (180 pc) south of the core that is visible in the [O iii] and [O iii]/H α image is a ‘ghost’ caused by internal reflection (Hutchings et al. 1998).
4.1 Origin of the emission-line region: jet or AGN?
The ratio of the radio luminosity to the emission-line luminosities provides powerful diagnostics of the source of the ionization, (e.g. Pakull, Soria & Motch 2010). Bicknell et al. (1998) present the [O iii] and radio luminosities of various samples of AGN. They state that the [O iii] luminosities are consistent with the predictions of a model for ionization based on the expansion of radio lobes (Bicknell, Dopita & O’Dea 1997). Here, we therefore calculate the emission-line luminosities of the ELR.
To determine the H α, [O iii] and [O ii] luminosities of the brighter extended ELR surrounding the radio jet, we select a circle of radius 2 arcsec (180 pc), centred on C4. We performed a standard analysis, using the task radprof in iraf (Tody 1986, 1993) for the aperture photometry of the HST images F658N, F502N, F375N. To estimate the emission-line fluxes from the ELR, we must first measure and remove the large unresolved component from the AGN nucleus. We therefore measure the flux within a radius of 0.125 arcsec (11 pc) centred on the core. We subtract this flux from the flux within the 2 arcsec radius area. We convert the extracted fluxes into physical units using the parameter PHOTFLAM, the flux-density normalization value and the image bandwidths. We correct the fluxes for reddening using the Calzetti dust extinction law (Calzetti et al. 2000). Furthermore, we estimate the contamination from other emission lines falling within these bands. For F658N, to estimate the H α, we take into account the [N ii] doublet, using the observed ratio of [N ii] λ6583 = 0.68 H α from the optical spectrum (Ho et al. 1997a). Only the [O iii] λ5007 line of the [O iii] doublet falls in the F502N band and only the [O ii] λλ,3726,3729 doublet falls in the F375N band. Hence, the total ELR fluxes within the 2 arcsec radius, but not including the unresolved contribution from the nucleus, are 1.54 × 10⁻¹⁴, 1.10 × 10⁻¹³ and 1.43 × 10⁻¹³ erg s−1 cm−2, respectively, for H α, [O iii] and [O ii]. Assuming a distance of 19 Mpc for our target, the calculated luminosities are 6.65 × 1038, 4.74 × 1039 and 6.16 × 1039 erg s−1. The ratio of the [O iii] to radio luminosity here is consistent with the observations presented by Bicknell et al. (1998). Changes in the positioning and size of the subtraction region of the central core is the major source of error in measurement of line fluxes from the ELR and may be up to a factor of 3.
Shock models can be used to predict line luminosities. Nelson et al. (2000) used the mappings II code to estimate the expected H β luminosity from shocks in NGC 4151. Here, we repeat that analysis using results from the mappings III code (Dopita & Sutherland 1996; Allen et al. 2008) similar to the analysis of eMERLIN and HST observations of M 51b by Rampadarath et al., (in preparation). First, taking H β/H α = 0.29 from long-slit spectra (Ho et al. 1997a), then from our measured value of H α luminosity (above), we find that LH β = 1.93 × 1038 erg s−1. The ratio of H β luminosity to luminosity in ionizing radiation produced from shocks is ∝ v|$_{\text{s}}^{-0.59}$|, where vs is the velocity of the shock. Here, in agreement with Nelson et al. (2000), we find that a low velocity shock overpredicts LH β and we require vs > 2700 km s−1, similar to the calculated jet expansion speed, to reduce the predicted LH β to the observed level. We note that the mappings iii code assumes a relatively high conversion efficiency of jet kinetic power into ionizing radiation (∼27/77, Weaver et al. 1977). A reduced efficiency could therefore make our observed LH β consistent with lower shock velocities. We also note that Weaver et al. (1977) refers to low velocity stellar winds but faster shocks with velocities >1500 km s−1 are observed in narrow line regions of other nearby radio-bright Seyferts, similar to NGC 4151 (Axon et al. 1998; Capetti et al. 1999).
The emission-line ratios [O iii]/H β and [O ii]/H β can provide another constraint on the shock velocities (Allen et al. 2008). Our ratio values from the 2- arcsec apertures are ∼25 for [O iii]/H β and ∼30 for [O ii]/H β. These ratios imply vs ≫ 1000 km s−1, broadly consistent with the velocities derived from LH β.
We qualitatively compare the energetics from the AGN radiation with those of the radio jets. We estimate the kinetic jet power from the radio core luminosity according to the empirical relation found by Merloni & Heinz (2007) by using 5 GHz core components from VLA data. For our target, we use the 5-GHz data obtained in Pedlar et al. (1993) and hence calculate a jet power of 1.4 × 1042 erg s−1. We can estimate the AGN radiative power from the X-ray nuclear emission. Wang et al. (2011a) measure the nuclear X-ray emission using Chandra as 1.13 × 10⁻¹⁰ erg s−1 cm−2, corresponding to a luminosity of 4.6 × 1042 erg s−1, although they do note that this is variable. Therefore, the values derived for the energetics of the AGN radiation and of the radio jets are consistent assuming uncertainties in the Merloni & Heinz (2007) relation.
Mundell et al. (2003) concluded that the AGN radiation field is the main source of ionizing power in the ELR, but that the radio jet interaction with line-emitting clouds could contribute to the observed ionization. By fitting Chandra X-ray spectra, Wang et al. (2011b) also argued that shocks could make up to 12 per cent of the ionized extended emission. Generally, our results are consistent with the conclusions of Mundell et al. (2003) and Wang et al. (2011b) about the jet contribution to the ionization of the ELR. Combined with the changing ionization parameter in our [O iii]/H α image, we therefore conclude that in the ELR at a greater distance from the AGN core than the radio jet, e.g. farther away from C4 than 360 pc, the photoionization from the AGN is the only significant source of ionizing power for the ELR. However, in regions close to the radio structure (≤360 pc), the jet cannot be ruled out as at least one component of the ionizing power. As we cannot fully disentangle the contribution of the two main ionizing sources, we cannot quantitatively estimate the fractional ionization due to the radio jet relative to the AGN illumination in the ELR from our results.
5 SUMMARY AND CONCLUSIONS
The Seyfert galaxy NGC 4151, with twin radio jets, is the radio-brightest of the so-called ‘radio-quiet’ AGN and is thus one of the few such AGN for which it is possible to observe temporal changes in the structure of its jets. Here, we present high-resolution 1.5 GHz images obtained as part of the LeMMINGs legacy survey with the eMERLIN array. We compare these images with those made 22 yr previously with the structurally very similar MERLIN array (M95). These images clearly show that the central AGN (component C4) has brightened by almost a factor of 2. The components in the eastern jet (C5, C6) do not appear to have changed but components in the western jet, particularly C3, seem to have decreased in intensity. These observations show that the AGN core, C4, is still very much active in NGC 4151 and still injecting particles into the inner jet, but energy loss mechanisms are dominating further out in the jet.
We detect no significant change in the separation between the core, C4, and the only other unresolved component in the eMERLIN image, C3. The resultant upper limit to the jet velocity ≤0.04c is consistent with the upper limits set by VLBI observations (Ulvestad et al. 2005) over a shorter (4 yr) time period. However, given the beam size of 150 mas, we do not claim any detectable movement of C3 away from the core C4.
We derived a spectral index image from within the eMERLIN bandwidth. The radio spectrum of the core, C4, is flat as expected from a jet base, and steepens down the jet, probably due to radiative losses. Further, eMERLIN observations will be made at 5 GHz in the near future, which will better constrain the spectral indices of the jet components and resolve the smaller scale emission.
We have estimated the magnetic fields in all components in NGC 4151, assuming the minimum energy condition. The values found, taking sizes from eMERLIN observations, are ∼few mG, consistent with similar MERLIN observations in the literature. Magnetic fields derived using VLBI observations are factors of 10 higher. The characteristic synchrotron decay time-scale, inferred from the magnetic field derived from VLBI observations for the unresolved bright component C3, is of the order of ∼700 yr, longer than that required to account for the flux decrease in 22 yr. However, we find that given adiabatic losses, a very small linear expansion factor of 6 per cent can produce the measured flux density decrease of 25 per cent.
We present newly reduced high-resolution optical emission-line images (H α, [O iii], and [O ii]) from HST of the nucleus of NGC 4151. The misalignment between the radio and optical line emission regions has been discussed by previous authors, e.g. Evans et al. (1993) and Pedlar et al. (1993) and are not discussed further here. However, we do use these data to investigate the origin of the ionization of the ELR as a function of distance from the AGN. We note that the [O iii]/H α ratio close to the AGN, near the radio jet, is best produced by shocks whereas, far from the AGN (≥360 pc), the ratio is more consistent with photoionization. We also note that the ratio of radio to emission-line luminosity shown here is similar to that found by Bicknell et al. (1998) for various samples of radio galaxies and is consistent with models for ELR ionization based on expanding radio lobes. Although our estimate is very uncertain, the derived expansion velocity of C3 is in agreement with the higher shock velocities needed to avoid overproduction of H β emission. We also note that the brightest parts of the ELR are those directly surrounding the radio jet. We therefore conclude that although the parts of the ELR farther from the core than the eMERLIN radio jet (≥360 pc) are ionized largely by photons from the AGN, in the region of the ELR close to the radio jet, the jet is probably also a significant contributor to the ELR ionization.
Although it is clear that there is a two-sided radio jet interacting with the ISM in NGC 4151, it remains to be seen whether it is characteristic of all low-luminosity AGN or is in fact a curious, but intriguing exception to the rule (Ulrich 2000). To explore the ISM–jet connection on a broader scale, we require systematic studies of large samples of low-luminosity AGN at sub-arcsec-resolution. Radio observations of nearby sources such as those currently being made with the LeMMINGs survey are able to resolve sub-kpc scale radio emission to investigate jet formation. However, only in conjunction with multi-wavelength data of comparable angular resolution (such as that obtained from HST and Chandra) can we learn about the physics of AGN feedback into the ISM.
Acknowledgements
We thank the anonymous reviewer for their comments and revisions. We acknowledge funding from the Mayflower Scholarship from the University of Southampton afforded to DW to complete this work. This publication has also received funding from the European Union’s Horizon 2020 research and innovation programme under grant agreement No 730562 (RadioNet). IMM thanks the Royal Society for the award of a Royal Society Leverhulme Trust Senior Research Fellowship. RDB and IMM also acknowledge the support of Science and Technology Facilities Council (STFC) under grant (ST/M001326/1). JHK acknowledges financial support from the European Union’s Horizon 2020 research and innovation programme under Marie Skłodowska-Curie grant agreement No 721463 to the SUNDIAL ITN network, and from the Spanish Ministry of Economy and Competitiveness (MINECO) under grant number AYA2016-76219-P. DMF wishes to acknowledge funding from an STFC Q10 consolidated grant (ST/M001334/1) CGM acknowledges financial support from STFC. EB and JW acknowledge support from the UK’s STFC (grant number ST/M503514/1) and (grant number ST/M001008/1), respectively. FP has received funding from the European Union’s Horizon 2020 Programme under the AHEAD project (grant agreement No 654215). We also acknowledge Jodrell Bank Centre for Astrophysics, which is funded by the STFC. eMERLIN and formerly, MERLIN, is a National Facility operated by the University of Manchester at Jodrell Bank Observatory on behalf of STFC. Some of the observations in this paper were made with the NASA/ESA Hubble Space Telescope, and obtained from the Hubble Legacy Archive, which is a collaboration between the Space Telescope Science Institute (STScI/NASA), the European Space Agency (ST-ECF/ESAC/ESA) and the Canadian Astronomy Data Centre (CADC/NRC/CSA). DW would also like to thank Alessandro Capetti, Sam Connolly, Sadie Jones and Anthony Rushton for useful discussions.
Since the VLBI/VLBA observations do not provide the deconvolved sizes of the components, we used a component size half the size of the beam: 1.6 × 0.9 mas2 for VLBI and 2.9 × 2.4 mas2 for VLBA.
