


Abstract
We investigate the variation of black hole masses (MBH) as a function of their host galaxy stellar mass (M*) and half-light radius (Re). We confirm that the scatter in MBH within this plane is essentially the same as that in the MBH–σ relation, as expected from the negligible scatter reported in the virial mass estimator |$\sigma _{\rm v}^2=G\times M_\ast /(5\times R_{\rm e})$|. All variation in MBH happens along lines of constant σv on the (M*, Re) plane, or M* ∝ Re for M* ≲ 2 × 10¹¹ M⊙. This trend is qualitatively the same as those previously reported for galaxy properties related to stellar populations, like age, metallicity, alpha enhancement, mass-to-light ratio and gas content. We find evidence for a change in the MBH variation above the critical mass of Mcrit ≈ 2 × 10¹¹ M⊙. This behaviour can be explained assuming that MBH in galaxies less massive than Mcrit can be predicted by the MBH–σ relation, while MBH in more massive galaxies follows a modified relation, which is also dependent on M* once M* > Mcrit. This is consistent with the scenario where the majority of galaxies grow through star formation, while the most massive galaxies undergo a sequence of dissipation-less mergers. In both channels, black holes and galaxies grow synchronously, giving rise to the black hole–host galaxy scaling relations, but there is no underlying single relation that is universal across the full range of galaxy masses.
1 INTRODUCTION
The relationship between supermassive black holes and their host galaxies continues to generate much interests in the literature. Since the discovery of the relationship between the mass of the black holes (MBH) and the galaxy luminosity (L, Kormendy & Richstone 1995), it was clear that these objects must be linked in an intricate way (for a review of the development of ideas about the scaling relations between black holes and galaxies, see Graham 2016). The subsequent discoveries of the relations between MBH and galaxy mass (M*, Magorrian et al. 1998), velocity dispersion (Gebhardt et al. 2000; Ferrarese & Merritt 2000), circular velocity (Ferrarese 2002), and galaxy concentration (Graham et al. 2001, 2003a), as well as several secondary scaling relation (Seigar et al. 2008; Burkert & Tremaine 2010; Harris & Harris 2011) only deepened the interest. These relations, their tightness and the dynamic range covering several orders of magnitude, indicate that the growth of supermassive black holes in the centres of galaxies, and galaxies themselves, must be closely related. The hope is that understanding the properties of these relations, their universality, shape, tightness and related uncertainties, will also highlight and untangle the relevant processes that are involved in the growth of black holes and galaxies.
The number of galaxies with measured black hole masses has dramatically increased over the last 10 yr (Ferrarese & Ford 2005; Kormendy & Ho 2013), approaching a hundred estimates of MBH based on dynamical models of stellar or gaseous motions (Saglia et al. 2016). Once these are combined with estimates based on the reverberation mapping for active galactic nuclei (AGNs) and upper limit measurements, the sample comprises more than 200 galaxies (van den Bosch 2016). Such numbers, while not yet of sufficient size for pure statistical studies, allow a more complex analysis of the scaling relations, specifically to investigate which of the various relation has the smallest scatter (and therefore is more fundamental), if the data actually support two (or more) power-law relations, and if there is a third parameter that could make the scaling relations even tighter. The main limitation of the sample, next to the relatively low number of galaxies, is that it does not represent the complete population of galaxies (Bernardi et al. 2007). The sample is biased towards bright (massive), nearby early-type galaxies (ETGs), with, possibly more massive black holes than in the average of the population, as these are easier to directly probe with dynamical models given the spatial resolution achieved by observations (Batcheldor 2010; Shankar et al. 2016).
Indications of non-universality of MBH scaling relation come from the demographics of host galaxies, for example by investigating if spiral galaxies, galaxies with bars, pseudo-bulges or AGNs satisfy the same relations as more massive ETGs (e.g. Wyithe 2006; Gültekin et al. 2009a; McConnell & Ma 2013). Although samples of non-ETGs galaxies are relatively small (e.g. Saglia et al. 2016), there are clear indications that they do not necessary follow the same scaling relations as the more massive ETGs. Barred galaxies, galaxies hosting masers or AGNs or pseudo-bulges seem to be offset from the main relation (Graham 2008; Hu 2008; Graham & Li 2009; Greene et al. 2010; Kormendy, Bender & Cornell 2011; Hartmann et al. 2014; Greene et al. 2016). Scaling relations for ETGs and spiral galaxies are also offset with respect to each other (McConnell & Ma 2013). It is, however, difficult to establish black hole scaling relations based on morphological classifications, as the classification can be difficult (e.g. recognizing pseudo-bulges, Graham 2015), and the samples are small, or span a limited range in both MBH and galaxy stellar mass.
Nevertheless, there are several arguments that offer a tantalizing indication that the MBH scaling relations are not universal. Lauer et al. (2007) showed that the predictions from the MBH–σ and MBH–L relations are different for high-mass galaxies and brightest cluster galaxies in particular. The main issue is that the MBH–σ relation, using measured velocity dispersions of galaxies, predicts MBH that are rarely larger than a few times 109 M⊙, while the relation with the luminosity predicts MBH in the excess of 1010 M⊙. The origin of this tension is in the curvature of the L–σ relation, which for the most luminous systems departs from the Faber & Jackson (1976) relation; galaxies with velocity dispersion larger than about 300 km s−1 are very rare (Sheth et al. 2003; Bernardi et al. 2006). Crucially, as Lauer et al. (2007) pointed out, there is a difference in L–σ relations for galaxies with and without cores in their nuclear profiles. The relation is much steeper for core galaxies, following ∼σ7, compared to canonical ∼σ4. This is true regardless of using the ‘Nuker’ (Lauer et al. 1995) or (core-) Sérsic (Graham et al. 2003b) parametrization of the nuclear profiles (Kormendy & Bender 2013).
More recently, the data from complete ATLAS3D survey (Cappellari et al. 2011a) revealed that the previously reported major break in the L–σ relation is not related to the transition between core and core-less galaxies. Instead, the break is clearly observed, consistently in both the M*–Re and M*–σ relations, around a mass M* ≈ 3 × 10¹⁰ M⊙, and is present even when all core galaxies are removed (Cappellari et al. 2013b). It appears related to the transition between a sequence of bulge growth and dry merger growth. However, a much subtler change (Hyde & Bernardi 2009) in the L–σ is observed around M* ≈ 2 × 10¹¹ M⊙. Crucially, this characteristic mass marks also a transition between (core-less) fast rotators and (core) slow rotators (Krajnović et al. 2013), indicating a transition in the dominant assembly process (for a review, see section 4.3 in Cappellari 2016).
Distinguishing between core and core-less galaxies in the black hole scaling relation is still of potentially great significance, as cores are predicted to be created by black holes. When massive galaxies (harbouring massive black holes) merge, their black holes will eventually spiral down to the bottom of the potential well and form a binary (Begelman, Blandford & Rees 1980; Ebisuzaki, Makino & Okumura 1991). The decay of the binary orbit will be enabled by removal of stars that cross it (Quinlan 1996; Milosavljević & Merritt 2001), resulting in a central region devoid of stars, a core, compared to the initial steep power-law light profile. As the removed stars were mostly on the radial orbits, this process introduces a strong tangential anisotropy, significantly larger than that expected for an adiabatic black hole growth (Quinlan, Hernquist & Sigurdsson 1995; Thomas et al. 2014). The mergers are dissipation-less (dry) and there is no significant star formation that could refill the core. An implication of this effect is that there should also exist a relation between the MBH and the size of the core region (Lauer et al. 2007), or the missing stellar mass (Graham 2004) in the most massive galaxies. The uncertainties in these relations are, however, not any smaller than in other relations, also because there is no unique way to measure the size of the core (e.g. Lauer et al. 2007; Kormendy & Bender 2009; Hopkins & Hernquist 2010; Rusli et al. 2013; Dullo & Graham 2014).
Dividing galaxies into Sérsic and core-Sérsic (or power-law and core) is significantly different from looking at the difference between various morphological types (late-type galaxies or ETGs, classical or pseudo-bulges, barred and non-barred, etc). A key point here is that the property on which the sample is divided is based on a physical process of the core scouring by black holes (Faber et al. 1997). Therefore, there is a working paradigm supporting a possibility of the non-universality of the MBH scaling relations. This was explored by Graham (2012), Scott, Graham & Schombert (2013) and Graham & Scott (2013), who showed that galaxies with and without cores (using the Sérsic and core-Sérsic parametrization) have different MBH–M* relation. Adding AGNs (all with Sérsic profiles), which extends the sample of galaxies to lower masses, gives even more support to such a break in the scaling relation (Graham & Scott 2015; Reines & Volonteri 2015). Another physically motivated separation of galaxies is to divide them into star-forming and quiescent galaxies (Terrazas et al. 2016, 2017), prompted by the need to suppress star formation in galaxy evolution models, where the activity of central black hole provides a ready feedback mechanism. Furthermore, the expectation is that quiescent galaxies will have larger black hole masses. This is similar to diving galaxies into early- and late-types as done by McConnell & Ma (2013), which also found evidence that ETGs harbour more massive black holes. Neither of these studies, however, reported a break in the relations. These divisions are only approximately similar to Sérsic/core-Sérsic divisions as many ETGs do not have cores, but are quiescent, and further work is needed to describe the shape of the scaling relations across galaxy properties.
Adding more parameters to the correlations with MBH could, in principle, result in tighter relations. This was investigated by a number of studies over the past decade (e.g. Marconi & Hunt 2003; Aller & Richstone 2007; Saglia et al. 2016; van den Bosch 2016). Such attempts, however, generally conclude that the decrease of scatter when adding an additional parameter is not substantial, and MBH–σ is still considered the tightest and perhaps the most fundamental relation, inspite of the intrinsic scatter no-longer being considered consistent with zero (e.g. Gültekin et al. 2009b).
In this work, we introduce a different approach. Instead of looking for the best scaling relation and then inferring the possible formation scenarios, we start from the emerging paradigm of the two phase formation of galaxies, from both a theoretical (Oser et al. 2010) and observational (Cappellari et al. 2013b; van Dokkum et al. 2015) points of view (as reviewed in Cappellari 2016). Assuming that black holes evolve in sync with galaxies, and are modified through similar processes, which are dependent on the galaxy mass and environment (e.g. Peng et al. 2010), we search for the records of these processes in the dependence of black holes masses with galaxy properties. In particular, we consider the distribution of galaxies with black hole measurements in the mass–size diagram, an orthogonal projection of the thin Mass Plane (Cappellari et al. 2013b).
After defining the sample of galaxies with black hole masses that we will use (Section 2), we present the mass–size diagram and analyse its distribution of black hole masses (Section 3). In Section 3.1, we use the stellar photometry and sizes of latest compilation of galaxies black hole mass measurements from the literature (van den Bosch 2016), while in Section 3.2, we repeat the exercise using 2MASS catalogue values to estimate stellar masses and sizes, and provide a scaling relation simply based on 2MASS photometry alone. In Section 4, we present a toy model that reproduces what is seen in the data and discuss the implication of our results, before concluding with a brief summary of main results (Section 5).
2 A COMPILATION OF BLACK HOLE MASSES
We make use of the most recent compilation of MBH measurements presented in table 2 of van den Bosch (2016), with black hole masses obtained from dynamical models and reverberation mapping. We do not include objects excluded from the regression fits in that paper, and we have also removed 49 upper limits. This results in 181 objects. Next to the black hole masses listed in van den Bosch (2016), we also use the listed estimates for the size (effective or half-light radius, Re) and the total Ks-band luminosity (Vega magnitudes) of these galaxies. We estimate the mass of these galaxies (M*) using the relation between the Ks-band mass-to-light ratio (M/L) and the velocity dispersion given by equation (24) in Cappellari (2016). The velocity dispersions are also taken from van den Bosch (2016). We stress that the velocity dispersion is the so-called effective velocity dispersion σe, which incorporates both the mean and random motions within an aperture of the size of the effective radius. Unfortunately, the measurements of σe are not uniform across the sample, as only for a subset of galaxies observed with integral-field units, σe can be measured directly. Fig. 1 presents the mass–size diagram. Note that in the figure we do not plot three galaxies (NGC 0221, NGC 0404 and NGC 4486B), which have significantly lower mass and sizes than the majority of the sample. We keep these objects for calculations, but do not show them for the presentation purposes. The only notable difference between this and the mass–size diagram in fig. 8 of van den Bosch (2016) is that the mass of the galaxies increased by about 15 per cent due to our slightly different conversion to mass.
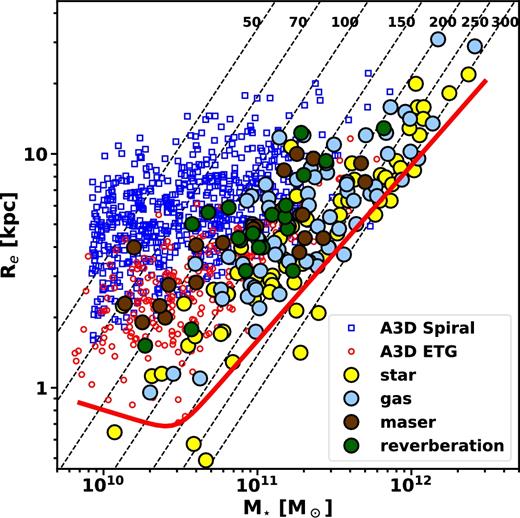
Mass–size diagram for galaxies with black hole mass measurements from the latest compilation presented in van den Bosch (2016, see text for galaxies that were excluded). Filled circles are galaxies with black hole mass estimates, while their colour indicates the type of method used for black hole mass determination, as shown on the legend. Small open (red) circles and (blue) squares are ETGs and spirals from the ATLAS3D sample, respectively. Solid red line shows the ‘ZOE’ ( Cappellari et al. 2013b) and the dash-dotted diagonal lines show constant velocity dispersion, for values shown at the top of the diagram. Note that the mass and size estimates for the spirals, ETGs and the black holes sample have different origin, but the values for the black hole sample are internally consistent and uniformly measured.
In Fig. 1, we also plot galaxies from ATLAS3D survey, comprising ETGs with masses measured via dynamical models (Cappellari et al. 2013a) and spiral galaxies from the parent sample. The mass estimates for the latter are based on their Ks magnitudes following the equation (2) from Cappellari (2013). As already remarked by several authors (e.g. van den Bosch 2016), galaxies with measured MBH occupy a special place in this parameters space, typically being the most massive for a given radius and the smallest for a given mass. Inclusion of galaxies with MBH measured using the reverberation mapping or galaxies with central masers extends significantly the distribution towards low mass and low velocity dispersion regimes. The available MBH determinations are also biased towards massive galaxies: Many black hole masses have been measured in massive galaxies (e.g. >5 × 10¹¹ M⊙), where only a few such galaxies exist in the ATLAS3D volume-limited sample. The black hole sample, while still relatively small and non-representative of the general galaxy population, spans a large range in the effective velocity dispersion (70–300 km s−1), and is appropriate for the following analysis. We note that the results in this paper do not depend on the details of the photometric parameters, and we address this is Section 3.2.
3 BLACK HOLE MASSES ON THE MASS–SIZE DIAGRAM
3.1 Photometry from van den Bosch (2016)
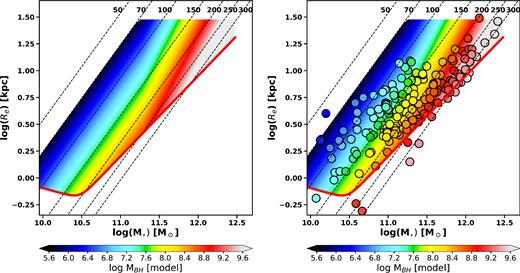
In the left-hand panel of Fig. 2, we plot the mass–size diagram for galaxies with measured black hole masses. Now, we also add MBH as a third dimension shown by the colour. The data (MBH) are adaptively smoothed using the locally weighted regression (LOESS, Cleveland 1979). As shown in Cleveland & Devlin (1988), who also generalize the method to two dimensions, LOESS increases the visual information of a scatterplot and can be used for data exploration, such as uncovering underlying trends that would be easier to observe in a much larger sample. In practice, we use the two-dimensional (2D) LOESS algorithm of Cleveland & Devlin (1988), as implemented in Cappellari et al. (2013b).1 We adopt a linear local approximation and a regularizing factor f = 0.5. To deal with different scale of the axes [log(Re) and log(M*)], the software performs a robust estimation of the moment of inertia of the distribution and then performs a change of coordinates to transform the inertia ellipse into a circle. We assign a constant fractional error to all black holes and do not use the tabulated uncertainties on black hole masses, as they differ greatly from case to case, and generally ignore systematic uncertainties, which dominate the error budget. We can, however, confirm that the conclusions of this work do not change when using the reported uncertainties to weight the linear regression of the LOESS method.
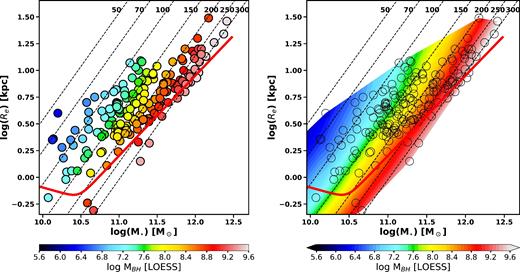
Mass–size diagram as in Fig. 1, but showing only galaxies with measured black hole masses. The colour of the symbols indicates the black hole masses within the range given on the colour-bar. MBH values were smoothed using the LOESS method assuming constant errors. For an edge-on projection of the plot highlighting the scatter of MBH, see fig. 7 in van den Bosch (2016). On the right-hand panel, we show a continuous colour surface obtained by interpolating between the LOESS-smoothed MBH values. The red solid line is ZOE as on Fig. 1. Diagonal dashed lines are lines of constant velocity dispersion. Note that the contours depart from the constant velocity dispersion lines for masses Mcrit > 2 × 10¹¹ M⊙.
The most striking feature of these plots is a change in black hole mass (LOESS-smoothed and denoted by colour) from low to high (blue to read), which closely follows the diagonal lines of constant (virial) velocity dispersion. This is, of course, expected from the MBH–σ relation, but the lines of constant velocity dispersion (σ) are actually predicted by the virial mass estimator Re = G ×M*/(5 × σ2), where G is the gravitational constant (Cappellari et al. 2006). To make the trend more obvious, we also interpolate across the region spanned by the galaxies from our sample, predicting the MBH at every position in this plane. This results in a coloured surface plot as the background of the right-hand panel of Fig. 2. The interpolation was done based on the LOESS-smoothed black holes masses of the sample galaxies.
In addition to highlighting the underlying trends, the LOESS method provides a nonparametric regression to a surface, which has the following significance: by using the LOESS smoothing we are, essentially, producing a non-parametric surface, which is defined locally. For the present purpose of investigating the relation between MBH and other galaxy properties, this differs from what has been done previously. Other searches focused on defining a plane within the 3D space of black hole mass, galaxy size and mass (or other parameters) (e.g. Marconi & Hunt 2003; Saglia et al. 2016; van den Bosch 2016). We are, however, now not looking for one plane that best describes all parameters, but allow for a possible local bend of the plane, a change in the orientation of the plane within the space defined by Re, M* and MBH. This LOESS-fitted (non-parametric) surface is essentially shown by the contours in the right-hand panel of Fig. 2.
Cappellari et al. (2013b) showed that the lines of constant velocity dispersion trace the mass concentration and the mass density (or bulge mass fraction) of galaxies below Mcrit ≈ 2 × 10¹¹ M⊙. Therefore, Fig. 2 shows that MBH behaves similarly to a variety of galaxy properties linked to the stellar populations, such as strength of H β and Mgb absorption, optical colour, molecular gas fraction, dynamical M/L, initial mass function normalization, age, metallicity and α-element abundance. This is summarized in Cappellari (2016), using results from Young et al. (2011), Aihara et al. (2011), Cappellari et al. (2013a), Cappellari et al. (2013b) and McDermid et al. (2015). We urge the reader to compare our Fig. 2 with fig. 22 from Cappellari (2016). It is striking that for the majority of galaxies, their black hole masses follow the same trend as galaxy properties arising from star formation. This implies that the black hole growth is strongly related to the growth of the galaxy's stellar populations.
The adaptively smoothed mass–size diagram reveals another striking characteristic. At some point above ≈2 × 10¹¹ M⊙, the black hole masses cease to follow closely the lines of constant velocity dispersion. The iso-colour lines (the lines of constant MBH) change in slope from one that is the same to that of the iso-σ lines, to a steeper one, more closely following the increase in mass. The change is gradual and subtle. It can be seen by following the change in the colour along the lines of constant velocity dispersion, for example for σ = 200 or 250 km s−1. Along those lines, the symbol colours change from yellow to orange (for σ = 200 km s−1) and from orange to red (for σ = 250 km s−1) with increasing mass. This effect is more visible comparing the lines of constant velocity dispersion with the coloured contours2 on the right-hand panel of Fig. 2.
The effect indicates that beyond a certain galaxy mass, the black hole masses do not only follow the changes in velocity dispersion, but also changes in the galaxy mass. The detection of this transition is remarkable, especially when one considers that galaxies for which MBH does not seem to follow iso-σ lines closely span only a factor of about 3 to 4 in galaxy mass. At a given velocity dispersion in that mass range, the observed range of black hole masses is approximately an order of magnitude, but taking into account a realistic factor of 2 in the uncertainties for black hole masses (i.e. depending on the type of data and type of models used, Shapiro et al. 2006; Krajnović et al. 2009; van den Bosch & de Zeeuw 2010; Gebhardt et al. 2011; Walsh et al. 2013), it is not surprising that the effect is marginal and difficult to see in the current data. Furthermore, the visualization of the effect is hindered by the increasing closeness of iso-σ lines and the scarcity of galaxies with masses M* > 1012 M⊙ and size Re > 20 kpc, as will be discussed later. Nevertheless, we will attempt to reproduce the effect by a simple model in the next section, but we first look for it using differently established luminosities and sizes of galaxies.
3.2 Photometry from 2MASS all sky extended source catalogue
The location of galaxies on the mass–size plot depends on the global parameters, which for this study were obtained from van den Bosch (2016). That study used 2MASS (Jarrett et al. 2000) imaging and derived its own sizes and total Ks-band luminosities for all galaxies parametrizing the surface brightness with Sérsic (1968) profiles and using the growth curve approach. One of the reasons for this is that the 2MASS catalogue values are typically found to underestimate the actual sizes and magnitudes. Furthermore, van den Bosch (2016) also used a detailed parametrization of the point spread function to account for the AGNs. Here, we show that it is possible to qualitatively recover the same results by using the 2MASS All Sky Extended Source Catalog (XSC; Jarrett et al. 2000; Skrutskie et al. 2006) data as they are.
We query XSC for the size and extrapolated total magnitudes of galaxies from table 2 of van den Bosch (2016). Of 230 galaxies, the search in XSC returned 228 sources from which we removed galaxies with upper limits on the black hole masses. We follow Cappellari (2013) and use the major axis of the isophote enclosing half of the total galaxy light in J band (XSC keyword j_r_eff), which has a better S/N than the Ks-band equivalent. Following Cappellari et al. (2013a), we define the size as |$R_{\rm e} = 1.61\times \rm j\_r\_eff$| and use the distances from van den Bosch (2016) to convert into physical units.
Galaxy stellar masses (M*) are estimated from the total magnitude (XSC keyword k_m_ext), in two different ways, based on the mass–luminosity and M/L–velocity dispersion relations. In Approach 1, we used the prescription from equation (2) of Cappellari (2013), which relates the Ks-band absolute magnitude with the stellar mass, and is calibrated on the ATLAS3D sample of ETGs, given their 2MASS Ks-band magnitudes and masses from Cappellari et al. (2013a). In Approach 2, we estimated the M/L using equation (24) from Cappellari (2016) and the velocity dispersion from the compilation of van den Bosch (2016). The obtained M/L is then multiplied with the K-band luminosity of galaxies LK, which was obtained from the 2MASS magnitudes using the absolute magnitude of the Sun in K band (M⊙, K = 3.29) from Blanton & Roweis (2007), as well as the distances from van den Bosch (2016). These two approaches produce similar stellar masses, with the mean of the difference of the logarithms equal to 0.07 and the standard deviation of less than 0.1.
In Fig. 3, we show the mass–size diagrams, equivalent to the right one in Fig 2, but now using the sizes and the two different mass estimates described above. We perform the LOESS fit to both distributions, and compare them side by side. We exclude from the fit two galaxies that are significantly below the zone-of-exclusion (ZOE).3 The circles show the distribution of the galaxies with measured black hole masses, while the underlying coloured surface represents the continuous variation of the black hole masses interpolated between the LOESS-smoothed MBH.
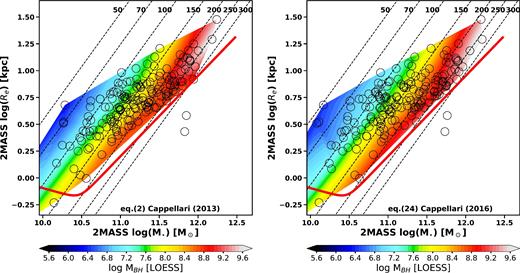
Mass–size diagrams as in Fig. 2, showing galaxies with measured black hole masses, with the galaxy luminosity and size obtained from the 2MASS All Sky Extended Source Catalog. The conversion to mass was achieved following two prescriptions based either on the mass–luminosity relation (Cappellari 2013), or the M/L–velocity dispersion relation (Cappellari 2016), shown on the left- and right-hand panels, respectively (see text for details). The symbols indicate the location of the galaxies in the mass–size plane. Their black hole masses were LOESS-smoothed, and then interpolated into the continuous colour surface, showing the variation of the black hole masses in the mass–size plane, within the range given on the colour-bars. The red solid line is the ZOE. Two galaxies that fall strongly below ZOE, due to the contribution of the active nucleus to the total luminosity, were excluded from the LOESS fit. Diagonal dashed lines are lines of constant velocity dispersion. On both panels it is possible to see the change in the MBH correlation from the velocity dispersion to mass, but the changes are not identical. This indicates the systematic error in the recovery of this effect from the choice of the photometry and conversion to mass.
The panels in Fig. 3 differ from the right-hand panel of Fig. 2, as galaxies have different mass and size measurements. However, panels in Fig. 3 show the same trends seen on Fig. 2. MBH values closely follow the lines of constant velocity dispersion for galaxies with masses below a few times 1011 M⊙, following the behaviour or other properties of galaxies related to star formation (as in fig. 22 of Cappellari 2016). For highest mass galaxies, the black hole masses deviate from the tight relation with the velocity dispersion.4 The departure from a relation with velocity dispersion occurs above a mass a few times 1011 M⊙. It is a remarkable fact that by using the ready catalogue values one can produce the plot qualitatively similar to Fig. 2. This adds weight to the robustness of the result presented in Section 3.1.
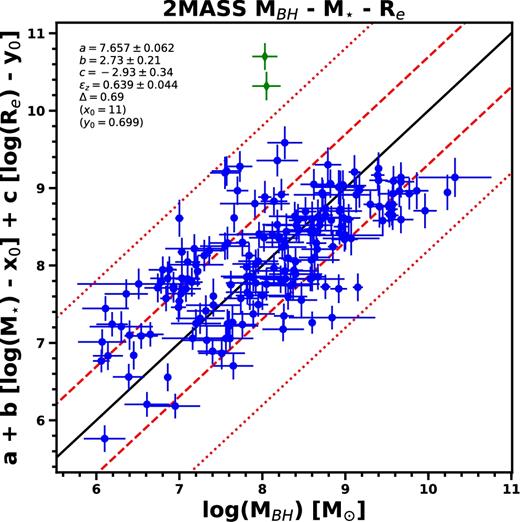
Black hole mass–stellar mass–effective size relation with the best fit of the form as given by equation (1). Photometric properties are taken from 2MASS XSC catalogue and the mass is estimated using the mass–luminosity relation from Cappellari et al. (2013a, equation 2) and distance from van den Bosch (2016). Best-fitting parameters are given in the legend, where Δ is the root-mean-square (rms) scatter of the fit and the intrinsic scatter around the MBH axis is given by εz. Dashed and dotted lines are one and two times the rms scatter, respectively. Green symbols are data points rejected during the fit.
Black hole scaling relations based on 2MASS XSC data.
| Fit | a | b | c | εz | Δ |
|---|---|---|---|---|---|
| Approach 1 | 7.66 ± 0.06 | 2.7 ± 0.2 | −2.9 ± 0.3 | 0.64 ± 0.04 | 0.7 |
| Approach 2 | 7.77 ± 0.05 | 2.6 ± 0.2 | −2.7 ± 0.3 | 0.54 ± 0.04 | 0.6 |
| Fit | a | b | c | εz | Δ |
|---|---|---|---|---|---|
| Approach 1 | 7.66 ± 0.06 | 2.7 ± 0.2 | −2.9 ± 0.3 | 0.64 ± 0.04 | 0.7 |
| Approach 2 | 7.77 ± 0.05 | 2.6 ± 0.2 | −2.7 ± 0.3 | 0.54 ± 0.04 | 0.6 |
Notes. The form of the relation is given in equation (1), while ε is the intrinsic scatter around the MBH axis of the plane and Δ is the root-mean square scatter. For Approach 1, the stellar mass was estimated using XSC k_m_ext keyword, distances from van den Bosch (2016) and the mass–luminosity relation from Cappellari et al. (2013a, equation 2). For Approach 2, the stellar mass was estimated using the M/L–velocity dispersion relation from Cappellari (2016, equation 24), the velocity dispersion compilation from van den Bosch (2016) and luminosity of galaxies, which was converted from XSC k_m_ext values using the absolute magnitude of the Sun in K band (M⊙, K = 3.29) (Blanton & Roweis 2007), and distances from van den Bosch (2016). For both fits, sizes were estimated using XSC keyword j_r_eff, as |$R_{\rm e} = 1.61\times \rm j\_r\_eff$|.
Scatters reported in Table 1 are somewhat higher than those from recent detailed studies of the scaling relations (Saglia et al. 2016; van den Bosch 2016). This is expected as we did not perform any cleaning of XSC values and use approximate errors. It is actually remarkable that the best-fitting parameters are consistent with estimates based on different photometry, and that even the scatters are comparable. Although the Approach 2 fit has a smaller scatter, we, nevertheless, advise usage of the Approach 1 relation, as it does not depend on still mostly uncertain velocity dispersion measurements for galaxies with black hole masses.
4 DISCUSSION
4.1 A toy model for evolution of black hole masses
Here, we want to understand what kind of signature we should expect to observe, based on simple assumptions on the growth process of supermassive black holes. We construct a toy model based on the assumption that below a critical mass of 2 × 10¹¹ M⊙, the black hole mass can be predicted from the MBH–σ relation, while above this mass, the MBH–σ relation is modulated by an additional term depending explicitly on the stellar mass. Our assumption follows the physically motivated distinction in black hole growth. Galaxies with masses less than 2 × 10¹¹ M⊙ follow the channel of gas accretion, bulge growth and quenching, while more massive galaxies are descendents of galaxies formed in intense star-bursts at high redshifts and since then have grown following a channel of dissipation-less (dry) merging.
We plot the results in Fig. 5, showing our model predictions in the mass–size plane. The colour of the contours specifies the variation of black hole masses. We limit the colour scale to the extent for the LOESS-smoothed values of the sample galaxies, which are overplotted as coloured circles in the right-hand panel. The colours specified by the model follow the trend similar to that in Fig. 2. For low-mass galaxies, the black hole mass follows the lines of constant velocities, but black hole masses in galaxies with M* > 2 × 10¹¹ M⊙ and σ > 200 km s−1 start departing from the constant velocity dispersion lines, being higher than expected from the pure MBH–σ relation. The predictive power of our toy model with no free parameters is surprising. It is best visible when the model contours are compared with the LOESS-smoothed black hole masses of the sample galaxies (right-hand panel of the figure), which closely follow the changes in the underlying colour (MBH) of the toy model.
A toy model simulation of MBH on the mass–size plane (left-hand panel) and the same model with overplotted LOESS-smoothed black hole masses (right-hand panel). The toy model MBH is based on a simple prescription in which black hole masses are calculated based on the MBH–σ relation for galaxies less massive than 2 × 10¹¹, and on a MBH–σ modulated by the galaxy mass for higher mass galaxies (see equations 2 and 3). The colour scale of the model is limited to the same range as the LOESS-smoothed black hole masses of the sample galaxies, as shown on the colour bars. The red solid lines show ZOE. Diagonal dashed lines are lines of constant velocity dispersion. We also restricted the model to σ > 70 km s−1 as there are no galaxies that could be compared with in that region.
The toy model also justifies the choice of the critical mass Mcrit = 2 × 10¹¹ M⊙ for the transition between the models. The choice is primarily physically motivated as this mass separates core-less fast rotators from core slow rotators (Krajnović et al. 2013; Cappellari et al. 2013b) and, therefore, it is the mass above which dissipation-less mergers (and likely black hole mergers) start dominating the galaxy (black hole) evolution. The change is gradual, reflecting the dominating contribution of the velocity dispersion even for galaxies above Mcrit = 2 × 10¹¹ M⊙, but also the expectation that only the most massive galaxies will experience a sufficient number of major dry mergers to significantly modify their black hole masses via direct black hole mergers.
Fig. 5 also shows why the dependence of MBH with M* for high masses is difficult to detect. As referred before, the current sample of galaxies with measured black hole masses is tracing only the edges of the galaxy distribution. The large region populated by spiral galaxies and low mass fast rotators is poorly explored. As it is not constrained, we limit the prediction of the toy model to σ > 70 km s−1.
For the detection of the bend in the properties of MBH in the mass–size plane, however, there are two significant regions. The first one is centred on the large (Re > 10 kpc) and relatively less massive galaxies, around the line of constant velocity dispersion of about 150 km s−1. In the nearby Universe, where black hole masses can be measured with dynamical methods, these galaxies are rare and are typically spirals, as shown by the ATLAS3D Survey (see Fig 1). The rarity of these systems currently exclude a possibility for a direct comparison with the proposed model, but further determination of black hole masses using molecular gas kinematics (e.g. Davis et al. 2013; Barth et al. 2016; Davis et al. 2017; Onishi et al. 2017) offer a possible route of exploring this range.
The second region is the branch of the most massive galaxies, with sizes of 20 kpc or more, masses in excess of 1012 M⊙ and σ > 250 km s−1. These galaxies are also rare in the nearby universe, but they are present in the form of brightest cluster galaxies or cD galaxies. In order to improve on the current description of the MBH dependence, more galaxies of the highest masses and largest sizes need to be probed (e.g. McConnell et al. 2011, 2012; Thomas et al. 2016), preferably through dedicated surveys (e.g. Ma et al. 2014).
As mentioned above, the change in the MBH dependence implies that the plane defined by MBH, M* and Re has a change of curvature at high masses. Its significance can be tested by the scatter from a fit defined by equations (2) and (3), in comparison with that from a standard MBH–σ regression. We used a least squares method to fit a linear regression to equation (2) for all galaxies plotted in Fig. 2 regardless of their mass. We then also repeated the same fit using equations (2) and (3) taking into account the mass dependence as described in the equations. We did not take into account the observed uncertainties on any variable, as our intention was not to find the best-fitted relation, but just to compare if there was a decrease in the scatter of the residuals. We compared the standard deviation of the residuals of the fits to these two equations and found that there was no improvement going from the first (Δ = 0.533) to the second (Δ = 0.532) fit. Equivalent results are obtained if instead of fitting we use for α or β values derived in van den Bosch (2016). Therefore, the model described by equations (2) and (3), using the current data base of black hole masses, is not necessarily warranted in terms of providing a better correlation. This is not surprising given that, especially for lower mass galaxies, the total galaxy mass is not always found to be the best predictor of the black hole mass (e.g. Kormendy et al. 2011; Saglia et al. 2016; Savorgnan & Graham 2016), although decomposing galaxies and using masses of certain components is difficult and uncertain (e.g. Läsker et al. 2014; Savorgnan & Graham 2016). Saglia et al. (2016) find that introducing a bivariate correlations with bulge mass and velocity dispersion reduces the overall scatter, even when core ellipticals are removed from the scatter. On the other hand, Savorgnan & Graham (2016), by decomposing galaxies observed at 3.6 μm and using bulge masses, were able to fit different scaling relations for early- and late-type galaxies. Our model, by concentrating on the total mass, however, remains physically motivated, describes the behaviour of the data in the mass–size diagram, and, crucially, it is easily testable with better samples of black hole masses that will likely follow with time.
4.2 Origin for the non-universality of the MBH scaling relations
The transition of the dependence of black hole mass from velocity dispersion (following the trends of other star formation related properties) to galaxy mass supports current ideas on the growth of galaxies and black holes (e.g. Scott et al. 2013). The main processes regulating the growth of galaxies can be separated between those related to the in situ star formation and those related to the assembly of galaxy mass by accretion of elsewhere created stars. Black holes also grow via two types of processes: by accretion of gas or by merging (Volonteri 2010). Accretion of material on to a black hole (i.e. gas originating from gas clouds or from destruction of passing stars) converts gravitational energy into radiation and results in AGNs, or quasars, when the radiation is particularly strong. Moreover, this process influences the growth of both the black hole and the galaxy.
Current models predict that MBH growth by accretion is proportional to σ4 (Fabian 1999; Murray, Quataert & Thompson 2005) or σ5 (Silk & Rees 1998; Haehnelt, Natarajan & Rees 1998), establishing the relations with the host galaxies properties. The scatter of the MBH–σ relation is too high to distinguish between these cases, partially due to difficulties in reducing the systematic errors in measuring black hole masses. However, at least part of the scatter comes from genuine outliers to the relation (see fig. 1 of van den Bosch 2016); special systems that probably did not follow the same evolution as the majority of galaxies (e.g. Ferré-Mateu et al. 2015). The same reservoir of gas that is fuelling AGNs or quasars maintains the star formation responsible for the growth of galaxies. This connection is evident from similar trends in the rates of star formation and black hole accretions with redshift (e.g. Merloni, Rudnick & Di Matteo 2004; Madau & Dickinson 2014), even though the actual growth of the black hole and the build up of the galaxy mass does not have to be concurrent, as the AGN duty cycles are relatively short and responses to the feedback are of different duration.
Accretion models predict that black holes can reach masses of 1010 M⊙ and such black holes have been detected at high redshift quasars (e.g Fan et al. 2001, 2003; Mortlock et al. 2011; Wu et al. 2015). While such objects could explain the population of the highest mass black holes without the need for further growth via merging, they are not very common. Furthermore, there seems to exist a certain upper limit to the black hole growth via accretion of material (Natarajan & Treister 2009). The limit could be initiated by the feedback induced via mechanically or radiatively driven winds from the accretion disc around the black hole (Haehnelt et al. 1998; Silk & Rees 1998; Fabian 1999; Murray et al. 2005). This means that the black holes with masses in excess to these predictions, if they exist, had to continue growing through mergers.
Once when the AGN activity expels all gas, or the galaxy is massive enough and resides in a massive dark halo, which hinders the cooling of gas (and its accretion to the central black hole), the star formation is shut down and the mass growth of galaxies is possible only through dry merging. The accretion of small mass satellites changes the sizes of galaxies (e.g. Naab, Johansson & Ostriker 2009), but a significant increase of galaxy mass is only possible through major (similar mass) mergers. Such mergers are also characterized by eventual collisions of massive black holes (residing in the progenitors), and a fractional growth of black hole mass is equal to the fractional growth of galaxy mass. Still, the contribution of the mergers to the total growth of black holes has to be relatively small. Yoo et al. (2007) showed that mergers can change masses of black holes up to a factor of 2, but this only happens in massive galaxies residing in galaxy clusters. Kulier et al. (2015) confirmed this result showing that the black hole growth through mergers is only relevant for the most massive galaxies (and black holes), while the accretion is the main channel of growth.
The channels of galaxy growth are essentially the same to those for black holes: One is dominated by the consumption of accreted gas in star-bursts and the other is dominated by accretion of mass through dissipation-less mergers. Numerical simulations show that these phases of growth can be separated in time (Oser et al. 2010), where the early phase is characterized by in situ formation of stars fuelled by cold flows (Kereš et al. 2005; Dekel, Sari & Ceverino 2009), while the later phase is dominated by accretion of stars formed elsewhere (Lackner et al. 2012). There is also a critical dependence on the mass of the galaxy as the less massive galaxies grow mostly with in situ star formation, while only massive galaxies significantly grow by late stellar assembly (Rodriguez-Gomez et al. 2016; Qu et al. 2017). This supports the postulations that these are actually separate channels and galaxies follow either one or the other (Cappellari 2016).
The emerging paradigm of the growth of galaxies can be illustrated in the mass–size diagram (see fig. 29 of Cappellari 2016). For low-mass galaxies, the redshift evolution of the distribution of galaxies in the mass–size diagram (van der Wel et al. 2014) is explained by an inside-out growth of small star-forming galaxies. This phase of evolution increases the stellar mass within a fixed physical radius through star formation, until the onset of quenching processes, which happen when galaxies reach a stellar density or a velocity dispersion threshold (van Dokkum et al. 2015). At that moment, galaxies transform from star-forming spirals to fast rotator ETGs (Cappellari et al. 2013b). This is characterized by a structural compaction of galaxies: a decrease in the size, an increase in the concentration parameter (or the increase in the Sérsic index of the light profiles), buildup of the bulge and an increase in the velocity dispersion. While the quenching of star formation and buildup of bulges (or compacting processes) could be diverse (e.g. Young et al. 2014), the main consequence is that galaxy properties related to the star formation history vary, on average, along lines of nearly constant velocity dispersion (e.g. Cappellari et al. 2013b; McDermid et al. 2015; Cappellari 2016). Given that the black hole growth is linked to the gas supply and the growth of the host, it is natural to expect that the black hole mass will closely follow the characteristic velocity dispersion of the host (Silk & Rees 1998; Fabian 1999), where the details of the shape and scatter of the scaling relation depend on the details of the feeding of black holes (e.g. how is the gas transported to the black hole, Anglés-Alcázar et al. 2015, 2017) and the feedback type (e.g. Murray et al. 2005). The evidence shown in Fig. 2 supports a close relation between the star formation and the growth of black holes, as well as the cessation of star-formation and the final MBH.
The picture is somewhat different for the very massive galaxies (M* ≳ 2 × 10¹¹ M⊙). They occupy a special region of the mass–size diagram; they are found along a relatively narrow ‘arm’ extending both in mass and size from the distribution of other ETG (Cappellari et al. 2013b). The narrowness of this arm is indicative of a small range in velocity dispersion that the most massive galaxies span, which is directly linked to the findings of Lauer et al. (2007) and Bernardi et al. (2007) regarding the predictions for MBH based on galaxy σ or luminosity. This on the other hand provides a strong constraint on the processes that form massive galaxies: They have to increase both the mass and the size, but keep the velocity dispersion relatively unchanged. This particular property is characteristic for dissipation-less mergers of similar size galaxies (Barnes 1992; Nipoti, Londrillo & Ciotti 2003; Bezanson et al. 2009; Naab, Johansson & Ostriker 2009). Furthermore, as expected from such mergers, galaxies along this arm in the mass–size diagram have low angular momentum (Emsellem et al. 2011), do not show evidence for containing stellar discs (Krajnović et al. 2011), harbour core-like profiles (Krajnović et al. 2013), are made of old stars (McDermid et al. 2015) and are found at the density peaks of group or cluster environments (Cappellari et al. 2011b; Cappellari 2013; Houghton et al. 2013; Fogarty et al. 2014; Scott et al. 2014; Brough et al. 2017). For massive galaxies, the black hole growth can be linked to the growth of galaxies via dry mergers, and therefore, unlike for the low-mass galaxies, it should be less strongly dependant on the velocity dispersion.
The expectation that growths of black holes and galaxies are connected implies that for star-formation driven build-up of galaxy mass (fuelled by direct accretion of gas or wet dissipational mergers) black holes grow by feeding, while in a merger driven growth of galaxies (via accretion of smaller objects to massive galaxies or major dry mergers), black holes will increase their mass through coalescence with other similar size black holes. The consequence is that at low galaxy masses, the black holes should correlate with the galaxy velocity dispersion, while at high masses, MBH should be more closely related to the galaxy mass. The transition, however, is not sudden, and one can expect a persistence of the MBH–σ relation to high galaxy masses. The reason for this is related to the expectation that high-mass galaxies do not experience many similar mass dry mergers (a few at most, Khochfar & Silk 2009). The significance of this is that only the most massive galaxies will go through a sufficient number of black hole mergers that increase MBH disproportionately from the galaxy velocity dispersion. Therefore, the transition between the two regimes of MBH dependence should be contingent on the galaxy mass, but it should be gradual and only visible at the highest masses, at a point beyond the critical mass of 2 × 10¹¹ M⊙.
There are challenges to this simple scenario already present in the literature. At low masses, there are indications that different galaxy types follow different scaling relations with black hole mass when either bulge mass (luminosity) or effective velocity dispersion are taken into account (Graham & Scott 2013, 2015; Saglia et al. 2016; Savorgnan & Graham 2016). At high masses, Savorgnan & Graham (2015) found that galaxies with most massive black holes reside in galaxies that seem to have undergone only a limited number of dissipation-less mergers (as measured by a proxy of the ratio between the missing light converted into mass and the black hole mass). It is, however, clear that low- and high-mass systems do go through different evolutionary paths, which might also be more diverse at lower masses. Confirming or disproving specific scenarios requires larger samples of galaxies with reliable black hole masses both at low and high galaxy mass range.
5 CONCLUSIONS
We used a recent compilation of black hole measurements, enhanced by a uniform determination of their sizes and total K-band luminosities, to show a variation of black hole masses in a mass–size diagram. As shown by previous studies (Saglia et al. 2016; van den Bosch 2016), black hole masses can be predicted from a combination of M* and Re. In this study, we show two additional characteristics of black hole masses. First, black hole mass closely follows the changes in effective velocity dispersion in the mass–size plane, showing a similar behaviour as almost all properties of galaxies linked with star formation (Cappellari 2016). Secondly, there is tentative evidence that for higher masses (above ≈2 × 10¹¹ M⊙) the black hole mass is progressively more correlated with the galaxy mass than with the velocity dispersion.
We consider a physically motivated toy model in which black holes below a critical galaxy mass grow by accretion and follow MBH–σ relation. Above the critical mass, black holes grow via mergers of similar size black holes. As these mergers are enabled by major dry mergers of galaxies, the black hole growth implicitly depends on the galaxy mass. As the critical galaxy mass, we choose Mcrit = 2 × 10¹¹ M⊙, which also roughly separates the regions in the mass–size plane populated by axisymmetric fast rotators and spiral galaxies from the slow rotators with cores in central surface brightness profiles (Cappellari et al. 2013b).
Assuming a MBH–σ relation for Sérsic galaxies (Graham & Scott 2013, but other relations would also give similar results), our toy model has no free parameters and is able to qualitatively reproduce the trend in the data. While it does not provide a relation with less scatter than the standard MBH–σ relation, it is physical motivated by the current paradigm of galaxy formation. The most massive galaxies, such as the central galaxies in groups and clusters, evolve through a different process than the bulk of the galaxy population. Namely, they experience multiple dissipation-less mergers, of which some (a few) are major and responsible for an equal increase of galaxy and black hole masses (through black hole binary mergers), but the stellar velocity dispersion remain unchanged. The consequence is a departure of black hole masses from the MBH–σ relation for massive galaxies, in particular brightest cluster galaxies and massive slow rotators (with cores). This suggest that there should be a break in MBH–σ and MBH–M* relations, similar to the one reported by Graham & Scott (2013, 2015), although the detection of the break or the need for more than a single power law also depends on the choice of considered galaxies (e.g. including or excluding galaxies of certain bulge type Saglia et al. 2016). Irrespective of the chosen sample, the expected effect of the modulation of the MBH is small as galaxies with suitable mass assembly history are rare and dry major mergers occur infrequently.
The results presented here imply that there is no universal black hole–host galaxy scaling relation, but that it depends on the channel of formation that galaxies follow. The proposed model is simple and can easily be tested, but the black hole sample will have to include a larger number of massive and large galaxies than are currently available. The coming facilities such as JWST and E-ELT will allow us to reach such objects.
ACKNOWLEDGEMENTS
DK acknowledges support from BMBF grant no. 05A14BA1 and thanks Alister Graham for pointing some relevant references in the literature. MC acknowledges support from a Royal Society University Research Fellowship. RMcD is the recipient of an Australian Research Council Future Fellowship (project number FT150100333). DK thanks Jakob Walcher for comments on an earlier version of the manuscript.
Available from https://purl.org/cappellari/software
Note that for σ < 70 km s−1, there is also a change in the shape of the contours, but this effect is based on 3–4 galaxies at the edge of the distribution and is not robust.
These are Ark120 and Mrk0509, both known active galaxies with black hole estimates based on the reverberation mapping. Their 2MASS luminosities are likely biased.
The deviation is also present for σ < 70 km s−1 in the right-hand panel, but it is due to the lack of data points for robust interpolation.
Available at http://purl.org/cappellari/software
REFERENCES
