


ABSTRACT
From near-infrared spectroscopic measurements of the Mg ii emission line doublet, we estimate the black hole (BH) mass of the quasar, SMSS J215728.21–360215.1, as being (3.4 ± 0.6) × 1010 M⊙ and refine the redshift of the quasar to be z = 4.692. SMSS J2157 is the most luminous known quasar, with a 3000 Å luminosity of (4.7 ± 0.5) × 1047 erg s−1 and an estimated bolometric luminosity of 1.6 × 1048 erg s−1, yet its Eddington ratio is only ∼0.4. Thus, the high luminosity of this quasar is a consequence of its extremely large BH – one of the most massive BHs at z > 4.
1 INTRODUCTION
High-luminosity quasars offer important windows into the densest concentrations of baryons at high redshift, as they are likely to reside in well-developed galaxies. The expanding catalogue of such quasars is providing a more complete understanding of black hole (BH) growth in the young Universe (e.g. Inayoshi, Visbal & Haiman 2020)., The search for the rarest, most luminous quasars and the highest mass BHs continues, facilitated by the huge cosmic volume probed by large-area sky surveys.
The Sloan Digital Sky Survey (SDSS; York et al. 2000) was the first data set in which a large sample of quasars at redshift ∼5 and larger were found (Fan et al. 2001, 2003; Pâris et al. 2018). More recently, the 3pi Steradian Survey of the Panoramic Survey Telescope And Rapid Response System (Pan-STARRS; Chambers et al. 2016) has covered more sky and extended into the Southern hemisphere, which the SkyMapper Southern Survey (SMSS; Onken et al. 2019) now covers entirely.
Near-infrared surveys like the UKIRT Infrared Deep Sky Survey (UKIDSS; Lawrence et al. 2007), the UKIRT Hemisphere Survey (UHS; Dye et al. 2018), and the VISTA Hemisphere Survey (VHS; McMahon et al. 2013) are pushing the frontier of discovery earlier in time, to epochs where the quasar light is nearly all redshifted into the infrared.
Finally, the Wide-field Infrared Survey Explorer (WISE; Wright et al. 2010) and the Gaia satellite (Gaia Collaboration et al. 2018) play enormously important roles in differentiating the abundant red, foreground stars from genuine high-redshift quasars.
The photometric and astrometric information from SMSS, WISE, and Gaia has enabled the discovery of the most UV-luminous object currently known: the quasar SMSS J215728.21–360215.1 (hereafter, SMSS J2157; Wolf et al. 2018, 2020).
Based on detailed follow-up, we now report on the BH mass and Eddington ratio of SMSS J2157. Section 2 describes the spectroscopic data and measurements of the emission line and continuum properties. In Section 3, we derive the BH mass and Eddington ratio. Section 4 describes imaging data and their constraints on possible gravitational lensing of SMSS J2157. In Section 5, we discuss the implications of our measurements. Throughout this paper, we adopt a flat cosmology with H0 = 70 km s−1 Mpc−1 and ΩM = 0.3. Photometry is in the AB system, unless otherwise indicated.
2 SPECTROSCOPIC DATA AND ANALYSIS
With the aim of estimating the BH mass in SMSS J2157, we measured the Mg ii emission-line properties as well as the continuum luminosity. Our spectroscopic analysis combined data from two medium-resolution, wide-band spectrographs: Keck/NIRES and VLT/X-shooter.
2.1 Keck/NIRES spectroscopy
First, we obtained a set of spectra with the Near-Infrared Echellette Spectrometer (NIRES) instrument (Wilson et al. 2004) at the 10-m Keck 2 telescope on ut 2018 June 4. NIRES provides near-complete spectral coverage from 0.94 to 2.45 μm, with mean resolving power of R ∼ 2700. The sky was clear, and seeing was 0.8 arcsec. Four 200-s exposures were obtained of SMSS J2157, with an ABBA offset pattern.
The data were reduced using pypeit,1 a python-based spectroscopic data-reduction pipeline (Prochaska et al. 2019, 2020). The flat fielding and the slit tracing were performed using the flat, following the standard technique. The sky background was subtracted in the A–B or B–A frames using the Kelson (2003) recipe, in which the sky is fitted by an optimal b-spline function. Then, the one-dimensional spectra were extracted from the sky-subtracted two-dimensional frames using optimal weighting by inverse variance. The spectral response as a function of wavelength was corrected with spectra of the white dwarf, GD 153, which had been obtained earlier. Finally, the spectra were combined and corrected for telluric absorption by fitting the stacked quasar spectrum to the telluric model grids from the Line-By-Line Radiative Transfer Model2 (Clough et al. 2005). The overall flux normalization was based on the J-band magnitude of SMSS J2157 from VHS Data Release 6: 15.65 ± 0.01 (Vega).
2.2 VLT/X-shooter spectroscopy
We also obtained a set of spectra with the X-shooter instrument (Vernet et al. 2011) on the European Southern Observatory (ESO) 8-m UT2 Kueyen unit of the Very Large Telescope in Service Mode on ut 2019 October 15 (ESO program 0104.A–0410(A); PI: C. Wolf). The X-shooter data provide spectral coverage from 3000 Å to nearly 2.5 μm, with resolving powers of 3200, 5000, and 4300 in the UVB, VIS, and NIR arms of the spectrograph. The two optical spectra used exposure times of 1383 and 1410 s in the UVB and VIS arms, respectively, and were obtained with no binning. The six exposures of the NIR arm used a nodding pattern of 5 arcsec along the slit, with a jitter box size of 0.6 arcsec, and each integration was 480 s long. The data were taken at airmasses between 1.02 and 1.05 in clear but windy weather, and the seeing at 500 nm was estimated to be 1.2 arcsec. The slit widths were 1.6, 1.5, and 1.2 arcsec in the UVB, VIS, and NIR arms, respectively. The spectral response was calibrated by a recent observation of the white dwarf, LTT 7987, obtained as part of the standard X-shooter calibration set regularly updated by ESO. The VIS and NIR arms of the X-shooter spectra were also reduced with pypeit using the same procedure as for the Keck/NIRES spectra. The UVB spectra were reduced with the standard esoreflex workflow (Freudling et al. 2013).3
2.3 Mg ii emission line
In order to combine the NIRES and X-shooter spectra, we scaled the NIRES spectrum to the X-shooter flux level using the median in the overlapping wavelength region. We then computed the stacked spectrum in the overlap region after placing the X-shooter spectrum on to the NIRES wavelength grid of 50 km s−1 pixel−1. The combined X-shooter + NIRES spectrum is shown in Fig. 1.
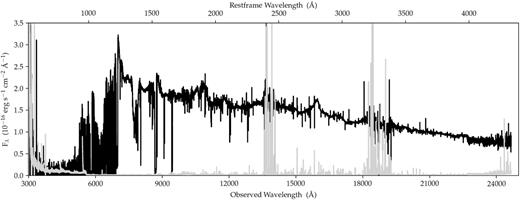
Co-added spectrum of SMSS J2157 from Keck/NIRES and VLT/X-shooter. The black line shows the spectrum while the light grey line indicates the error spectrum. Blueward of 1 μm, only X-shooter contributes to the spectrum. The top axis indicates the restframe wavelength.
Using the method described by Shen et al. (2011), the spectrum was fitted with a multicomponent model that included a power-law continuum, an iron emission-line template (from Vestergaard & Wilkes 2001), and a Mg ii profile consisting of a single narrow Gaussian emission line and two broad Gaussian emission lines. The iron template was broadened with a Gaussian of full width at half-aximum (FWHM) = 5000 km s−1. The power-law continuum blueward of Mg ii is well fitted as (λ/λ0)α with α ≈ −0.65.
The broad Mg ii line, modelled by the pair of Gaussians, was found to have a FWHM of 5720 ± 570 km s−1, where the error is dominated by the uncertainties in the amplitudes of the spectral components underneath the emission line. The spectrum near Mg ii and the best-fitting model are shown in Fig. 2. Broad absorption line (BAL) components are visible within the C iv and Ly α line profiles,4 but Mg ii is not significantly affected by such features.
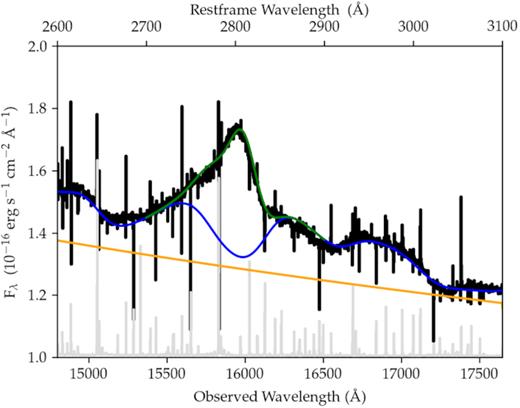
Spectral fit in the region around the Mg ii emission line, showing the co-added, rebinned spectrum (black), the power-law (PL) fit (orange), the PL + Fe ii template fit (blue), and the PL + Fe ii template + Mg ii emission line fit (green). The error spectrum is plotted in grey, with an additive offset of 1 × 10⁻¹⁶ erg s−1 cm−2 Å. The top axis indicates the restframe wavelength. The Mg ii FWHM is 5720 ± 570 km s−1.
The Mg ii emission line in bright quasars has been found to reliably trace the systemic redshift, with a small mean offset of −57 km s−1 and a scatter of 205 km s−1 (Shen et al. 2016). Thus, we refine the systemic redshift of SMSS J2157 to be 4.692, within the bounds estimated by Wolf et al. (2018). The revised redshift corresponds to a Universe age of 1.247 Gyr, some 20 Myr older than from the original redshift estimate of z = 4.75.
2.4 Continuum luminosity
From the photometrically calibrated near-IR spectroscopy, we are able to obtain a luminosity estimate for SMSS J2157 that is free from emission line contributions.
We find that λLλ(3000 Å) = (4.7 ± 0.5) × 1047 erg s−1, where the uncertainty is estimated by allowing for a reasonable range of Fe ii emission. This luminosity is consistent with the value in the discovery paper, where the effects of removing the emission-line contribution and basing the overall flux calibration on the more precise VHS J-band photometry nearly cancel. The revised absolute AB magnitude at 300 nm is |$M_{300,\rm AB}=-30.1$|. Wolf et al. (2018) identified PMN J1451–1512 at z = 4.76 as the next most luminous quasar, and we find that it remains ≈0.5 mag fainter than SMSS J2157 in |$M_{300,\rm AB}$|. Additional z ∼ 4 quasars of similar luminosity have recently been discovered,5 i.e. PS1 J111054.69–301129.9 (Yang et al. 2019) and PS1 J212540.96–171951.4 (Schindler et al. 2019). However based on their near-IR photometry, we find that neither of these quasars are more luminous at rest frame 3000 Å than SMSS J2157, which remains the most UV-luminous object known at present.
We can also estimate bluer continuum luminosities from the spectrum. We find values of λLλ(1350 Å) = (3.5 ± 0.4) × 1047 erg s−1 and λLλ(1450 Å) = (3.6 ± 0.4) × 1047 erg s−1. The discovery paper derived λLλ(1450 Å) = 4.5 × 1047 erg s−1 (here, revised after applying the new distance correction) from z-band VST ATLAS photometry (Shanks et al. 2015). As the spectroscopic estimates make the assumption that slit losses and flux calibration are consistent across the whole wavelength range, which may not be the case, and the photometric estimate includes contribution from the emission lines (especially C iv), we expect that the best estimate of λLλ(1450 Å) lies somewhere between these values.
3 BH MASS AND EDDINGTON RATIO
When using Mg ii to estimate BH masses, one must ensure that the line properties are amenable to this purpose. Due to a dearth of high-quality Mg ii reverberation mapping results, such BH-mass estimates rely on correlations with the large sample of BH masses from H β reverberation. Trakhtenbrot & Netzer (2012) show that Mg ii FWHM values smaller than 6000 km s−1 accurately trace the H β FWHM. This lends a degree of confidence to our ability to estimate the BH mass from the Mg ii FWHM of 5720 km s−1 for SMSS J2157.
Furthermore, Onken & Kollmeier (2008) characterized a bias in Mg ii FWHM estimates as a function of Eddington ratio, and presented an empirical correction that represents the FWHM better and traces the BH mass more robustly. For SMSS J2157, the Mg ii FWHM falls in the most reliable part of the FWHM distribution, with no mean bias and a systematic FWHM error of 0.13 dex. We updated this check with the FWHM data from SDSS DR7Q (Shen et al. 2011), which shows that the 1 800 quasars having Mg ii FWHMs within the errorbars of our measured value have a median broad-H β FWHM of 6280 km s−1, a difference of less than 1σ, and that only 10 per cent have broad-H β FWHMs so low as to shift the resulting BH mass down by a factor of two.
Because of the BAL component, we cannot compare a C iv-based BH-mass estimate for SMSS J2157 to the value obtained from Mg ii.6 However, with the low background levels afforded by the James Webb Space Telescope, it will be possible to obtain high-S/N spectra at H β (redshifted to 2.77 μm, inaccessible from ground-based facilities) and H α (3.37 μm) in very short exposures (∼1 min) with two of the medium-resolution gratings.
4 IMAGING DATA AND ANALYSIS
We also obtained new imaging data to place constraints on any magnification of the quasar image by gravitational lensing, as this would bias both the BH mass and the Eddington ratio estimates, increasing them by different factors. Here, we use J-band images of SMSS J2157 from the slit-viewing camera of Magellan/FIRE, and we analyse publicly available optical images from the Blanco Imaging of the Southern Sky (BLISS) Survey.
4.1 Magellan/FIRE Near-IR imaging
A series of six 30-s J-band images were obtained with the slit-viewing camera of the Folded-port InfraRed Echellette (FIRE) instrument (Simcoe et al. 2013) at Magellan’s 6.5-m Walter Baade Telescope. The dithered images have a plate scale of 0.147 arcsec pixel−1, and were shifted and co-added, using the centroid of the quasar as the positional reference. Because of the highly variable illumination of the slit viewing camera, it is difficult to flat-field the image, resulting in a large background gradient. However, this does not affect our ability to detect possible extended or multiple images of SMSS J2157.
For comparison, we also retrieved archival J-band imaging from VHS.7 While the depth of the co-added FIRE image is similar to the VHS image of SMSS J2157, the plate scale of FIRE is half that of the VIRCAM instrument used by VHS, and the seeing of 0.6 arcsec is better than the seeing of 0.95 arcsec in the VHS image.
The FIRE field of view is approximately 1 × 1 arcmin, and from the wider VHS image, only one additional source is expected to appear in the combined FIRE image. That faint source (J = 20.36 mag per VHS8) has a signal-to-noise ratio (S/N) of ≈8, indicating a 5σ detection threshold of ∼21.0 mag.
4.2 Archival optical imaging data
In addition to the photometric data listed in Table 1 of Wolf et al. (2018), we retrieved deep optical imaging data from the BLISS Survey (see details in Mau et al. 2019) via the Image Cutout service of the ASTRO Data Lab.9 BLISS uses the Victor M. Blanco 4-m telescope and the Dark Energy Camera (DECam) instrument (Flaugher et al. 2015), which has a plate scale of 0.27 arcsec pixel−1, and has acquired data in the SDSS griz filters. The deepest of the exposures available for SMSS J2157 is a 90-s i-band image from ut 2017 July 2. The estimated seeing was 1.0 arcsec, and the 5σ detection limit was about 23.3 mag. Here, we use the sky-subtracted, spatially resampled image from the NOAO Data Lab.
4.3 Constraints on gravitational lensing
Strong gravitational lensing typically operates on angular scales of the order of 1 arcsec and 1 arcmin for galaxies and galaxy clusters, respectively, and could magnify SMSS J2157, thus causing an overestimate of its luminosity and BH mass. Here, we explore constraints on that scenario.
The galaxy luminosity function at z = 1−1.5, where the gravitational lensing likelihood peaks for sources at z = 4−5, has a rest-frame V-band (observed-frame J-band) |$M^{*}_{V}$| value of −22.2 mag, corresponding to J ≈ 21.5 mag (Marchesini et al. 2012). Thus, our J-band imaging is expected to reach about 0.5 mag brighter than the |$M^{*}_{V}$| value for the galaxy redshifts most likely to bias our luminosity estimate. Within the FIRE J-band image (Fig. 3, left-hand side), the only two sources detected are those expected from the existing VHS data set (SMSS J2157 and the fainter source, 12 arcsec away). With only one additional source in the field of view, distortions from a point-source profile for SMSS J2157 cannot be tightly constrained from the FIRE image, but there is no indication of multiple peaks in the spatial distribution. Thus, no candidate lenses are identified in the J-band data.
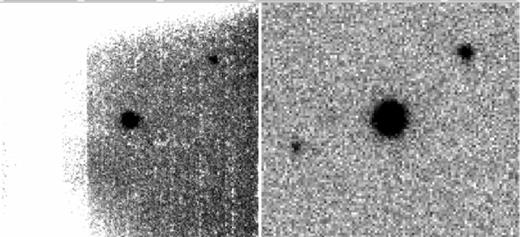
30 × 30 arcsec image cutouts around SMSS J2157 in the J-band (left-hand side, from Magellan/FIRE) and the i-band (right-hand side, from BLISS). In both images, SMSS J2157 has a point-source spatial profile, with no indications for multiple images or a lensing galaxy.
For sources at z = 1.5, the BLISS i-band image probes 3000 Å rest-frame emission, and we can obtain an estimate of the sensitivity to potential lensing galaxies from the 1500 Å luminosity function (e.g. Oesch et al. 2010). With an |$M^{*}_{1500}$| around −20 mag, the BLISS images probe to about 1 mag above |$M^{*}_{1500}$|, here with a particular sensitivity to star-forming galaxies at that redshift. The BLISS image (Fig. 3, right-hand side) shows the two sources from the J-band image (SMSS J2157 and the fainter source at i = 21.3 mag), and one additional source, 11 arcsec from SMSS J2157. The new source is also faint, with i = 22.3 mag. As with the J-band image, there are no indications of the presence of lensing galaxies, and the spatial profile of SMSS J2157 exhibits no signatures of being anything other than a point source.
Using the BLISS i-band image, we can constrain the presence of an unresolved second image of SMSS J2157 arising from strong gravitational lensing. We adopt a simple singular isothermal sphere lens model at z = 1.5, which makes predictions for the magnification ratio between the two images, as well as the total magnification, for a given angular offset between lens and source (in units of the Einstein radius). Thus, for a given magnification ratio, we aim to determine the maximum offset between the two images of SMSS J2157 that could go undetected, which we take as being twice the Einstein radius. In detail, we shift the image by an integer number of pixels in the east–west direction, co-add the shifted image to the original with a given value of the magnification ratio, and run Source Extractor (Bertin & Arnouts 1996) on the resulting image. The shape parameters for the doubly imaged sources are then compared to the distribution of object shapes from the original image, including SMSS J2157.
For image magnification ratios up to 5, which imply a total magnification of the source of a factor of 3 or more, we find that the Einstein radius must be no larger than 1 pixel (0.27 arcsec), or else the real shape parameters of SMSS J2157 become a clear outlier in the flux–FWHM plane. This implies a lens mass of ≲ 4 × 10¹⁰ M⊙, likely having an associated stellar mass less than ∼108 M⊙ (e.g. Girelli et al. 2020). Photometric detection of such a small galaxy, similar in scale to the Large Magellanic Cloud (Zivick et al. 2018), would be extremely challenging at z = 1.5, particularly with a coincident luminous quasar. At higher magnification ratios, where the second image is de-magnified, the limits on the Einstein radius are progressively weaker, but the effect of the lensing is also less substantial.
Within the SMSS imaging data, we can look for wavelength-dependent position shifts as another indicator of a foreground lensing galaxy. What we find is that, amongst the filters having detections of SMSS J2157 (g, r, i, z), the average positions vary by less than the typical systematic rms shift between the SMSS coordinates and those from Gaia DR2 (0.16 arcsec), again providing no evidence of a lensing galaxy.
From the spectroscopic data, one might also hope to see evidence of absorption from any interstellar or circumgalactic gas in the vicinity of a foreground lens. The most common such absorption is from Mg ii, but at a redshift of z ≲ 1.5, the associated spectral features would appear blueward of ∼7000 Å, which is already so heavily affected by absorption associated with SMSS J2157 that identifying foreground lines is intractable.
Finally, gravitational lensing would enhance the Eddington ratio by approximately the square root of the magnification. However, as noted above, the measured Eddington ratio of ≈0.4 is not significantly larger than that observed for other luminous quasars.
For any given quasar, one cannot exclude the possibility of a precisely aligned low-mass lens, but as the sample of high-redshift quasars grows, a better understanding of the luminosity function and the BH-mass function will help to reveal significant outliers. In conclusion, none of the imaging data sets available raise a concern about strong gravitational lensing of SMSS J2157, and we currently have no reason to believe that the luminosity (and consequently, both the BH mass and the Eddington ratio) are overestimated
5 DISCUSSION
The measured Eddington ratio of 0.4 places SMSS J2157 within the typical distribution of luminous quasars (e.g. Kollmeier et al. 2006; Kozłowski 2017), implying that the extreme nature of its luminosity is a consequence of its extraordinarily high BH mass.
In order to make fair comparisons with the other z > 4 quasars having BH-mass estimates of ≳1010 M⊙, we first recalculate their masses with the same methodology and scaling relations as above. For J0306+1853 at z = 5.363, the Mg ii and L3000 data of Wang et al. (2015) give a BH-mass estimate of 2.0 × 10¹⁰ M⊙, Lbol = 7.2 × 1047 erg s−1, and an Eddington ratio of 0.3. For J0100+2802 at z = 6.3, the measurements of Wu et al. (2015) give a BH mass of 2.1 × 10¹⁰, Lbol = 1.1 × 1048 erg s−1, and an Eddington ratio of 0.4. As with SMSS J2157, any systematic errors significantly outweigh the statistical uncertainties for the BH mass and Eddington ratio, as evidenced by the factor of ∼2 change in those values simply by adopting different scaling relations.10
What these measurements suggest is that between z = 6.3 and z = 4.692, from a Universe age of 0.86–1.25 Gyr, the accretion properties of the most massive BHs do not change substantially. As that time span is of the order of 10 Salpeter (e-folding) times, and the mass difference is only ∼50 per cent, it is the highest redshift BH of this set that places the strongest constraint on the seed mass and early growth rate of these immense BHs. In fact, the less-massive BHs discovered at z > 7 (Mortlock et al. 2011; Bañados et al. 2018) place stronger limits still, and continue to challenge models (Amarantidis et al. 2019). However, moving beyond individual, extreme objects, we believe that fundamental progress in understanding the early growth of supermassive BHs will ultimately come from obtaining large and complete samples.
ACKNOWLEDGEMENTS
We thank the referee for their comments, all helpful. We thank Indrajit Patra for prompting a more thorough check of other luminous quasars, and Xue-Bing Wu for looking into the LAMOST Quasar Survey data. We acknowledge support from the Australian Research Council through Discovery Project DP190100252. XF and JY acknowledge support from NASA ADAP grant NNX17AF28G S003 and US NSF grant AST 19-08284. FW acknowledges support by NASA through the NASA Hubble Fellowship grant#HST-HF2-51448.001-A awarded by the Space Telescope Science Institute, which is operated by the Association of Universities for Research in Astronomy, Incorporated, under NASA contract NAS5-26555. The national facility capability for SkyMapper has been funded through ARC LIEF grant LE130100104 from the Australian Research Council, awarded to the University of Sydney, the Australian National University, Swinburne University of Technology, the University of Queensland, the University of Western Australia, the University of Melbourne, Curtin University of Technology, Monash University, and the Australian Astronomical Observatory.
We thank the support staff at Keck, Magellan, and the VLT. This paper includes data gathered with the 6.5-m Magellan Telescopes located at Las Campanas Observatory, Chile. This paper is based, in part, on observations made with ESO Telescopes at the La Silla Paranal Observatory under programme ID 0104.A–0410(A). Some of the data presented herein were obtained at the W. M. Keck Observatory, which is operated as a scientific partnership among the California Institute of Technology, the University of California, and the National Aeronautics and Space Administration. The observatory was made possible by the generous financial support of the W.M. Keck Foundation. The authors wish to recognize and acknowledge the very significant cultural role and reverence that the summit of Mauna Kea has always had within the indigenous Hawaiian community. We are most fortunate to have the opportunity to conduct observations from this mountain.
This project used data obtained with the Dark Energy Camera (DECam), which was constructed by the Dark Energy Survey (DES) collaboration. Funding for the DES Projects has been provided by the US Department of Energy, the US National Science Foundation, the Ministry of Science and Education of Spain, the Science and Technology Facilities Council of the United Kingdom, the Higher Education Funding Council for England, the National Center for Supercomputing Applications at the University of Illinois at Urbana-Champaign, the Kavli Institute for Cosmological Physics at the University of Chicago, Center for Cosmology and Astro-Particle Physics at the Ohio State University, the Mitchell Institute for Fundamental Physics and Astronomy at Texas A&M University, Financiadora de Estudos e Projetos, Fundação Carlos Chagas Filho de Amparo à Pesquisa do Estado do Rio de Janeiro, Conselho Nacional de Desenvolvimento Científico e Tecnologico, and the Ministerio da Ciência, Tecnologia e Inovação, the Deutsche Forschungsgemeinschaft, and the Collaborating Institutions in the Dark Energy Survey. The collaborating institutions are Argonne National Laboratory, the University of California at Santa Cruz, the University of Cambridge, Centro de Investigaciones Enérgeticas, Medioambientales y Tecnológicas-Madrid, the University of Chicago, University College London, the DES-Brazil Consortium, the University of Edinburgh, the Eidgenössische Technische Hochschule(ETH) Zürich, Fermi National Accelerator Laboratory, the University of Illinois at Urbana-Champaign, the Institut de Ciències de l’Espai (IEEC/CSIC), the Institut de Física d’Altes Energies, Lawrence Berkeley National Laboratory, the Ludwig-Maximilians Universität München, and the associated Excellence Cluster Universe, the University of Michigan, the NSF’s National Optical-Infrared Astronomy Research Laboratory, the University of Nottingham, the Ohio State University, the OzDES Membership Consortium, the University of Pennsylvania, the University of Portsmouth, SLAC National Accelerator Laboratory, Stanford University, the University of Sussex, and Texas A&M University. Based on observations at Cerro Tololo Inter-American Observatory, NSF’s National Optical-Infrared Astronomy Research Laboratory (NSF’s OIR Lab Prop. 2017A-0260; PI: M. Soares-Santos), which is managed by the Association of Universities for Research in Astronomy (AURA) under a cooperative agreement with the National Science Foundation. This research uses services or data provided by the Astro Data Lab at NSF’s National Optical-Infrared Astronomy Research Laboratory. NSF’s OIR Lab is operated by the Association of Universities for Research in Astronomy (AURA), Inc. under a cooperative agreement with the National Science Foundation. This paper uses data from the VISTA Hemisphere Survey ESO programme ID: 179.A-2010 (PI. McMahon). The VISTA Data Flow System pipeline processing and science archive are described in Irwin et al. (2004), Hambly et al. (2008), and Cross et al. (2012). We acknowledge use of the Ned Wright’s web-based Cosmology Calculator (Wright 2006). This work made use of Jupyter notebooks (Kluyver et al. 2016).
Footnotes
The BAL features revealed in greater detail by the new, high-S/N spectra make it difficult to assess whether SMSS J2157 meets the criteria of Diamond-Stanic et al. (2009) for being a weak-lined quasar.
We note that LAMOST J144757.18+231839.8, catalogued by Yao et al. (2019), has been removed from the LAMOST Quasar Survey Catalogue following a reclassification of its spectrum as being of ‘unknown’ type (X.-B. Wu, private communication).
Other emission lines have sometimes been used for BH mass estimates, including C iii] λ1909 Å (e.g. Shen & Liu 2012; Karouzos et al. 2015). Because the C iii] line also exhibits absorption within the line profile, and because such BH measures have been less well-calibrated, we refrain from making a C iii] estimate here.
Images and catalogues obtained from the VISTA Science Archive: http://horus.roe.ac.uk/vsa/
We convert the VHS photometry from Vega magnitudes to the AB system by adding 0.91 mag (Blanton & Roweis 2007).
We omit a small number of high-mass, high-redshift BHs from this discussion because of smaller masses indicated by Mg ii (Yi et al. 2014; Ghisellini et al. 2015), conflicting mass estimates from emission lines other than Mg ii (Zuo et al. 2015), or a lack of Mg ii-based estimates (Jiang et al. 2007; Jun et al. 2015; Jeon et al. 2017; Shen et al. 2019). Given the primacy of the systematic errors, adding a further layer of systematics to enable such mass comparisons is unlikely to be informative.
REFERENCES
Author notes
NASA Hubble Fellow.
