


ABSTRACT
The Blanco Dark Energy Camera (DECam) Bulge survey is a Vera Rubin Observatory (LSST) pathfinder imaging survey, spanning ∼200 deg2 of the Southern Galactic bulge, −2° < b < −13° and −11° < l < +11°. We have employed the CTIO-4 m telescope and the DECam to image a contiguous ∼200 deg2 region of the relatively less reddened Southern Galactic bulge, in SDSS u + Pan-STARRSgrizy. Optical photometry with its large colour baseline will be used to investigate the age and metallicity distributions of the major structures of the bulge. Included in the survey footprint are 26 globular clusters imaged in all passbands. Over much of the bulge, we have Gaia DR2 matching astrometry to i ∼ 18, deep enough to reach the faint end of the red clump. This paper provides the background, scientific case, and description of the survey. We present an array of new reddening-corrected colour–magnitude diagrams that span the extent of Southern Galactic bulge. We argue that a population of massive stars in the blue loop evolutionary phase, proposed to lie in the bulge, are instead at ∼2 kpc from the Sun and likely red clump giants in the old disc. A bright red clump near (l, b) = (+ 8°, −4°) may be a feature in the foreground disc, or related to the long bar reported in earlier work. We also report the first map of the blue horizontal branch population spanning the Blanco DECam Bulge Survey field of regard, and our data do not confirm the reality of a number of proposed globular clusters in the bulge.
1 INTRODUCTION
1.1 Survey motivation
The goal of Blanco DECam bulge survey (BDBS) is to use the Dark Energy Camera (DECam; Flaugher et al. 2015) to produce an optical multiband map of the Galactic bulge South of the Galactic plane, where extinction is significantly lower and more uniform than in the North. The Northern bulge still can be studied, and our team is proposing to do so. However, the lower extinction of the Southern bulge has meant that nearly all spectroscopic and imaging surveys have focused on that region. Hence, this pathfinder survey emphasizes the Southern bulge.
The VVV survey has mapped the bulge and disc in the near-infrared, however, BDBS uses optical colours including the u and Y bands. These choices result in a uniformly calibrated optical data set obtained with a single instrument. Further, the colour baseline enables far superior metallicity estimates, compared with infrared surveys. The ultimate science aim is to also exploit the Gaia data base and other approaches to separate the foreground disc population from the bulge. In Johnson et al. (2020), we report metallicities for red clump (RC) giants from the (u − i)0 colour and we ultimately aim to statistically subtract the foregound disc population so that the bulge main-sequence turn-off (and population age) can be constrained over the full field. Hence, there is the real possibility of mapping the metallicity and age as a function of position in the bulge, including the X-structure. This will provide important constraints on the formation history of the bulge.
Galaxy bulges and spheroids account for most of the light from luminous galaxies, and any understanding of galaxy evolution must include comprehension of their formation process (e.g. Rich 2013; McWilliam 2016; Barbuy, Chiappini & Gerhard 2018). The bulges hosted by disc galaxies appear to be divided into spheroidal bulges and those that are barred or disc-originated or ‘secular’ Kormendy & Kennicutt (2004); the evidence strongly suggests our bulge is disc-originated (see e.g. Shen et al. 2010). In principle, the Galactic bulge should be the calibrator for studying bulges across cosmic time, but the high extinction, extreme crowding, superposition of stellar populations along the line of sight, and an intrinsically complex environment, render the bulge observationally complicated. Since 2000, observations have conclusively shown that the majority of mass in the bulge is in the bar, e.g. (Shen et al. 2010), but many problems in the formation and chemical evolution of the bulge remain both unsolved and debated. Nonetheless , the Milky Way bulge is ∼100 times closer than the nearest bulge hosted in a comparable galaxy, M31. Consequently, it is possible to measure proper motions, radial velocities, compositions, and eventually parallaxes for stars spanning the HR diagram from dwarfs to giants; such observations are unlikely to be possible for decades, in the bulge of M31.
The grasp of the the DECam represents a dramatic advance in imaging area over prior facilities, and is within striking distance of the LSST capabilities. At the time the survey was conceived, the authors appreciated that many significant problems in the bulge required uniformly calibrated photometry spanning a wide area. Further, such photometry should include the UV/optical colours that were not observed in the VVV study. Optical colours would offer the prospect of a wide colour baseline that is better applicable to the derivation of photometric metallicities. As was shown in the early work of Frogel, Whitford & Rich (1984), the infrared J − K colour has an insufficient baseline to yield good enough constraints on metallicities to make meaningful conclusions about the distribution function. Our aim is to use the photometry of millions of stars to replace the coarse metallicity map derived from J − K photometry (Gonzalez et al. 2012) with maps employing the wider colour baseline of an optically derived metallicity distribution function, spanning as much of the bulge/bar as possible.
Several specific, significant developments motivated this survey. First, the discovery of an X-shaped structure in the Southern Galactic bulge (McWilliam & Zoccali 2010; Nataf et al. 2010) revealed especially clearly in the analysis of Wegg & Gerhard (2013). Widespread, yet widely varying claims for multimodality in the bulge abundance distribution is a second driver. Multimodality was first reported by Hill et al. (2011), and claims for multimodality in the distribution of [Fe/H], with consequent interpretation, have blossomed (see e.g. table 2 and fig. 4 in Barbuy et al. 2018). The most extreme claim for multimodality is presented in Bensby et al. (2017), which argues for five distinct peaks in the abundance distribution. One might reasonably expect such an extended and complicated star formation history to be problematic, even in terms of the relatively limited observations to date. If due to multiple starbursts, one might reasonably expect to find the more metal rich populations to be strongly enhanced in s-process elements that would be produced in multiple generations of asymptotic giant branch stars; no such enhancements are observed in the bulge (Johnson et al. 2014; McWilliam 2016). Ness et al. (2013) also argues for five peaks of varying amplitude in the bulge metallicity distribution, with more metal-rich stars concentrated towards the plane. Their analysis presents a deconvolution of the metallicity distribution into multiple Gaussian peaks that attempts to describe components of the bulge metallicity distribution that vary with varying amplitudes as a function of distance from the plane.
There is also some significant range of opinion on how populations in the bulge are spatially distributed. In addition to Ness et al. (2013), Zoccali et al. (2017) finds a sharp demarcation in the spatial distribution at [Fe/H] ∼ 0; more metal-rich stars are confined strongly to the plane, while stars with [Fe/H] < 0 are found to follow a spheroidal distribution. The physical cause for such a dramatic change in spatial distribution at the somewhat arbitrary point of solar metallicity is not immediately obvious. On smaller scales, Schultheis et al. (2019) argue that the central 50 pc experiences a spike in the fraction of stars with [Fe/H] > 0. One of the key science goals of BDBS is to apply the photometric metallicities derived for millions of stars to test these and similar conclusions, which have been drawn from a range of spectroscopic surveys that have relatively modest numbers of stars with derived abundances. Further, by spanning a large area, we are able to include the lower extinction areas of the bulge and to match significant numbers of our stars to the Gaia DR2 catalogue (Gaia Collaboration, Brown et al. 2020). As described here and in Johnson et al. (2020), BDBS also attains the main-sequence turn-off. With future proper motion cleaning or foreground population subtraction, we may also be able to use the main-sequence turn-off to map the age of the bulge as well.
The age of the bulge has been controversial for decades. Early constraints came from the presence of RR Lyrae stars (Baade 1951) linking at least part of the bulge population to old, metal-poor globular clusters. The early discovery of large numbers of M giants in the direction of the Galactic centre as described in Blanco (1965) led to a prescient classification of the bulge at the landmark 1957 Vatican symposium on Stellar Populations as ‘old disc’ population. As described earlier, Victor and Betty Blanco used the capabilities of the CTIO 4 m telescope to study the Mira variable population in landmark early bulge studies. The earliest CCD photometry from the 4 m telescope was obtained as the results of proposals by the author in the early 1980s; Terndrup, Rich & Whitford (1984), Terndrup (1988) revealed an apparently old main-sequence turn-off in the Plaut −8° field, but were significantly confused by the foreground disc population; a plausible old main-sequence turn-off was detected only at the higher latitude −8° and −10° fields where foreground contamination is an issue. The problem of the serious overlap of the foreground disc and the bulge main-sequence turn-off was finally solved by statistically subtracting the disc population. Ortolani et al. (1995) used this approach along with HST photometry and direct comparison with the luminosity function of the globular cluster NGC 6553 to make a convincing case for an old bulge population. Clarkson et al. (2008), following Kuijken & Rich (2002), subsequently used proper motion separation to reveal clearly an old main-sequence turn-off in a low latitude bulge field. Renzini et al. (2018) employed the same method to show that the luminosity functions of both metal-poor and metal-rich stars in the bulge are most consistent with a 10 Gyr old population. Analysis of the VVV survey data supports further an old Galactic bulge (Surot et al. ), yet the age problem remains, with significant tension between the main-sequence turn-off measurements and derived ages for microlensed dwarfs.
While the cumulative evidence from studies of the luminosity function and proper motion cleaned main-sequence turn-off are compelling, analysis of microlensed bulge dwarfs appears to tell a different story. Bensby et al. (2017) reports photometric ages for 99 microlensed dwarfs in the bulge, and |$\sim 50{{\ \rm per\ cent}}$| of those above Solar metallicity are found to be younger than 8 Gyr based on a self consistent spectroscopic analysis from high-resolution spectra. Such a significant population of intermediate age, metal-rich stars might be expected to spawn significant numbers of luminous evolved stars. The bulge hosts a large population of Mira variables with period >400 d; these are attributed to an intermediate age population (Catchpole et al. 2016). However, the demarcation between old and intermediate age populations at the 400 d period mark is not clearly derived from any definitive theoretical underpinning or unequivocally accepted observation and inferences on population age might be metallicity dependent.
Although the optical colours we use in BDBS are more sensitive to reddening, they are also more sensitive to age and metallicity; consequently the wide field optical survey of BDBS is an excellent complement to the pencil beam surveys of HST. We believe that the metallicity sensitivity may give us a different perspective on the overall age problem, compared to the infrared age derivation based on VVV (Surot et al. 2019).
BDBS is not the first wide field optical survey of the bulge. In addition to the wide field surveys of Pan-STARRS (Chambers et al. 2016) and DECaps (Schlafly et al. 2018), there has been the pioneering work of Saha et al. (2019) in Baade’s Window. However, we emphasize that the power of our study is that it covers the full range of optical passbands and spans essentially the range of galactic latitude and longitude comprising the Southern bulge, hence including much of the bulge’s mass (see e.g. Launhardt, Zylka & Mezger 2002). Our field of regard includes the complete footprints of many major spectroscopic surveys, beginning with the Bulge Radial Velocity Assay Rich et al. (2007), Kunder et al. (2012) and ARGOS (Ness et al. 2013; figs 1–3). Further, we have taken pains to calibrate the full range of the stellar population from the lower main sequence to red giant branch (RGB) tip, and we employ point spread function (PSF)-fitting in the photometry. The details of these advances are given in the companion paper (Johnson et al. 2020).
1.2 Early survey science papers
Our team is pursuing a set of early survey science that is based on the data set as it currently stands, without complete reductions for the Sgr Dwarf or off-axis disc fields. We have calibration images for the Sgr Dwarf spheroidal, and the off-axis disc fields will be used to statistically correct for contamination by the foreground disc population, important for studies of the age of the bulge.
Paper I (this paper) gives an overview of the survey and early science results, while Paper II (Johnson et al. 2020) reports on a new method to derive metallicity from RC giants using the (u − i)0 colour, and illustrates the use of the BDBS data set to explore globular clusters. The candidate dwarf galaxy FSR1758 is shown to be globular cluster. Paper III (Johnson et al. in preparation) will address the spatial structure of the RC giant population as a function of metallicity. The BDBS collaboration is engaged in preparing papers on the 26 globular clusters in the BDBS footprint (presented next in Table 2) and kinematics, based on the cross-match between BDBS and Gaia DR2. Our goal is to undertake a public data release sometime in 2021.
1.3 Historical background
After the commissioning of the Cerro Tololo 4 m telescope (now the Blanco Telescope), Victor and Betty Blanco carried out a series of pioneering surveys of the Galactic bulge and Magellanic clouds using photographic plates at the prime focus. The advent of red-sensitive Kodak IV-N plates allowed for the first time an investigation of the evolved RGB using access to wide field, near-infrared imaging. Further, the prime focus allowed very low resolution slitless spectrosopy (grism) to record low-resolution spectra of all of the late-type stars in a 45 arcmin diameter field. These observations revealed a bulge dominated by late M giants and devoid of carbon stars; the latter were discovered in abundance throughout the lower metallicity, intermediate age Magellanic clouds (Blanco, Blanco & McCarthy 1978; Blanco & McCarthy 1983; Blanco & McCarthy 1984; Blanco 1987).
The Johnson R, I photometry from the CTIO 4 m Kodak IV-N photographic plates provided the input catalogue for subsequent spectroscopic investigations that founded the new era of bulge research (Whitford & Rich 1983; Rich 1988). The precise photometry and spectral classifcations by Blanco, McCarthy & Blanco (1984) also made possible a flood of successor Galactic bulge and Magellanic cloud science; the late-type stars discovered and identified would fuel many other significant infrared photometric investigations, the most notable (for the bulge) was the infrared study of the bulge RGB, Frogel & Whitford (1987).
Betty Blanco undertook the first survey of Galactic bulge RR Lyrae stars since that of Baade (1951), also using 4 m CTIO prime focus photographic plates (Blanco 1984, 1992; Blanco & Blanco 1997). Because the Galactic bulge at δ = −30° transits at CTIO and is therefore observable for 8 h in a night, Blanco’s analysis was not affected by the aliasing that plagued Baade’s observations from Mt. Wilson, so her study remained the best study of bulge RR Lyraes until the era of large microlensing surveys. Her work produced a modern catalogue of RR Lyrae variables in bulge fields at −4° and −6°. It is worth recalling that the magnitudes were measured using an iris photometer, one star and epoch at a time; positions measured painstakingly with a measuring engine and then plate solved.
The BDBS memorializes and honours the visionary scientific contributions of Victor and Betty Blanco, and for Victor Blanco’s role as Director of the Cerro Tololo Interamerican Observatory. It is noteworthy that the very survival of CTIO depended not only on the successful construction and commissioning of the 4 m and other telescopes, but also the delicate navigation of CTIO as an institution through turbulent political times (Blanco 2001). The work of Victor and Betty Blanco also opened a new era of stellar populations studies, especially in the Galactic bulge. Many of the significant advances in Galactic bulge research from 1988 to the 1990s were enabled by the precise spectral classifications and carefully measured astrometric positions for the bulge M giants undertaken by the Blancos. Although Arp (1965) had produced the first colour–magnitude diagram (CMD) of the field towards NGC 6522 at (l, b) = (1, −4); the combination of photometric uncertainties, reddening, and variation in metallicity rendered the CMD very difficult to interpret. Blanco’s unpublished R, I photometric CMD and resulting RGB that made possible selection of spectroscopic targets, and the subsequent advances based on that early work.
We now stand at the threshold of a new era of very large spectroscopic and photometric surveys. Some, such as APOGEE (Majewski et al. 2017) and VVV (Minniti et al. 2010), are complete or in advanced stages. The Rubin Observatory (LSST; Ivezić et al. 2019) will see its first light in a few years. The VLT MOONS infrared surveys (Cirasuolo et al. 2014) and 4MOST (de Jong et al. 2016) optical surveys will also commence in the next few years.
Examining the vast range of work ongoing or contemplated in the Galactic bulge, we realized that an optically calibrated, deep, wide field, point spread function-fit photometric data set does not exist for the bulge. BDBS provides that survey and is also a pathfinder for science that may eventually be feasible in the area of Milky Way science, using LSST.
2 OBSERVATIONS AND SURVEY STRATEGY
Most of our observations were executed in the course of CTIO programs under PI R. M. Rich. 2013A-580 (2013 June 1–6 and July 14–16), 2014A-529 (2014 July 14–22). As described in Johnson et al. (2020), the only observing run under photometric conditions was 2013 June 1–6. However, because of the survey design in which all field edges overlap, we are able to calibrate the full data set. Table 1 (online) gives a detailed journal of observations. In total, we have ∼ 250M sources in g and r. We have matched BDBS with Gaia DR2, yielding 74 791 629 matches with a mean value of ∼0.12 arcsec and σ = 0.15 arcsec. The smaller number of Gaia matches is due to the limiting magnitude of Gaia DR2, and the high source density in the Galactic bulge.
Journal of Observationsa.
| Date | RA (2000) | Dec. (2000) | Exp (sec) | Mag | Data set ID |
|---|---|---|---|---|---|
| 2013-06-01 | 279.308417 | −35.712611 | 75.0 | i | c4d_130601_045903_ooi_i_v2 |
| 2013-06-01 | 272.349083 | −31.435111 | 100.0 | i | c4d_130601_042434_ooi_i_v2 |
| 2013-06-01 | 279.240875 | −35.644000 | 75.0 | r | c4d_130601_045500_ooi_r_v2 |
| 2013-06-01 | 279.074750 | −33.984028 | 75.0 | r | c4d_130601_054112_ooi_r_v2 |
| 2013-06-01 | 279.238208 | −35.715806 | 1.0 | Y | c4d_130601_051921_ooi_Y_v2 |
| 2013-06-01 | 270.887000 | −30.036556 | 100.0 | i | c4d_130601_071751_ooi_i_v2 |
| 2013-06-01 | 272.348833 | −31.436167 | 100.0 | r | c4d_130601_042224_ooi_r_v2 |
| 2013-06-01 | 130.752833 | −0.006333 | 20.0 | Y | c4d_130601_230540_ooi_Y_v2 |
| 2013-06-01 | 279.237458 | −35.712500 | 75.0 | z | c4d_130601_050448_ooi_z_v2 |
| 2013-06-01 | 270.891500 | −30.023250 | 30.0 | r | c4d_130601_040406_ooi_r_v2 |
aAbridged; full table is in electronic form.
Our exposure times reflect a desire to reach a roughly uniform depth in all passbands, and usually were 3 × 75 s. However, the less sensitive u band received deeper imaging with exposure times of 150 s. For much of the field, we also acquired special sets of 6 × 30 s exposures arranged in 30 arcsec radius hexagons. These will be used to push the astrometric solution fainter than the limit of Gaia DR2 matching, which is currently limited to i ∼ 18 mag. At present, much of our field has a 7 yr baseline. A series of short exposures were acquired for all of the fields, some as short as 0.75 s. These enable us to calibrate the brightest red giants in each field. A detailed discussion of exposure time choices and the calibration strategy is given in the companion paper Johnson et al. (2020).
We chose to invest extra effort in calibrating the DECam Y to the Pan-STARRS y and DECam u to the SDSS u bands; we accomplished this by imaging the SDSS Stripe 82 regions under photometric conditions and covering a range in secz. The y band is useful because it is our reddest band at nearly 1 |$\mu \rm m$|, so it is an excellent ‘bridge’ to the infrared as we plan to match with the GLIMPSE, WISE, and MSX data sets. Photometry in the ultraviolet has a long history in its use as a constraint on stellar abundance – see e.g. Eggen, Lynden-Bell & Sandage (1962). More recently, Ivezić et al. (2008) took advantage of the u band in deriving metallicities of disc stars. In our case, the u band has proven valuable for metallicity derivation (see Johnson et al. 2020, Paper II), and we are optimistic that it will prove useful in constraining age and stellar populations. The blue band photometry will be useful for matching our data set to GALEX and Chandra imagery.
The reduction of the DECam images employed a modified version of daophot and at this point in the project, we have not done artificial star tests. To do such would vastly increase the computational and bookkeeping scale of the project beyond what is feasible at this time.
2.1 Calibration and reddening correction
Although a complete, detailed, description of our photometric calibration and reddening corrections is given in sections 2 and 3 of Johnson et al. (2020), we provide an overview here. Several factors made the final photometric calibration of this data set especially challenging. Only a subset of data was obtained in photometric conditions, hence the absolute calibration had to be transferred from the fields with absolute calibration to those fields imaged under non-photometric conditions; this was a challenging procedure due to the large numbers of individual images in our campaign.
When conditions were photometric, we obtained images of the Stripe 82 SDSS calibration field at a range of airmass and at regular intervals, during photometric nights. Atmospheric extinction corrections were applied to all calibration and science instrumental magnitudes using the airmass values provided in the image headers and the extinction coefficients provided by NOAO. For the ugriz filters, the Stripe 82 instrumental magnitudes were matched to the calibrated AB photometry from SDSS (Alam et al. 2015), while the Y-band data were matched to the UKIRT Infrared Deep Sky Survey Large Area Survey (Lawrence et al. 2007).
2.1.1 Reddening
It is well known that the reddening towards the bulge is high and spatially complex; we address this problem by adopting the high-resolution 1 arcmin × 1 arcmin reddening map derived in section 3 of Simion et al. (2017) from the VVV survey, following the lower resolution sampling approach used in Gonzalez et al. (2011). The RC giants in the VVV are used to build a reddening map of higher sampling than that of the original survey, by comparing the mean colour of the RC stars observed in each field with that of the RC population in Baade’s window (l, b) = (0.9°, −3.9°). While this approach provides a relatively high spatial resolution reddening correction, it does so only over the footprint of the VVV survey, |l| < 10°; −10° < b < +5°) and consequently we do not presently reddening correct our fields with b < −10°. We hope in the near future to develop a similar approach to Simion et al. (2017) by employing our BDBS izY band to reddening correct our complete data set. The transformations from the Vista system to 2MASS and individual total extinction corrections for each of our filter bandpasses are given in section 3.4 of Johnson et al. (2020), where the reddening is as given in Green et al. (2018); these values were derived using disc and bulge stars. We adopt the u band total extinction for R|$v$| = 3.1 as given in table 6 of Schlafly & Finkbeiner (2011). At this time, we are not undertaking a study of the reddening law and its variation across the field.
2.2 Survey footprint characteristics
Fig. 1 shows our final survey footprint superimposed on an optical image of the Galactic bulge (Mellinger 2009). As ours is an optical survey, we avoid regions of high extinction in the plane and at b > 0°. However, if maps of the extinction can be produced, the Northern bulge is potentially accessible using the techniques described herein and in our companion paper (Johnson et al. 2020). The two fields that are detached from the main footprint are chosen to fall in the main body of the Sagittarius dwarf spheroidal galaxy. These were originally observed under non-photometric conditions and we have only recently obtained calibration images in photometric conditions; photometry of these fields will be reported in a future paper.
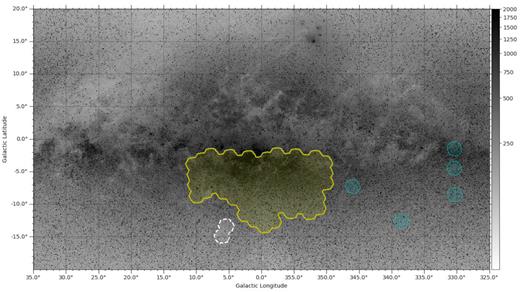
The BDBS footprint including the extension placed on the core of the Sgr dwarf spheroidal galaxy, superimposed on a grey scale map of the Milky Way from Mellinger (2009). The field enclosed in yellow is fully reduced and calibrated. Other fields are illustrated, but they are not yet reduced. The two joined white circles are chosen to sample the core of the Sagittarius dwarf spheroidal galaxy. The fields indicated in blue were selected to sample fields in the disc, to be used for eventual statistical subtraction of the foreground disc population.
Planning to eventually employ statistical subtraction of the foreground disc population, we also added five additional fields intended to sample the disc population at l = −30° spanning −2° < b < −8°; these are also shown in 1. We use the approximate (l, b) for these fields and approach successfully advanced in Ortolani et al. (1995) and Zoccali et al. (2003). The control fields are designed to sample the foreground disc in regions where the bulge makes little contribution, and to provide a sample for statistical subtraction when we address the age of the bulge.
As Shapley (1918) first noted, most of the globular clusters in the Milky Way are found towards the Galactic centre. The BDBS field includes 26 globular clusters; these will be used to provide RGB templates to calibrate metallicities across the bulge, and their properties will be studied as well, using our data set. It is also noteworthy that maps of the X-structure, especially those in Saito et al. (2011) and Wegg & Gerhard (2013), show that the bulge X-structure is most prominent for |l| < 1°. Our footprint is designed to overlap the full extent of the X-shaped bulge. Table 2 below gives a list and salient properties of globular clusters that fall within the BDBS footprint.
Globular clusters in the BDBS footprint.a
| Cluster | RA (2000) | Dec. (2000) | l | b | M|$v$| | [Fe/H] |
|---|---|---|---|---|---|---|
| FSR1758 b | 17 31 12 | −39 48 30 | 262.80 | −39.81 | −8.6c | −1.50 |
| NGC 6380 | 17 34 28 | −39 04 09 | 350.18 | −3.42 | −7.5 | −0.75 |
| Ton2 | 17 36 11 | −38 33 12 | 350.80 | −3.42 | −6.17 | −0.70 |
| Djorg1 | 17 47 28 | −33 03 56 | 356.69 | −2.47 | −6.98 | −1.51 |
| NGC 6441 | 17 50 13 | −37 03 05 | 353.53 | −5.01 | −9.63 | −0.46 |
| Terzan6 | 17 50 31 | −31 19 30 | 267.63 | −31.32 | −7.59 | −0.56 |
| NGC 6453 | 17 50 52 | −34 35 57 | 355.72 | −3.87 | −7.22 | −1.50 |
| Terzan9 | 18 01 39 | −26 50 17 | 270.41 | −26.84 | −3.71 | −1.05 |
| Djorg2 | 18 01 49 | −27 49 33 | 2.77 | −2.50 | −7.00 | −0.65 |
| NGC 6522 | 18 03 34 | −30 02 02 | 1.02 | −3.93 | −7.65 | −1.34 |
| Terzan10 | 18 03 39 | −26 05 08 | 270.91 | −26.08 | −6.35 | −1.00 |
| NGC 6528 | 18 04 50 | −30 03 22 | 1.14 | −4.17 | −6.57 | −0.11 |
| NGC 6540 | 18 06 09 | −27 45 55 | 3.29 | −3.31 | −6.35 | −1.35 |
| NGC 6544 | 18 07 21 | −24 59 50 | 5.84 | −2.20 | −6.94 | −1.40 |
| NGC 6553 | 18 09 18 | −25 54 31 | 5.26 | −3.03 | −7.77 | −0.18 |
| NGC 6558 | 18 10 18 | −31 45 50 | 0.20 | −6.02 | −6.44 | −1.35 |
| Terzan 12 | 18 12 16 | −22 44 31 | 8.37 | −2.10 | −4.14 | −0.50 |
| NGC 6569 | 18 13 39 | −31 49 37 | 0.48 | −6.68 | −8.28 | −0.76 |
| AL3 = BH261 | 18 14 07 | −28 38 06 | 3.36 | −5.27 | ... | ... |
| NGC 6624 | 18 23 41 | −30 21 40 | 2.79 | −7.91 | −7.49 | −0.44 |
| NGC 6626 | 18 24 33 | −24 52 11 | 7.80 | −5.58 | −8.16 | −1.32 |
| NGC 6637 | 18 31 23 | −32 20 53 | 1.72 | −10.27 | −7.64 | −0.64 |
| NGC 6642 | 18 31 54 | −23 28 31 | 9.81 | −6.44 | −6.66 | −1.26 |
| NGC 6638 | 18 30 56 | −25 29 51 | 7.90 | −7.15 | −7.12 | −0.95 |
| NGC 6652 | 18 35 46 | −32 59 27 | 1.53 | −11.38 | −6.66 | −0.81 |
| NGC 6656 | 18 36 24 | −23 54 17 | 9.89 | −7.55 | −8.5 | −1.70 |
We now consider how our survey overlays the infrared light of the bulge. The infrared map (Fig. 2) of Launhardt et al. 2002 shows that most of the 2 |$\,\mu \rm m$| luminosity of the Galactic bulge is encompassed in a ± 10° boundary in Galactic longitude and latitude. BDBS samples nearly fully this field of regard and adds two fields placed on the core of the Sgr dwarf spheroidal galaxy. The initial survey reaches close to the plane at b = −2° but stops there due to the extremely high optical extinction. We envision spanning the footprint of the VVV survey and to extend BDBS to the bulge North of the plane. However, as BDBS is an optical survey, correction for the variable and high extinction North of the plane will be challenging.
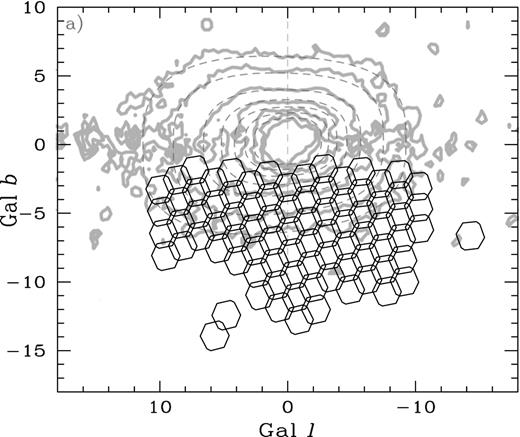
The BDBS fields are overlaid on the 2.2 |$\mu \rm m$| map of the Milky way from Launhardt et al. (2002). The footprint is designed to sample a large fraction of the mass of the bulge. The contours are the weighted average of maps at 2.2, 3.5, and 4.9 |$\mu \rm m$|, scaled to the 2.2 |$\mu \rm m$| surface brightness.
Fig. 3 shows the BDBS footprint superimposed on a map of RA, Dec. and l, b, and also reddening, based on the 1 × 1 arcmin reddening map from Simion et al. (2017). Our survey limits exceed those of VVV and consequently not all of BDBS is included in the current reddening map. Periodic updates of the BDBS data base will include dereddening for the full field, and improved reddening. As we mentioned earlier, BDBS avoids regions closer to the plane than 1°; in such regions of high extinction, only infrared photometry will suffice for investigating the bulge. However, the BDBS footprint takes us within 140 pc of the plane and therefore is able to well sample the bulge for exploring properties such as age and metallicity.
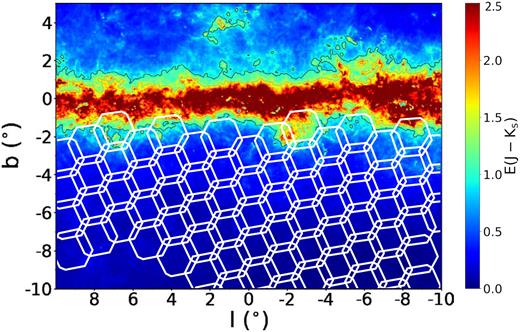
The BDBS fields are superimposed on the reddening map constructed from 1 × 1 arcmin cells (Simion et al. 2017). At this point, the reddening map is based on data from the VVV survey; we ultimately plan to deredden over the full BDBS footprint.
2.3 Astrometry with BDBS and Gaia
A critical aspect of our survey will be the use of GaiaDR2 astrometry to obtain kinematics as a function of age and metallicity. Fig. 4 shows that our Gaia DR2 completeness is excellent to i = 18 in Baade’s Window at (l, b)° = (0.9, −4). In future data releases, it may be possible for matched Gaia DR2 detections to reach the main-sequence turn-off over much of the BDBS footprint, making possible the veto of foreground stars from analyses of the bulge age.
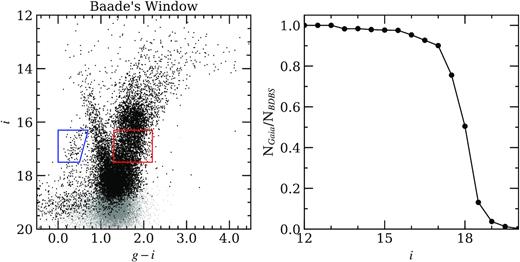
(Left): A colour–magnitude diagram of Baade’s Window (l, b) = (0.9°, −3.9°) in the Galactic bulge with selection boxes indicating blue HB and RGB stars. (Right): The fraction of stars with Gaia DR2 matching, as a function of i magnitude. The completeness limit forGaia DR2 matching is substantially fainter than the red clump, in this field.
BDBS offers the possibility to perform scientifically useful astrometry at fainter magnitudes (and thus to more spatially crowded regions) than Gaia DR2 can reach towards the bulge. A full accounting of the astrometric precision achieved with DECam is a substantial undertaking (even in uncrowded regions, e.g. Bernstein et al. 2017), which demonstrates absolute accuracies of ∼7 mas at magnitudes for which Gaia DR2 furnishes a sufficiently dense reference catalogue). Detailed analysis of our achieved astrometric precision with BDBS is still in progress. For rough indications, however, we use the S/N actually achieved (Johnson et al. 2020) and thus accounting for spatial confusion: the ultimate astrometric precision delivered by BDBS will be worse than these early indications.
We adopt photometric S/N ∼ 20 as a sensible limit to check completeness to useful astrometry: at this photometric precision, simple scaling with the PSF FWHM suggests per-epoch astrometric repeatability on the order of 30–50 mas per epoch, roughly in line with an extrapolation of the Gaia DR2 delivered astrometric uncertainty curve down to r ∼ 19−20. The relatively early epoch of observation of BDBS extends the time baselines of future planned surveys (such as the 10-yr LSST survey). Thus, proper motion precisions of a few mas yr−1 become feasible: on a population basis, this opens up the possibility of kinematically tagging bulge and disc populations.
The rewards in survey grasp are substantial. In the 0.25° radius field within Baade’s Window, for example, the extra depth leads to 96 000 more detected objects in BDBS than for Gaia DR2 (more than doubling the sample size). This increase in detected population is typical for the fields surveyed to date.
Note that we are not claiming that BDBS outperforms GaiaDR2 astrometrically (space-based astrometry generally being far superior to ground-based at the same S/N). However, we do assert that DECam is capable of achieving scientifically useful astrometry down to about 1–2 magnitudes fainter than Gaia DR2 in most fields in the inner Bulge. For Baade’s Window, for example, BDBS reaches limiting magnitude r ≈ 20.5(21.8) at 0.05 mag precision in r (g) filters (assuming S/N selection on r and g only for a direct comparison to Gaia DR2; when the five filters g, r, i, z, y are considered in the selection, the limits are about 0.5 mag brighter. This limit is starting to reach the main-sequence turn-off in this field; when more specialized analyses are brought to bear, we expect that the magnitude limits can be pushed still fainter – possibly to the middle of the main sequence turnoff (MSTO) in some fields.
3 EARLY RESULTS CONCERNING THE STELLAR POPULATION
3.1 The bulge population
Fig. 5 presents an array of CMDs spanning the Galactic bulge, in (g − i)0. All fields include a blue foreground disc star sequence, a RGB, RC, and bulge main-sequence turn-off point. We have dereddened our data using the 1 arcmin scale reddening map derived from the VVV data by Simion et al. (2017).
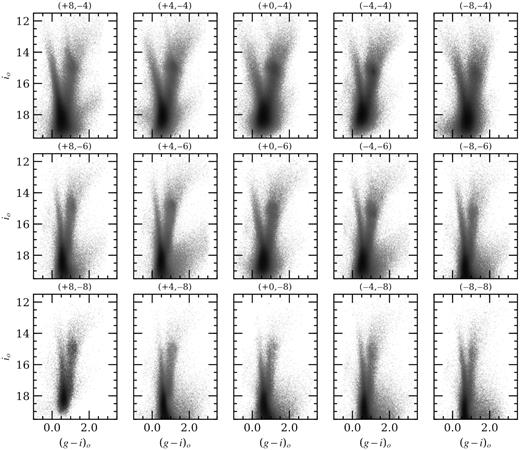
Fig. 5 Panel of dereddened CMDs spanning the bulge, sorted by (l, b). Notice that the form of the red clump is peculiar in the region towards (l, b) = +8°, −4° that likely reflects the presence of the ‘long bar’ population. The doubling of the red clump is clearly evident at (l, b) = 0°, −8°.
Most of our bulge fields also include an extended blue horizontal (or ‘vertical’) branch, although in some fields, a globular cluster can be the majority contributor to the BHB. This is true especially in Baade’s Window, where the metal-poor globular cluster NGC 6522 contributes a large fraction of the BHB in that field (e.g. Saha et al. 2019).
We can immediately note some significant features in the CMDs. First, the foreground disc is ubiquitous in all fields. This is a main-sequence structure that presents as a blue linear feature in the CMD. It is also evident that the RGB is both more broad and redder in the lower latitude fields. While this might be attributed to increased differential reddening, the difference between fields at −4° and −8° is real as both are dereddened. The metallicity distribution is discussed in Johnson et al. (2020), but one can visually notice that the RGB becomes both more narrow and vertical in the fields at −8°, reflecting a real decline in metallicity compared to the lower latitude fields. Also, at b = −8° and l < 0 one can see clearly the doubling of the RC, which is attributed to an X-structure in the bulge. We will investigate this feature and its structure as a function of metallicity, in future work.
The peculiar appearance of the RC at (l, b) = +8, −4 is noteworthy. The RC appears to have a bright extension that we speculate is likely caused by RC stars in the disc, lying closer to the Sun that the bulk of the bulge. It is also possibly due to the ‘long flat’ bar (López-Corredoira et al. 2007, Cabrera-Lavers et al. 2007, Cabrera-Lavers et al. 2008); future modelling is needed to choose between these alternatives.
3.2 Is there a young, massive population in the bulge?
As mentioned previously, the large contiguous BDBS field is ideal for exploiting the Gaia DR2 data base. The extinction is low enough, and the bulge population bright enough, to have significant overlap with Gaia DR2, which we use to resolve some interesting problems in the interpretation of the bulge population.
Saha et al. (2019) in their fig. 1 propose that stars in the blueward/bright extension of the RC are massive helium burning stars in the bulge, in the advanced ‘blue loop’ phase of stellar evolution. This feature in the CMD is clearly visible in many fields shown in Fig. 5. It is important to understand the cause of this feature, as it is present over most of our field, especially at lower Galactic latitudes. We test Saha’s hypothesis in Fig. 6 by matching this feature to the Bailer-Jones et al. (2018) catalogue, and we find that nearly all of these stars have derived distances ∼1.5 kpc from the Sun; this would make their colours and magnitudes consistent with RC stars lying closer to the Sun than the bulge, as opposed to a population of young, massive stars. We confirm this finding for other methods of distance determination using the Gaia DR2 catalogue, including using only the parallax data. If one imagines displacing the bulge red giant population closer to the sun, as would be the case if the clump were in the disc, the intrinsic magnitudes and colours would trend along a track that is brighter and bluer. Further, stars lying in front of the reddening sheet would be (wrongly) corrected for reddening. We propose this interpretation for the blue/bright RC feature as an alternative to the massive star population, and it appears to account for this peculiar feature in the CMD.
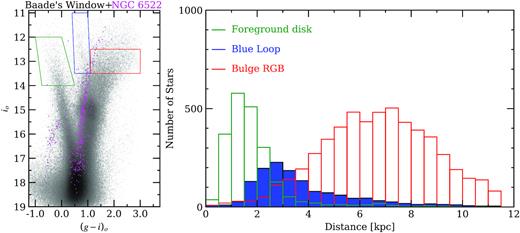
The colour–magnitude diagram of Baade’s Window is analysed with distances of foreground disc, candidate massive blue loop stars (Saha et al. 2019), and bulge RGB stars from Gaia DR2 (Bailer-Jones et al. 2018). Members of NGC 6522 are illustrated in pink. Notice that all stars are placed at their expected distances, with the foreground disc stars lying mostly within 2 kpc. We find the young blue loop stars proposed by Saha et al. (2019) to lie mostly in the distance range of 2–4 kpc; we propose that these are late-type stars (red clump/giants) that belong the thin disc or bar, and are closer to the Sun than the bulge.
The feature is especially prominent towards the plane, as would be expected if the stars arise in the old disc lying along the line of sight towards the bulge. A different approach confirms our interpretation using the Besancon model (Robin et al. 2012a,b) and concurs that the proposed blue loop stars are actually older than 1 Gyr, but reside in the foreground disc. A new model has been used to simulate a 0.1 deg2. field towards Baade’s Window (l, b) = (−0.2°, +3.9°) and the resulting CMD is shown in Figs 7 and 8. The CMD was generated using the model version mev1910, that uses new evolutionary tracks as described in the Besancon Galaxy Model (Lagarde et al. 2017, 2019); the bar model is described in Robin et al. (2012b), with modifications of the mass density from Awiphan et al. (in preparation).
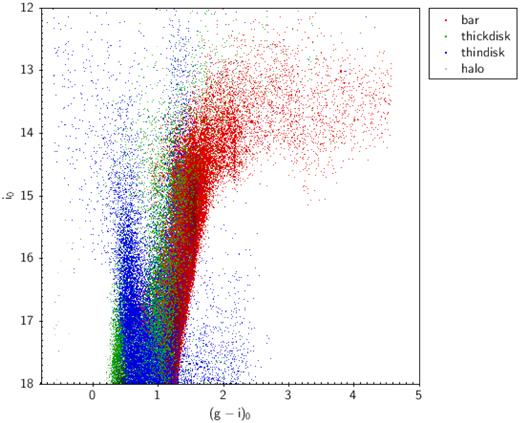
A model CMD of the population towards Baade’s Window (l, b) = (− 0.2°, +3.9°) covering 0.1 deg2 (see text and the Besancon Galaxy Model; Lagarde et al. 2017). This model breaks down the the CMD by stellar populations as indicated in the legend. Notice that the bright blue population near the red giant branch is dominated by stars in the thin disc, not the bulge.
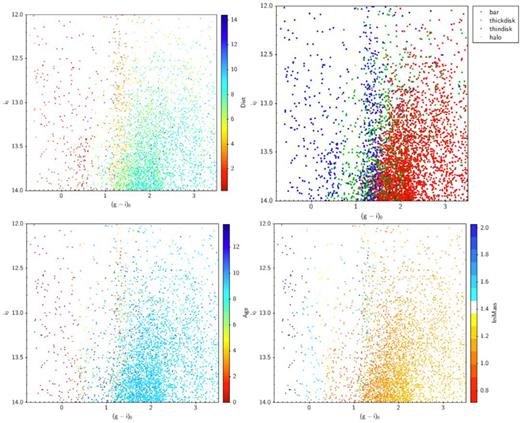
A model CMD of the population towards Baade’s Window (l, b) = (− 0.2°, +3.9°) covering 0.1 deg2 (see text and the Besancon Galaxy Model; Lagarde et al. 2017). Clockwise from the top are panels showing the distance in kpc, the population (indicated in the legend), the stellar mass, and the age in Gyr. The population proposed by Saha et al. (2019) as the massive blue loop stars would be the blue (disc stars) in the population panel, near i = 12.5 and g − i = 1. This model would assign the blue plume’ to the foreground disc population, which might plausibly explain the unusual bright extension seen in the red clump near (l, b) = (+8°, =4°) that is seen in Fig. 5.
Considering that a population of such young massive stars would be expected to have luminous evolved counterparts, we prefer our conclusion that these are RC stars in the foreground, as opposed to young, massive stars at the bulge distance of 6–8 kpc; they are indeed identified to lie at distances where we have high confidence in the Gaia DR2 parallaxes.
3.3 A peculiar red clump: long bar signature, or disc feature?
It has been proposed (e.g. López-Corredoira et al. 2007) that towards the plane, the bar is both more flattened and extended; this proposed feature is designated as the ‘long bar’. Fig. 9 shows Gaia DR2 distances for the field at (l, b) = +7.75, −3.4) in VVV and BDBS. The feature first noted by López-Corredoira et al. (2007) is clearly seen in our field and diminishes as one moves towards the minor axis. We can examine the Gaia DR2 derived distances for stars in the RC extension, and note that they are somewhat closer than the fainter RC that we associate with the main bulge population. Fig. 8 presents the case that bright bar extension is actually due to stars in the foreground disc.
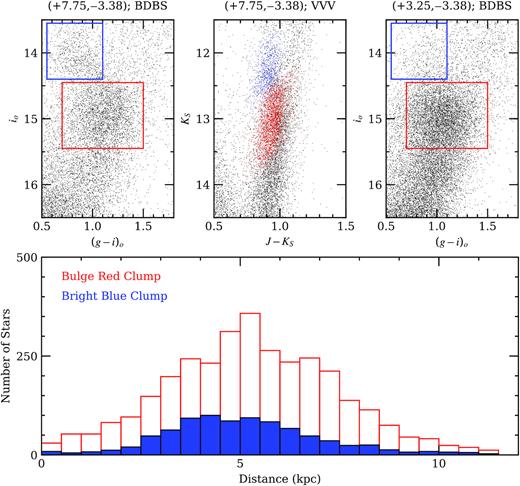
Stars in what appears to be a foreground red clump population are examined. The clump region is divided into a fainter bulge population and brighter (blue) candidate foreground population. Gaia DR2 distances (Bailer-Jones et al. 2018) suggest the bright blue feature consists of stars that are indeed, closer to the Sun than the bulk of the bulge red clump stars. This feature may arise in the foreground thin disc (Fig. 8), or the ‘long bar’.
Fortunately, the stars in question are bright enough that improved parallaxes and proper motions can be expected during the Gaia mission. High-resolution spectroscopy might also shed light on the nature of this population by enabling a self-consistent measurement of the spectroscopic parallax and metallicity. At present, combining the CMD and G aia-derived distances suggests only that the bright blue clump is just marginally closer than the RC.
3.4 Mapping the blue horizontal branch
The wide field of regard also enables mapping of the spatial distribution of stellar populations in the bulge CMD. Our long-term plan will be to combine Gaia DR2 data with the optical photometry spanning the whole field; this will become feasible with anticipated improvements that should come with Gaia DR3.
We turn to one of the most interesting features of the CMD, the blue horizontal branch (BHB). BHB stars are a signature of old stellar populations; they once were thought to arise only from metal-poor populations but are now known in metal-rich populations as well, and may be the stars responsible for the as yet unsolved UV rising flux of elliptical galaxies. BHB stars are of special interest because they are also potential tracers of dissolved globular clusters and dwarf spheroidal galaxies. A disrupted system that is rich in BHB stars will leave a clear signature in such a map – either clump or stream-like features. Finally, clusters of BHB stars can in principle point the way towards previously uncatalogued globular clusters.
We create a uniform spatial grid across the entire BDBS footprint for which dereddening values from VVV (Simion et al. 2017) are available. The boundary is therefore the VVV footprint, not the BDBS footprint. Within each grid point a dereddened i versus g − i CMD is created; we generate a selection box around the region that maximizes the number of blue HB stars and minimizes contamination from the foreground disc (e.g. see Fig. 4), and we calculate the number of likely blue HB stars in the selection box. The resulting colour map reflects the number of blue HB stars within each grid point. The open circles signify the positions of known globular clusters.
Fig. 10 shows our first efforts at mapping the density of the BHB. As the BHB extends to the limit of our detection as defined by crowding, we can consider these density maps to be only approximate, and most useful as a guide to features that may be interesting for future investigation. However, in this figure one can clearly see that all of the significant peaks of density in the BHB population are associated with known globular clusters, and no stream-like features are evident. We suspect that some of the variation near the plane is due to variable reddening and completeness, rather than an actual reflection of true population variation. There is a interesting apparent enhancement in BHB/RGB at (l, b) = +2°, −9° that is roughly in the direction of the Sgr dwarf spheroidal galaxy (refer to the Sgr dwarf fields in 1); confirmation of this feature is deferred to a future study, as it would require a more advanced analysis, including measurement of radial velocities and matching of our data set to the Gaia catalogue.
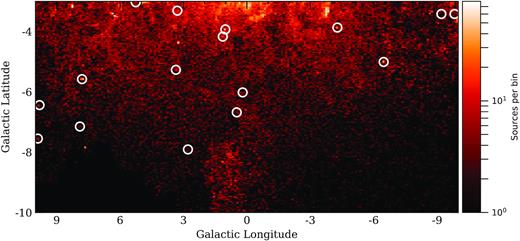
A preliminary map of the density of blue HB stars, with the superimposed black circles indicating the locations of known globular clusters. All concentrations of BHB stars correspond either to known globular clusters or approximately with the Sgr dwarf spheroidal galaxy. The irregular features near the plane do not appear to correspond to actual concentrations. A modest increase in density of BHB stars is noted near (l, b) = +2, −9 that corresponds with an extension of the Sgr dwarf spheroidal galaxy. The white circles indicate the positions of known globular clusters.
Fig. 11 shows how the distribution of BHB stars compares with that of the red giants. To first order, the BHB appears to more closely follow the spatial distribution of the metal-poor |$\rm ([Fe/H]\lt -0.5)$| RC stars, rather than that of the red giants that concentrate more the plane (Johnson et al. 2020). The lower two plots for Fig. 11 were created in the same way as Fig. 10, and in fact the middle panel of Fig. 11 is the same as that in Fig. 10, but with a different binning. The upper panel of Fig. 11 simply counts the number of RGB stars between 16.5 < i0 < 17.5, which largely avoids the RC and also the foreground disc. The colour map shows the number density within each grid point. The bottom panel of this figure is simply a straight division of the red giant and BHB maps that are illustrated in the upper two panels.
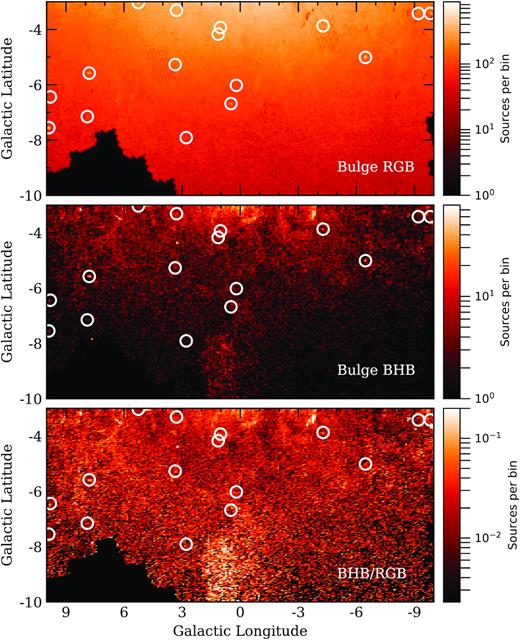
Mapping the blue HB of the Milky Way. Upper panel is the density of RGB stars; center panel is the density of BHB stars as in Fig. 10; the bottom panel is the ration of BHB/RGB stars.
4 CANDIDATE GLOBULAR CLUSTERS FROM THE VVV SURVEY
The VVV survey combines infrared photometry and variability studies, a powerful combination that potentially revealed previously uncatalogued globular clusters both through enhancements in stellar density and recently, as advanced in Minniti et al. (2018) by identifying groups of RR Lyrae stars similar derived distance as representatives of an underlying hosting globular cluster. This approach to discovering new clusters and systems is indeed interesting, and may have greater power once proper motion surveys extend sufficiently faint that such associations can be made in the kinematic as well as the spatial sense. However, in our case we are not able to confirm any of the new globular clusters inferred from the application of this approach with current data.
We have used our optical BDBS catalogue and the Gaia DR2 cross-match to investigate the proposed globular clusters, both from the standpoint of, e.g. stellar concentration and BHB stars, and also by searching for concentrations in the Gaia DR2 proper motion vector point diagram. The use of optical colours offers an additional powerful discriminant compared to Gran et al. (2019) that also considers whether globular cluster candidates previously reported in the literature are real but uses the VVV photometry with its smaller IR colour baseline. With the benefit of our optical colours, for example, we show that the CMD of the cluster Minniti 22 (Minniti et al. 2018) is not distinct from the metal-rich Galactic bulge field population, and it is therefore not a metal-poor globular cluster.
Fig. 12 illustrates our investigation of Minniti 22; the authors report a substantial amount of information derived from there analysis of this proposed globular cluster, including [Fe/H] = −1.3, a distance modulus, and age from isochrone fits. Our colour baseline should be sensitive to the metal-poor population described in Minniti et al. (2018), but our analysis is unable to confirm it, and also does not isolate a blue horizontal branch. We show no concentration of red giants or any other sources, and no sign of a cluster in the vector point plot (see Johnson et al. 2020) for clear detections of bulge globular clusters in the vector point plot).
![Examination of the proposed globular cluster Minniti 22 Minniti et al. (2018) identified by a red giant overdensity and a clustering of RR Lyrae variables; the authors fitted isochrones for a distance and age, and metallicity of [Fe/H] = −1.3. The left-hand panel shows the source distribution; the centre panel shows the CMD of sources within 1, 2, and 4 arcmin of the cluster centre, while the right-hand panel shows the vector point plot for those sources. There is no evidence for a metal-poor population, nor for any evidence of a cluster population distinct from the field in any of the three plots. While this confirms the findings of Gran et al. (2019), the absence of any distinguishing sequence in the colour–magnitude diagram presents an additional powerful argument.](https://oup.silverchair-cdn.com/oup/backfile/Content_public/Journal/mnras/499/2/10.1093_mnras_staa2426/2/m_staa2426fig12.jpeg?Expires=1716560630&Signature=z8PeOGukhPGHg~QcIvn7gUpNSNhFpvgc2S-AhjkkpU0t0jUk8Rhgovn2Ty2dLkEVXhUa7DpGT1Qf4bOMDHioyYMhdmMVkcIYjwcj0vrx-ku84cbUEcCoITvaJqWVlDV6xafIQYMsYClWkaHQ28o9~CBRbZqz5eEqAa2i8NIGrvylwIq1Mm9xWU1PfONu-9e~0AzfHYO9eTiA4zuo0ZW2OptkQcy~eu4Sw3R65Uytqt~KV5G5-ShZA~uu1GfRwach-SU5AuMkn3Mbk37C~lM5hy3s-Vw2SuFKl7O8IX9tRsRY8kLZkwQS9AdEPzwLMMPn5JDF5pFJpQGX6Qx-tdkVkQ__&Key-Pair-Id=APKAIE5G5CRDK6RD3PGA)
Examination of the proposed globular cluster Minniti 22 Minniti et al. (2018) identified by a red giant overdensity and a clustering of RR Lyrae variables; the authors fitted isochrones for a distance and age, and metallicity of [Fe/H] = −1.3. The left-hand panel shows the source distribution; the centre panel shows the CMD of sources within 1, 2, and 4 arcmin of the cluster centre, while the right-hand panel shows the vector point plot for those sources. There is no evidence for a metal-poor population, nor for any evidence of a cluster population distinct from the field in any of the three plots. While this confirms the findings of Gran et al. (2019), the absence of any distinguishing sequence in the colour–magnitude diagram presents an additional powerful argument.
We turn to the five most luminous candidates in Minniti et al. (2017), shown in Fig. 13. As is the case for Minniti 22, none of these clusters present any evidence for concentration, distinct CMD, or evidence of a tight cluster in the vector point plot. We propose that none of these candidates are valid clusters. We conclude that it is reasonable to ask that any globular cluster candidate in the bulge pass a trifecta of tests – clear concentration, distinct sequences in the CMD, and presence in the vector point plot.
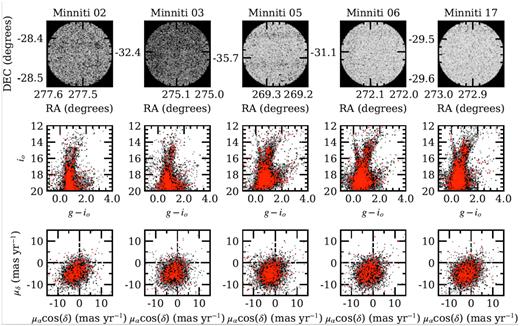
The five most luminous cluster candidates from Minniti et al. (2017) are illustrated here. As in Fig. 12, there is no evidence for the globular clusters in starcounts, colour–magnitude diagrams, or vector point plots. It is noteworthy that the fields span a wide range of location in the bulge, CMD type, and source density.
5 CONCLUSIONS
We report early results from the BDBS, that spans 200 square degrees with ugrizY photometry. A companion paper (Johnson et al. 2020) describes the data reduction methods and calibration, and presents new results on bulge globular clusters and the metallicity distribution derived from RC stars. We present a table of globular clusters that lie in the main BDBS footprint.
We present a new array of CMDs that span the Galactic bulge from −3° < b < −8° and −8° < l < +8°. We detect a bright extension to the RC that we attribute to the long flat bar; based on Gaia DR2 distances these stars in the foreground relative to the bulk of the bulge. The signature of the long flat bar is strongest at (l, b = +8°, −4°) but is clearly visible in bulge fields adjacent to this position. A curious extension of the RC assigned by Saha et al. (2019) to massive He burning stars in the bulge instead is due to clump giants 2–4 kpc from the Sun, also likely part of the bar. The presence of the bar and its complexity will pose a challenge for studies of the main-sequence turn-off that aim to constrain the age of the bulge. The same features that complicate the RC will project stars into the regions brighter and bluer than the main-sequence turn-off, locations of the CMD where blue stragglers and trace young/intermediate age populations will reside.
We show new maps of the spatial extent of the bulge blue horizontal branch, including clear detections of a number of known bulge globular clusters, but we find no clear indications of previously unreported streams. There is a hint of an excess of BHB stars in the extension of the Sagittarius dwarf spheroidal galaxy, but no obvious new streamlike features. We plan to investigate the possible concentration of BHB stars in the Sgr dwarf vicinity, in future work.
We consider six candidate globular clusters reported in the Galactic bulge, including Minniti 22, ‘confirmed’ as a metal-poor globular cluster (Minniti et al. 2018). We find no supporting evidence for these systems based on star counts, CMDs, and the Gaia DR2 vector point proper motion diagrams. This strongly confirms the findings of Gran et al. (2019), who also failed to confirm ∼90 bulge globular clusters claimed in the literature, but only on the basis of applying Gaia DR2 astrometry to the VVV data base. The combination of BDBS and the optical Gaia DR2 catalogue, along with future Gaia data releases, will prove a powerful combination to confirm and challenge claims of new stellar systems towards the bulge. In the long term, other ground-based data sets such as LSST will strengthen the power to discriminate real from spurious clusters.
With new technology, the prime focus of the CTIO 4 m Blanco telescope is once again, 40 yr after its commissioning, helping to launch a new era in the investigation of the Galactic bulge. We dedicate these efforts to the memory of Victor and Betty Blanco.
SUPPORTING INFORMATION
BDBS_obs_catalog_edit.tex
Please note: Oxford University Press is not responsible for the content or functionality of any supporting materials supplied by the authors. Any queries (other than missing material) should be directed to the corresponding author for the article.
ACKNOWLEDGEMENTS
The authors thank an anonymous referee for constructive comments. RMR, WIC, and CIJ acknowledge partial financial support from NSF grant AST-1411154. WIC acknowledges support from the Fund for Astrophysical Research, an initiative of the Theodore Dunham, Jr. foundation, and from a grant from the Office of Research and Sponsored Programs, University of Michigan-Dearborn. RMR also acknowledges his late father Jay Baum Rich for financial support. CP, MY, and SM also acknowledge support from NSF grant AST-1411154. ITS acknowledges support from the PIFI grant 2018PM0050. AK gratefully acknowledge funding by the Deutsche Forschungsgemeinschaft (German Research Foundation) – Project-ID 138713538 – SFB 881 ‘The Milky Way System’, subproject A11. AR acknowledges computational support for simulations for the Besancon Galaxy Model, which have been done on the cluster of UTINAM Institute of the Université de Franche-Comté, supported by the Région de Franche-Comté and the french Institut des Sciences de l’Univers (INSU). RMR additionally dedicates this work to the memory of the late Peter Loughrey.
This project used data obtained with the DECam, which was constructed by the Dark Energy Survey (DES) collaboration. Funding for the DES Projects has been provided by the U.S. Department of Energy, the U.S. National Science Foundation, the Ministry of Science and Education of Spain, the Science and Technology Facilities Council of the United Kingdom, the Higher Education Funding Council for England, the National Center for Supercomputing Applications at the University of Illinois at Urbana-Champaign, the Kavli Institute of Cosmological Physics at the University of Chicago, the Center for Cosmology and AstroParticle Physics at the Ohio State University, the Mitchell Institute for Fundamental Physics and Astronomy at Texas A&M University, Financiadora de Estudos e Projetos, Fundação Carlos Chagas Filho de Amparo à Pesquisa do Estado do Rio de Janeiro, Conselho Nacional de Desenvolvimento Científico e Tecnológico and the Ministério da Ciência, Tecnologia e Inovação, the Deutsche Forschungsgemeinschaft, and the Collaborating Institutions in the DES. The Collaborating Institutions are Argonne National Laboratory, the University of California at Santa Cruz, the University of Cambridge, Centro de Investigaciones Enérgeticas, Medioambientales y Tecnológicas-Madrid, the University of Chicago, University College London, the DES-Brazil Consortium, the University of Edinburgh, the Eidgenössische Technische Hochschule (ETH) Zürich, Fermi National Accelerator Laboratory, the University of Illinois at Urbana-Champaign, the Institut de Ciències de l’Espai (IEEC/CSIC), the Institut de Física d’Altes Energies, Lawrence Berkeley National Laboratory, the Ludwig-Maximilians Universität München and the associated Excellence Cluster Universe, the University of Michigan, the National Optical Astronomy Observatory, the University of Nottingham, the Ohio State University, the OzDES Membership Consortium the University of Pennsylvania, the University of Portsmouth, SLAC National Accelerator Laboratory, Stanford University, the University of Sussex, and Texas A&M University.
The research presented here is partially supported by the National Key Research and Development of China under grant 2018YFA0404501; by the National Natural Science Foundation of China under grant Nos. 11773052, 11761131016, 11333003. JS acknowledges support from a Newton Advanced Fellowship awarded by the Royal Society and the Newton Fund. Based on observations at Cerro Tololo Inter-American Observatory (2013A-0529; 2014A-0480; PI:Rich), National Optical Astronomy Observatory, which is operated by the Association of Universities for Research in Astronomy (AURA) under a cooperative agreement with the National Science Foundation. This work has used data from the European Space Agency (ESA) mission Gaia (https://www.cosmos.esa.int/gaia), processed by the Gaia Data Processing and Analysis Consortium (DPAC, https://www.cosmos.esa.int/web/gaia/dpac/consortium). Funding for the DPAC has been provided by national institutions, in particular the institutions participating in the Gaia Multilateral Agreement.
DATA AVAILABILITY
The reduced DECam images on which this article is based are available as given in Table 1, from the data archive of NSF’s Optical/IR Laboratory and are found in http://archive1.dm.noao.edu/. The calibrated photometric catalogue data underlying this article will be shared on reasonable request to the corresponding author. These data may be subject to slight revisions as new versions of our catalogue are developed.
