


Abstract
We analyse the circular polarization data accumulated in the first 7 years of the Polarimetric Monitoring of Active Galactic Nuclei at Millimetre Wavelengths (POLAMI) project introduced in an accompanying paper. In the 3-mm wavelength band, we acquired more than 2600 observations, and all but one of our 37 sample sources were detected, most of them several times. For most sources, the observed distribution of the degree of circular polarization is broader than that of unpolarized calibrators, indicating that weak (≲0.5 per cent) circular polarization is present most of the time. Our detection rate and the maximum degree of polarization found, 2.0 per cent, are comparable to previous surveys, all made at much longer wavelengths. We argue that the process generating circular polarization must not be strongly wavelength dependent, and we propose that the widespread presence of circular polarization in our short wavelength sample dominated by blazars is mostly due to Faraday conversion of the linearly polarized synchrotron radiation in the helical magnetic field of the jet. Circular polarization is variable, most notably on time-scales comparable to or shorter than our median sampling interval of ≲1 month. Longer time-scales of about 1 yr are occasionally detected, but severely limited by the weakness of the signal. At variance with some longer wavelength investigations we find that the sign of circular polarization changes in most sources, while only seven sources, including three already known, have a strong preference for one sign. The degrees of circular and linear polarization do not show any systematic correlation. We do find however one particular event where the two polarization degrees vary in synchronism during a time span of 0.9 yr. This paper also describes a novel method for calibrating the sign of circular polarization observations.
1 INTRODUCTION
Astrophysical jets from active galactic nuclei (AGN) are powerful emitters of synchrotron radiation that can be strongly linearly polarized. Its weak intrinsic circular polarization (CP) has in the optically thin regime a ν−0.5 spectrum (Ginzburg & Syrovatskii 1965; Legg & Westfold 1968; Jones & O'Dell 1977; Jones 1988) that tends to make it negligible at short millimetre wavelengths. It was however realized early on (Sazonov 1969) that CP could also be generated by Faraday conversion (FC). This mechanism can convert the strong linear polarization to circular in two ways that exploit the birefringence of the magnetized plasma of the jet. Both ways require a departure from the original angle between the magnetic field direction and the polarization that is 0° or 90° for high or low optical depths, respectively. Either (i) the polarization angle is changed by Faraday rotation (FR) in the emitting medium (FR-driven FC; Melrose 1971) or (ii) the direction of the magnetic field |$\boldsymbol {B}$| rotates along the propagation direction (BR-driven FC; Kennett & Melrose 1998). The rotation of the |$\boldsymbol {B}$|-direction can be due to a stochastic field component (Marscher 2014) or to a changing large-scale field organization like in helical fields (Gabuzda et al. 2008). These topics are discussed in detail by Wardle & Homan (2003), together with other open issues like the composition of the jet, its density structure and the wavelength dependence of the resulting CP.
Studies of CP have therefore great potential in contributing to the understanding of the still poorly known fundamental properties of AGN jets. Because of the weakness of CP (Weiler & de Pater 1983; Saikia & Salter 1988; Homan & Lister 2006), however, sensitive and well calibrated instrumentation at big telescopes is needed, and the number of investigations are not many. Single dish surveys have been made with the Parkes telescope (Komesaroff et al. 1984), the University of Michigan radio telescope (Aller, Aller & Plotkin 2003), the Effelsberg 100-m telescope (Fuhrmann et al. 2016; Myserlis et al. 2016), the Arecibo telescope (Taylor, private communication) and the IRAM 30-m telescope (Agudo et al. 2010, 2014). Interferometric observations were made with the Very Long Baseline Array (VLBA), in particular the Monitoring of Jets in AGN with VLBA Experiments (MOJAVE) survey (Homan & Lister 2006), and with the Very Large Array (VLA; Bower, Falcke & Mellon 2002b) and the Australia Telescope Compact Array (ATCA; Rayner, Norris & Sault 2000; O'Sullivan et al. 2013). For a more complete summary refer to Homan et al. (2009). Another important factor is the opacity of the jet plasma. Usually, observations need to be made at short, often millimetre, wavelengths where the opacity is sufficiently low for the jet core and emerging new components to be seen (Lobanov 1998). The often rapid temporal variations of the jet emission further complicate matters. These variations originate in energetic events near the black hole and then travel downstream of the jet. In order to resolve these highly dynamic events, adequately fast time resolution is needed.
Our program Polarimetric Monitoring of Active Galactic Nuclei at Millimetre Wavelengths (POLAMI) project addresses all these issues. We exploit the high sensitivity available with the IRAM 30-m telescope; we observe at 3 and 1.3 mm, the shortest wavelength of any CP monitoring program so far; and we observe a large sample of 37 sources once every month. A further distinguishing property of POLAMI is its capability of simultaneously measuring all four Stokes parameters at both wavebands in parallel, a very useful feature when interpreting CP events. Observing procedure, data reduction and sample characteristics are described in Agudo et al. (2018a, henceforth Paper I). Here we analyse the CP data obtained during the first 7 yr of the monitoring campaign. The total density and linear polarization data, and their variability properties are analysed separately (Agudo et al. 2018b). Detailed studies of specific sources and discussions of other statistical aspects of our sample, like correlations with optical, γ-ray and 7-mm VLBI data, will be presented in future publications.
2 GENERAL PROPERTIES OF THE DATA SET
The CP data used here are taken from the data base of the POLAMI program described in the accompanying Paper I. The astrophysical properties of the sources, notably their positions, optical classification, spectral energy distribution and redshift are described in Paper I.1 The sample of the more frequently observed sources comprises 37 AGN, mostly quasars (22) and BL Lac objects (11), and a few radio galaxies (4). All of these sources have at least 25 valid observations in the 3-mm band. The average number of observations is 61 per source.
The observations were made with the IRAM 30-m telescope at 3 and 1.3 mm wavelengths using the procedure XPOL (Thum et al. 2008) that acquires simultaneously the four Stokes parameters. The angular resolution at these wavelengths is 28 and 12 arcsec, respectively. For more technical details we refer to Paper I. Monitoring started on 2006 October 14 at 3 mm wavelength using the Observatory's ABCD receivers, and from 2009 December 7 on with the receiver EMIR (Carter et al. 2012) that permitted simultaneous recording of 3 and 1.3-mm bands. Observations were made at irregular intervals, typically of 2–4 weeks. Here we discuss the CP data obtained up to 2014 August. Fig. 1 shows an example of the full polarization data obtained for one of the monitored sources at 3 mm wavelength.
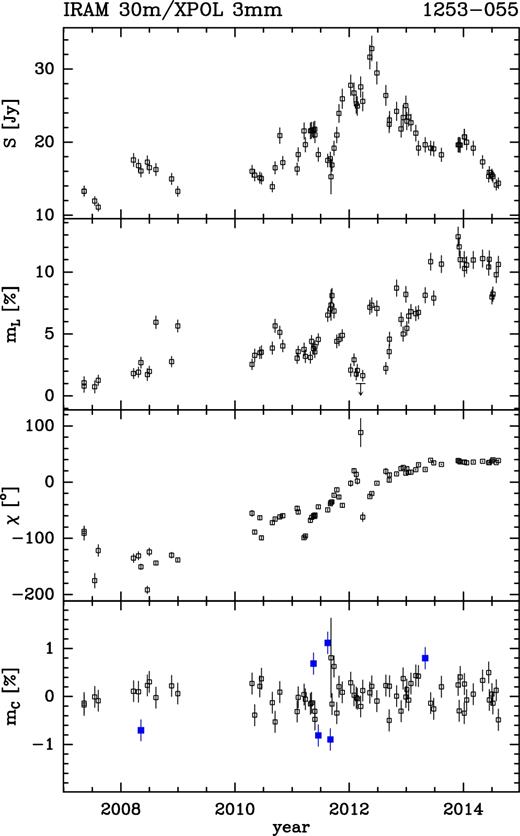
The quasar 1253−055 at 3 mm (z = 0.538). The four frames show, from top to bottom, the total flux density (Stokes I), the degree of linear polarization, mL; the polarization angle, χ, running from north to east in the equatorial system; and the degree of circular polarization, mC, which is detected at six epochs at S/N ≥ 3 (filled squares). Data and figure are from the POLAMI data base (Paper I).
2.1 Precision of measurements
Calibration of the observed Stokes Parameters and the correction of Q, U and V for instrumental polarization (IP) were described in Paper I. Here we apply an additional correction that captures a slow drift of the instrumental V due to the coarse time steps of the principal IP correction. The amplitude of the additional correction, sampled at 3-month steps, is small (≲0.5 per cent). It is recognizable only in Stokes V that is the Stokes parameter best determined with XPOL (see Thum et al. 2008).
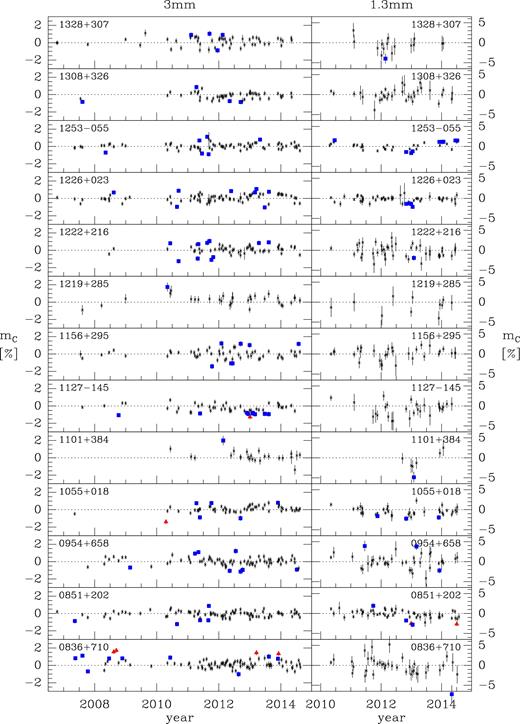
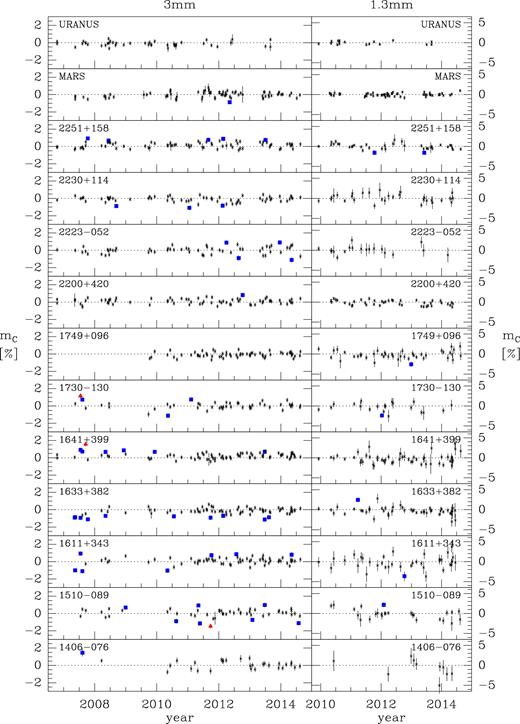
We use observations of the unpolarized sources Mars and Uranus for the measurement of the slow drift. Several independent observations are usually made in each 3-month interval. In a second step we use the mean of the brighter half of our AGN sample for an alternative derivation of the slow drift. Although polarized individually, the mean CP of an AGN sample should be unpolarized if a large enough number of observations of different sources is averaged, which is the case here. Both methods agree within their errors with the AGN giving a more precise result because of the much larger number of observations. In the 3-mm band, the overall rms scatter of V is reduced for these calibrators from 0.34 to 0.22 per cent after the subtraction of the slow drift. The reduction at 1 mm is however negligible, due to the higher statistical errors at this wavelength. The final degree of CP, mC, is then obtained from the IP-corrected observation of Stokes V by subtracting this slow drift only at 3 mm. The resulting time series of CP is shown in Fig. 2 for all sample sources at both wavebands. This figure also includes the calibrators Mars and Uranus.
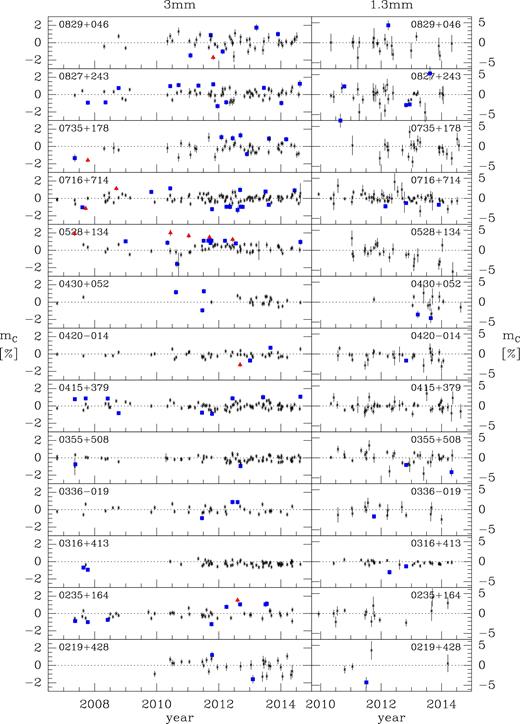
Time sequences of 3-mm (left) and 1-mm (right) observations of all 37 sources in our sample. The degree of circular polarization mC is shown in per cent with its 1σ error bar. Detections are shown as filled symbols (squares for S/N ≥ 3 or triangles for S/N ≥ 5, coloured blue or red, respectively, when viewed online).
– continued
– continued
The errors assigned to individual CP observations contain the statistical error of the Stokes V and I parameters and a systematic error estimated from the rms scatter of the calibrator observations described above, added in quadrature. Except for observations of very low total flux density, the systematic error is always dominant in 3-mm observations. In the 1-mm band, the systematic error is larger than the statistical error for observations where the total flux density is above 2.0 Jy. This is the case for 30 per cent of the observations. Quantitatively, we take the systematic error from the histograms in Fig. 4, for which data of the unpolarized Mars and Uranus were combined. The histograms are fitted by Gaussians, and we derive standard deviations of 0.28 ± 0.02 per cent (3 mm) and 0.37 ± 0.03 per cent (1.3 mm). For the 3-mm band, using a typical value of the statistical noise (0.11 per cent), this results in a mean 3σ detection threshold of 0.90 per cent. The higher systematic error in the 1-mm band together with the much higher thermal noise due to the 3–5 times higher system temperature result in a mean 3σ detection threshold of 1.5 per cent for a 2 Jy source and higher for the weaker ones.
Inspection of the time series of the calibrators (Fig. 2) indicates that the applied systematic errors do not always lead to a reliable estimate of the total errors. This is particularly the case for observations made during summer afternoons when the atmosphere is often disturbed by anomalous refraction. We have screened the data base for observations taken under such conditions and rejected any unreliable observations. The bulk of the data base is however unaffected by anomalous refraction and we consider a signal-to-noise ratio (S/N) = 3 a reliable statistical detection threshold. For individual detections we require S/N ≥ 5, as is common practice in massive data flows.
The global properties of our observations are further illustrated in Fig. 3 where the top frame labelled A shows the histogram of the 3 mm measurements of CP in all sample sources, irrespective of source type. The coloured bins indicate the observations with S/N exceeding 1 (green) and 3 (blue), while the bell-shaped envelope refers to all 2261 observations. The envelope is very symmetric and well centred on zero. Apparently, no systematic bias is introduced in the data acquisition or reduction. The small asymmetry in the panel labelled ‘G’ (radio galaxies) is exclusively due to 0316+413 (3C 84), a source already known for its strongly biased mC distribution (see Section 3.5 and Figs 4 and 2). Quantitatively, the mean of all data is mC = +0.014 ± 0.010 per cent and the rms scatter is σ = 0.40 ± 0.01 per cent. There are 34 more measurements with positive mC, corresponding to a negative/positive imbalance of only 0.75 per cent. The rms scatter of these measurements is significantly larger than that of the unpolarized calibrators (0.28 ± 0.02), as derived above. Clearly, CP is widespread in our sample, even if our sensitivity allows firm individual detections only for the top 1 per cent of events (Table 1 and Section 3.1).
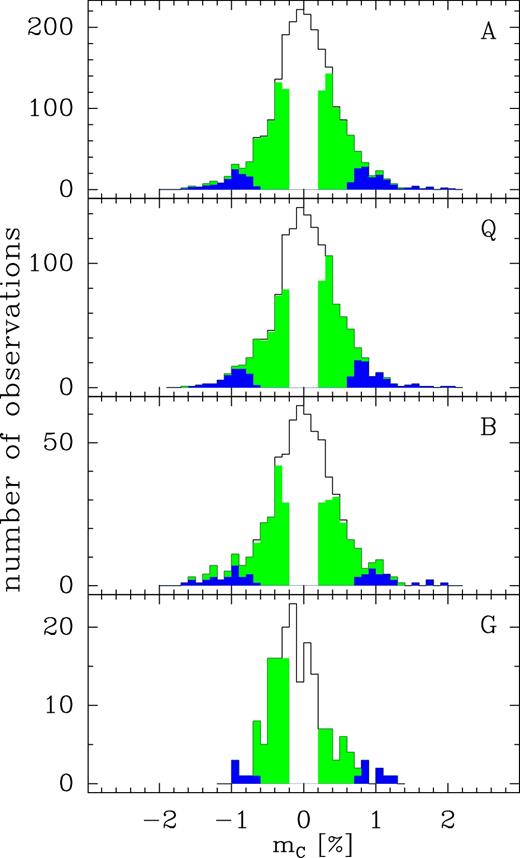
Histogram of circular polarization observations. The uppermost frame, labelled A, shows all observations (2261) obtained in our monitoring program. Frames below display different AGN classes: quasars (Q), BL Lac objects (B) and radio galaxies (G). Grey-scale codes measurements of different signal-to-noise ratios: dark grey (≥3), light grey (≥1). White space indicates observations at S/N < 1.
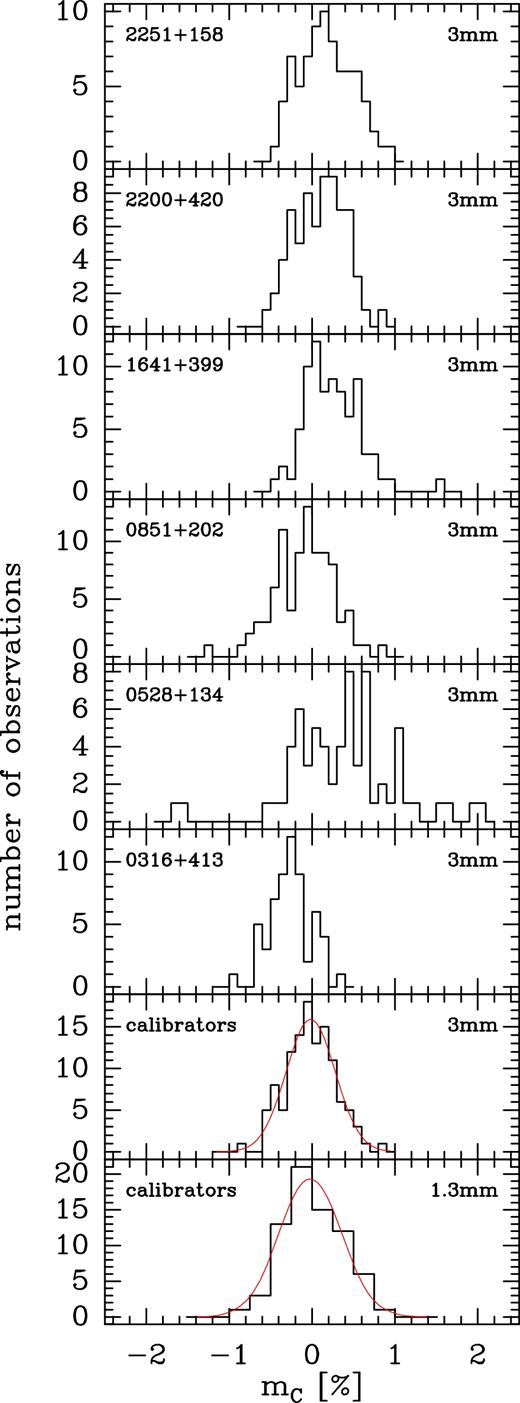
Histograms of the distribution of mC measurements at 3 mm wavelength for five selected AGN and the calibrators (Mars and Uranus combined) at 3 and 1.3 mm. Gaussian lines on the last two plots are fits to the data.
Summary of sources observed and detected in circular polarization at each waveband.
| Number of | 3 mm | 1 mm |
|---|---|---|
| sources in sample | 37 | 37 |
| observations | 2261 | 619 |
| sources detected at S/N ≥ 5/3 | 20/36 | 1/14 |
| individual detections at S/N ≥ 5/3 | 31/267 | 1/31 |
| Number of | 3 mm | 1 mm |
|---|---|---|
| sources in sample | 37 | 37 |
| observations | 2261 | 619 |
| sources detected at S/N ≥ 5/3 | 20/36 | 1/14 |
| individual detections at S/N ≥ 5/3 | 31/267 | 1/31 |
2.2 Calibration of the sign of Stokes |$\boldsymbol {V}$|
As there is no celestial calibrator of CP available at short millimetre wavelengths, calibration of the sign of Stokes V is not straightforward. We employed a novel method, described in detail in Appendix A, using the known transport of the strongly linearly polarized 3-mm signal from the Crab Nebula through the telescope's Nasmyth optics. At a suitable location in the receiver cabin a quarter-wave plate optimized for 3-mm wavelength was placed such that its fast axis made angles of ±45° with the known direction of linear polarization of the Crab at two specific hour angles. The resulting left- or right-handed CP provides the calibration of the sign of Stokes V. This calibration is independent of wavelength, as long as observations are made with identical set-up of frequency down-conversion.
We confirmed this sign calibration by making observations of the radio star MWC 349. This strong source of millimetre recombination lines is known to have a magnetic field that introduces CP at the level of 1 per cent in its H30α line emission (Thum & Morris 1999). Within the uncertainties associated with the time variability of the signal (Thum, Morris & Wiesemeyer 2012) the sign obtained agrees with previous observations. This strongly supports our present calibration, since the first observation by Thum & Morris (1999) used completely different equipment whose calibration of the Stokes V sign was however straightforward. MWC 349 may thus qualify as a calibrator for the sign of CP at short mm, and possibly also at submm wavelengths.
In an unrelated program (Agudo et al., in preparation) we monitored the Galactic Centre source Sgr A* with similar equipment as used for our POLAMI program. CP was detected throughout this campaign, consistently of negative sign. This is in agreement with many earlier detections (Bower, Falcke & Backer 1999; Sault & Macquart 1999; Bower et al. 2002a; Muñoz et al. 2012), and further confirms the sign of our Stokes V calibration.
3 RESULTS
During the 7 yr of our monitoring program we obtained more than 3300 observations in the 3-mm band and more than 2700 at 1 mm. Table 1 gives the corresponding numbers of valid observations that are lower due to occasional technical problems and observational errors, but mostly due to atmospheric instabilities or high water vapour. These affect the 1-mm band more, explaining the much lower number of valid 1 mm observations together with the lack of 1 mm receiver during the first 4 yr of the monitoring period. In the 3-mm band, more than half of the sources in the sample have at least one strong (S/N ≥ 5) detection, compared to only one at 1 mm. Altogether, 31 strong detections were made at 3 mm against only one at 1 mm. The S/N ≥ 3 detections give a similar difference between the two bands.
This order of magnitude reduction of detections is fully accounted for by the higher 1 mm detection threshold (factor of 1.7) and the lower number of valid observations (factor of 3.7), suggesting that the intrinsic frequency and properties of CP events may be quite similar at the two wavebands. The data in this table already demonstrate that CP at short mm wavelengths is widespread among blazars and highly variable. It is detectable at 3 mm wavelength with relative ease, but our sensitivity in the 1-mm band is barely adequate.
3.1 Detection rates
From the numbers given in Table 1 we calculate detection rates of 11.8 and 5.0 per cent for the 3 and 1 mm bands. Detection rates reported in our previous single epoch surveys are 6 (Agudo et al. 2010) and 8 per cent (Agudo et al. 2014) in the 3-mm band. These numbers are roughly comparable, especially when taking into account the lower sensitivity of the first survey. At 1 mm, the only previous single epoch survey (Agudo et al. 2014) reports no detections.
The single epoch MOJAVE survey (Homan & Lister 2006) observing at 15 GHz with milliarcsecond resolution detected 17 out of their sample of 133 sources, resulting in a detection rate of 13 per cent, nearly equal to our detection rate at 3 mm. This agreement is rather surprising, since there are at least two factors that tend to put our 3-mm survey at a disadvantage: (i) their higher polarization sensitivity (0.3 per cent versus 0.1 per cent) and (ii) beam depolarization of CP in our much larger beam. The similarity of the detection rates may however be understood if the lower 3 mm opacity acts to select the jet components with highest brightness temperature in much the same way as does the high angular resolution of the MOJAVE survey. We are also driven to the conclusion that the tendency for beam depolarization as observed in 3C 84 (Homan & Wardle 2004) cannot be strong in our AGN sample. In fact, 3C 84 is so far the only source where jet components of different CP sign are observed to be simultaneously present.
3.2 Source statistics
Table 2 summarizes the results derived from the time series (Fig. 2). For each source in the sample and both wavebands we give (i) the total number of observations with valid Stokes V data, (ii) the median mC, (iii) the standard deviation of mC and (iv) the number of detections above S/N ≥ 5 and ≥3, respectively. For sources that have been detected previously in CP, we add the reference to the respective publications.
List of sources observed and their circular polarization properties.
| Common | 3 mm | 1 mm | Previous | ||||||||
|---|---|---|---|---|---|---|---|---|---|---|---|
| Source a | name | Nobsb | mC c | σ d | Ndete | Nobsb | mC c | σ d | Ndet e | detections | |
| 0219+428 | 3C 66A | 30 | 0.01 | 0.73 | 0/2 | 4 | −0.68 | 2.86 | 0/1 | ||
| 0235+164 | AO 0235+164 | 49 | −0.14 | 0.55 | 1/8 | 14 | 0.19 | 1.69 | 0/0 | ||
| 0316+413 | 3C 84 | 59 | −0.25 | 0.25 | 0/2 | 29 | −0.41 | 0.59 | 0/2 | 1, 5 | |
| 0336−019 | CTA 26 | 37 | −0.17 | 0.43 | 0/3 | 15 | −0.10 | 1.16 | 0/1 | ||
| 0355+508 | NRAO 150 | 72 | −0.12 | 0.31 | 0/2 | 35 | 0.09 | 1.53 | 0/2 | ||
| 0415+379 | 3C 111 | 88 | −0.05 | 0.42 | 0/9 | 47 | −0.08 | 1.07 | 0/0 | ||
| 0420−014 | PKS 0420−01 | 46 | −0.13 | 0.35 | 1/2 | 29 | −0.28 | 1.12 | 0/1 | ||
| 0430+052 | 3C 120 | 26 | 0.05 | 0.50 | 0/3 | 13 | −0.83 | 1.81 | 0/2 | ||
| 0528+134 | PKS 0528+134 | 67 | 0.43 | 0.65 | 5/11 | 22 | −0.89 | 1.52 | 0/0 | ||
| 0716+714 | S5 0716+71 | 108 | 0.01 | 0.49 | 2/13 | 62 | −0.05 | 1.19 | 0/3 | 2, 3 | |
| 0735+178 | OI 158 | 50 | −0.20 | 0.66 | 1/7 | 21 | −0.18 | 1.62 | 0/0 | ||
| 0827+243 | OJ 248 | 70 | 0.16 | 0.57 | 0/12 | 33 | −0.03 | 2.24 | 0/5 | 1 | |
| 0829+046 | OJ 049 | 51 | 0.13 | 0.71 | 1/5 | 19 | −0.11 | 1.82 | 0/1 | ||
| 0836+710 | 4C 71.07 | 91 | 0.14 | 0.51 | 4/9 | 39 | −0.02 | 2.14 | 0/1 | 1, 3 | |
| 0851+202 | OJ 287 | 89 | −0.05 | 0.36 | 0/5 | 49 | −0.09 | 0.90 | 1/1 | 5, 6 | |
| 0954+658 | S4 0954+65 | 78 | 0.02 | 0.47 | 0/8 | 36 | −0.10 | 1.51 | 0/3 | 2 | |
| 1055+018 | 4C | 59 | 0.04 | 0.41 | 1/5 | 38 | −0.58 | 0.96 | 0/3 | 3, 6 | |
| 1101+384 | Mrk 421 | 25 | 0.14 | 0.58 | 0/1 | 7 | −1.27 | 2.23 | 0/1 | ||
| 1127−145 | PKS 1127−14 | 51 | −0.28 | 0.45 | 1/9 | 27 | −0.61 | 1.67 | 0/0 | ||
| 1156+295 | 4C 29.45 | 58 | −0.01 | 0.55 | 0/7 | 30 | 0.26 | 1.36 | 0/0 | 3, 6 | |
| 1219+285 | W Comae | 32 | 0.35 | 0.56 | 0/1 | 11 | −0.58 | 1.71 | 0/0 | ||
| 1222+216 | 4C +21.35 | 60 | 0.13 | 0.48 | 0/10 | 37 | −0.26 | 1.49 | 0/1 | ||
| 1226+023 | 3C 273 | 81 | 0.06 | 0.42 | 0/8 | 47 | −0.16 | 0.71 | 0/4 | 3, 4, 5 | |
| 1253−055 | 3C 279 | 76 | 0.03 | 0.35 | 0/6 | 34 | 0.32 | 0.77 | 0/6 | 3, 4, 5, 6 | |
| 1308+326 | OP 313 | 51 | −0.15 | 0.38 | 0/4 | 33 | −0.04 | 1.40 | 0/0 | ||
| 1328+307 | 3C 286 | 53 | 0.23 | 0.50 | 0/4 | 16 | −0.47 | 1.67 | 0/1 | 2 | |
| 1406−076 | PKS 1406−076 | 30 | 0.11 | 0.50 | 0/1 | 8 | −0.02 | 2.24 | 0/0 | ||
| 1510−089 | PKS 1510−08 | 52 | 0.06 | 0.49 | 1/7 | 26 | −0.08 | 1.23 | 0/1 | 6 | |
| 1611+343 | DA 406 | 68 | 0.10 | 0.41 | 0/7 | 36 | −0.18 | 1.60 | 0/1 | ||
| 1633+382 | 4C 38.41 | 76 | −0.17 | 0.37 | 0/10 | 46 | −0.29 | 0.94 | 0/1 | 3, 6, 7 | |
| 1641+399 | 3C 345 | 80 | 0.20 | 0.33 | 1/6 | 50 | −0.29 | 1.21 | 0/0 | 5, 7 | |
| 1730−130 | NRAO 530 | 48 | 0.05 | 0.40 | 1/3 | 21 | −0.14 | 1.07 | 0/1 | ||
| 1749+096 | 4C +09.57 | 60 | −0.09 | 0.27 | 0/0 | 43 | −0.26 | 0.97 | 0/1 | 6 | |
| 2200+420 | BL Lacertae | 70 | 0.12 | 0.29 | 0/1 | 42 | −0.16 | 0.60 | 0/0 | 1 | |
| 2223−052 | 3C 446 | 59 | 0.02 | 0.42 | 0/4 | 19 | 0.15 | 0.98 | 0/0 | 6 | |
| 2230+114 | CTA 102 | 64 | −0.06 | 0.32 | 0/3 | 29 | −0.03 | 0.94 | 0/0 | 6, 7 | |
| 2251+158 | 3C 454.3 | 77 | 0.16 | 0.32 | 0/5 | 38 | −0.04 | 0.74 | 0/2 | 1 | |
Note. References of previous detections: 1 – Agudo et al. (2010); 2 – Agudo et al. (2014); 3 – Homan & Lister (2006); 4 – Weiler & de Pater (1983); 5 – Aller et al. (2003); 6 – Vitrishchak et al. (2008); 7 – Gabuzda et al. (2008).
Explanation of columns: aIAU B1950 source name. J2000 positions are given in Paper I together with other source properties.
b Number of observations at the respective wavelength.
c Median value of circular polarization, in per cent, over the monitoring period.
drms of individual measurements of mC over the monitoring period.
e Number of detections (5σ/3σ) of circular polarization (we take 3σ detections to have S/N between 3 and 5, while 5σ detections have S/N ≥ 5).
In the 3-mm band, all but one sources of our sample (1749+096) were detected, many of them several times. The record holder is the quasar 0528+134 with 16 detections in the 3-mm band, five of which have S/N ≥ 5. The source with the most (109) observations, 0716+714, was detected 15 times. Detections in the 1-mm band are an order of magnitude less numerous.
Inspection of Table 2 shows that for many sources the median of the mC observations is offset from zero. Most sources have 3 mm mC distributions whose width is significantly broader than that of the unpolarized calibrators. We emphasize that the larger width is not due to higher noise of the AGN observations. As stated in Section 2.1, the noise of all sources is dominated by the systematic uncertainties as derived from the calibrators, and it is therefore very similar for all sources. For better visualization of these properties we built histograms of the mC distribution for all sources with more than 50 observations. Histograms with fewer observations are too noisy. At 3 mm, 28 sources satisfy this criterion, but unfortunately, none at 1 mm.
Fig. 4 shows these histograms for a few selected AGN together with the calibrators (Mars and Uranus combined). The mC distributions of the AGN are clearly different from that of the calibrators. The sources 0316+413 and 1641+399 have mC distributions not or barely broader than the calibrators, but offset from zero in opposite directions. Half a dozen more sources have similar offsets, positive and negative directions equally frequent. No instrumental effect can produce such systematic offsets, since each histogram is assembled from observations randomly distributed over the 7 yr monitoring period. However complex the intrinsic variability of blazars may be in general, there exists in a minority of sources a mechanism capable of maintaining a CP bias over 7 yr. Other histograms, like those for 0851+202 or 2200+420, appear to be more nearly flat-topped rather than Gaussian. Such distributions may arise in sources where mC moves randomly and rapidly between a positive and a negative limit. In some histograms there is weak evidence for a central dip near zero mC as in 2251+158 and in 0336–019, 0355+508 and 1101+384. Some other histograms, like in 0528+134, are quite irregular and not centrally peaked anymore.
We quantified the difference between the targets and the calibrator by calculating the reduced |$\chi ^2_{r}$| of the distribution of all 28 sources using the Gaussian of the calibrators as the parent distribution of an unpolarized source. The median value of these sources is |$\chi ^2_{r}$| = 2.55, corresponding to a confidence level of better than 99.5 per cent that these histograms are different from that of an unpolarized source. Even the source with the smallest |$\chi ^2_{r}$| (1.50 for 2230+114 that has 64 observations, three of which have mC > 3σ) is different from the unpolarized parent distribution at 95 per cent confidence. Clearly, all well observed 3 mm sources have mC distributions indicative of significant CP. This is also the case for our sample in general as shown by the histogram of all sample sources combined (Fig. 3, top) and discussed in Section 2.1.
3.3 Maximum degree of circular polarization
The maximum |mC| reliably detected at S/N ≥5 in our sample is 2.0 per cent at 3 mm (Fig. 3) and 2.6 per cent at 1 mm. CP stronger than 2.0 per cent was detected only once in each band, in 0528+134 (3 mm) and in 0851+202 (1 mm). Comparing with previous CP surveys at lower frequencies, we find that our |mC|max is significantly higher than most maxima found before. An early compilation of CP observations by Weiler & de Pater (1983) lists only two sources in their top |mC| bin between 0.4 and 0.5 per cent. Aller et al. (2003) using the University of Michigan radio telescope at 4.8 and 8 GHz monitored 16 blazars during many years. They also find a low maximum |mC| = 0.9 per cent. The MOJAVE first epoch survey (Homan & Lister 2006) made with the VLBA at 15 GHz finds a maximum |mC| of only 0.7 per cent. Using the same instrument and observing simultaneously at 15, 22 and 43 GHz (7 mm), Vitrishchak et al. (2008) found mC highest at their highest frequency. In a statistical sense, it appears that |mC| tends to increase with frequency, with our survey marking the present maxima of 2.0 and 2.6 per cent at 3 and 1 mm wavelengths, respectively.
Specific low-frequency (cm wavelength) studies of a few objects have however also turned up high CP detections. CP at the level 3 per cent was found in the blazar 1519−293 (Macquart et al. 2000) and claimed to originate in a very compact source component. In a detailed high-resolution study of the radio galaxy 3C 84, Homan & Wardle (2004) find similarly high levels of mC in several jet components. It therefore appears, as was already claimed by Macquart et al. (2000), that high resolution is key for detecting high mC.
However, the large beams of our single dish survey certainly do not resolve the AGN under study. High-resolution observations at short mm wavelengths often find that the jet consists of the core and several knots (Lee et al. 2008), potentially making our study vulnerable to beam–depolarization. Our finding of high |mC|max comparable to the values in high-resolution studies demonstrates that beam–depolarization is in fact negligible in our sample, in agreement with the discussion in Section 3.1. We conclude then that the statistical trend of mC increasing with frequency is not primarily due to increasing resolution, but reflects an intrinsic property of the CP generating mechanism. We resume discussion of this finding in Section 3.6.
3.4 Fast CP variability
Statistically, a source of our sample is detected at 3 mm 7.2 times above 3σ during the 83 months of our monitoring program. The mean time interval between detections is therefore nearly 1 yr. The typical source is thus detected at 3 mm only once in eight observations during the brief period characterized by our sampling interval. Given that the detection threshold of CP does not systematically vary during the monitoring period, the fastest time-scale of CP variation is then of the order of our sampling interval of ≲1 month during the denser sampled period after 2009 (see also Paper I).
Individual sources may occasionally depart from the mean picture. There is however only one case in the whole data base where S/N ≥5 detections were made contiguously in time. This occurred during 2007–2008 in 0836+710. In 0528+134, the source with the most detections, all of them are well separated by periods where mC is below the detection threshold. Inspection of the mC time sequences (Fig. 2) shows that this is the rule. Noteworthy exceptions are discussed in Sections 3.5 and 3.8, less prominent exceptions occur in 1226+023 and elsewhere.
The generally rapid variability of CP is very different from the behaviour of total flux density or linear polarization degree and angle. We studied the relation between these quantities using the discrete correlation function formalism that is described in detail in Paper III. No significant (S/N > 3) correlation was found between CP and any of the other three quantities. These latter three quantities vary significantly more smoothly with time (Fig. 1 and Paper III), demonstrating that our time sampling is nearly adequate in Stokes I, and it is mostly adequate for linear polarization during the most prominent flares. However, time variations of CP are clearly not resolved in our typical ≲1 month sampling interval. A more precise estimate of the variation time-scale requires dedicated and maybe more sensitive observations of a few selected sources.
Strong variability of CP was already noted in an early investigation by Komesaroff et al. (1984) where they monitored all Stokes parameters of 22 AGN with the Parkes telescope at 5 GHz during 6 yr. These authors find that CP has the highest fractional variability of the Stokes parameters, and time-scales are often shorter than 90 d, their average sampling interval. They explain these findings by Faraday conversion driven by rotation of the |$\boldsymbol {B}$|-field direction (BR-driven FC, see Section 3.6). Their mechanism acts on a fraction of the cross-section of a turbulent jet that may vary rapidly with time in a way that is uncorrelated with flux density or linear polarization. This scenario is close to the modern turbulent extreme multizone (TEMZ) model (Marscher 2014) in which the jet consists of a large number of randomly magnetized cells. Their magnetic field can be partially aligned in a shock and CP can be generated through the BR-driven FC mechanism. MacDonald & Marscher (2016) have calculated the transfer of polarized radiation in this situation and demonstrate that weak CP can indeed be generated at 43 GHz.
Alternatively, the rapid CP variations may originate very close to the black hole in the fluctuations of the accretion flow like those shown in simulations of the jet/wind/disc system around a black hole (McKinney, Tchekhovskoy & Blandford 2012). The time-scale for strong variations of the accretion rate in these simulations is found to be |${\sim }100\frac{r_{\rm g}}{c}$|, with rg being the gravitational radius and c the speed of light. For a maximally rotating black hole of 109 M⊙ this is 5 d, and longer for slower rotation rates and lower masses. The current models of the jet/wind/disc system cover the immediate surroundings of the black hole out to ∼50rg. This is much smaller than the distance to the millimetre core of the jet that is thought to be located at 1–10 pc (104–105rg) from the black hole (Marscher et al. 2008, 2010; Agudo et al. 2011; Fromm et al. 2015). If the modelled variations can propagate from the disc all the way out to the millimetre core, they might induce the fluctuations of the orientation of the field needed for the rapid fluctuations of CP that we observe.
3.5 Preference of handedness
In the same investigation quoted above Komesaroff et al. (1984) also noted that despite the strong fractional variability of CP, reversals of the sign of mC were rare. An even longer term sign consistency of mC was observed for the Galactic Centre black hole Sgr A* (Bower et al. 1999, 2002a; Sault & Macquart 1999; Muñoz et al. 2012; Agudo et al., in preparation) where CP was consistently found negative (left handed). Similar sign consistency was then reported for more AGN. Homan, Attridge & Wardle (2001) found sign consistency for five out of six AGN, and attributed this remarkable property to stability of the polarity of net magnetic flux in the jets.
Motivated by these observations we looked at the stability of the sign of mC in our sample of AGN. We find that at 3 mm mC had positive and negative detections in the majority of sources. Considering only sources with at least 10 detections (S/N ≥ 3) we find 29 such sources in our sample of 37. Only three have a clear preference for one sign (Table 3). These ‘quasi-unipolar’ sources have at most one detection of the discrepant sign. The source 0528+134 stands out with 16 detections, all but one of positive sign.
Sources with strong preference for the sign of mC at 3 mm wavelength. The number of observations with positive/negative sign (right-hand-circular, RHC/left-hand-circular, LHC) is given for detections at S/N of 3 and 2. Only sources with at least 10 detections are listed.
| Source | S/N ≥ 3 | S/N ≥ 2 | Previous detections | ||||
|---|---|---|---|---|---|---|---|
| +/− | +/− | ||||||
| 0316+413 | – | 0 | / | 13 | [2, 3, 6] see text | ||
| 0355+508 | – | 1 | / | 11 | |||
| 0528+134 | 15 | / | 1 | 27 | / | 2 | RHC [2] |
| 1127−145 | 0 | / | 10 | 1 | / | 20 | LHC [1] |
| 1633+382 | 0 | / | 10 | 1 | / | 18 | LHC [5] |
| 1641+399 | – | 18 | / | 0 | RHC [4] | ||
| 2251+158 | – | 18 | / | 0 | RHC [1]; [4] see text | ||
We add in Table 3 the detections made at the statistically less significant S/N of 2. The three unipolar sources found above remain strongly asymmetric with the same sign preferred. In addition, four more sources appear to be strongly unipolar, including the quasar 2251+158 with 18 detections of positive sign and no negative ones. We consider these seven sources as strong cases of unipolarity, but they constitute a 24 per cent minority of the 29 source with at least 10 detections. Among these seven sources, preference for positive or negative signs is roughly equally strong. The unipolar sources share this property with our full sample (Fig. 3) where positive and negative signs of mC are almost equally frequent.
From our list of unipolar sources, four have been monitored previously (Komesaroff et al. 1984; Homan & Wardle 1999). The polarity of three of them (0528+134, 1127−145 and 2251+158) is found in agreement, while for 0316+413 the behaviour of CP appears to be more complex. A crossing of zero occurred around 1980 (Aller et al. 2003) and Homan & Wardle (2004) made the remarkable discovery of the simultaneous presence of jet components of opposite polarity. During our monitoring period, all but one observations with S/N ≥ 1 had negative CP (Fig. 2). Another type of complexity may occur in 2251+158 where CP was detected at 22 and 43 GHz by Vitrishchak et al. (2008), albeit with different signs. Their sign at 43 GHz is positive, in agreement with our 18 observations at 86 GHz. It is conceivable that this change of sign, if real, may be caused in this particular case by the jet opacity changing from optically thick to thin near 30 GHz if CP is generated by the intrinsic mechanism at this event.
Such opacity-induced sign flips must however be rare or even absent at our short wavelengths. The majority of our observations were conducted with the 3- and 1-mm bands in parallel (see Paper I), permitting a reliable measurement of the spectral index α between these wavelengths at the time of the CP measurement. As shown in Paper III, α is negative (mean of the sample is −0.6), indicating optically thin continuum emission. Only in a few sources α reaches zero or small positive values for brief moments associated with total flux density peaks. We therefore discard opacity as a cause of CP sign flips.
In the jet model presented by Gabuzda et al. (2008) the sign of mC is determined by the pitch angle and the helicity of the jet |$\boldsymbol {B}$| field. The sign of mC may then be expected to stay constant as long as the basic geometry of the field does not change, as might be the case at the ejection of a new component of magnetized plasma. From our data (Table 3 and Section 3.5) this appears to be the case only for one-quarter of the AGN over the 7 yr monitoring period.
3.6 Origin of CP
Two mechanisms have been invoked for the generation of CP in the jets of AGN (Wardle & Homan 2003). First, weak CP of the order of the inverse Lorentz factor of the relativistic electrons is an inherent component of synchrotron radiation. Second, CP can arise in the transport of the linearly polarized synchrotron radiation through a non-uniform magnetic field (Faraday conversion). Recent observations at wavelengths of 2 cm or longer (Wardle et al. 1998; Homan et al. 2009; O'Sullivan et al. 2013) and theoretical investigations (Beckert & Falcke 2002; Ruszkowski & Begelman 2002) favour Faraday conversion as the dominant process.
The degree of synchrotron-generated (intrinsic) CP at our wavelength of 3 mm can be coarsely estimated from equation (9) in Wardle & Homan (2003) that considers a homogeneous jet with a partially ordered field. For a typical source in our sample we derive CP of the order of 1 per cent. This value is however likely an upper limit, because field reversals and a possible positron jet component both decrease CP. This suggests that synchrotron radiation is unlikely to generate the amount of CP observed in the bulk of our sample. We do not exclude, though, that the intrinsic mechanism is active or even dominant in cases with a high level of field order and optimum orientation.
Our study therefore supports the generally held view that it is Faraday conversion that causes CP. Faraday conversion in its simplest variant where, in homogeneous jets, conversion is driven by Faraday rotation (FR-driven FC) has however a very steep frequency dependence of ν−5 (Wardle & Homan 2003), and thus appears to be ruled out by our findings. However, following the discussion by these authors, BR-driven Faraday conversion where the |$\boldsymbol {B}$| field changes direction along the jet may have a flat or even inverted CP spectrum. This mechanism may be expected to operate naturally in helical fields where it can be extremely efficient. Since jets of this field structure are believed to be common (Gabuzda, Murray & Cronin 2004; Asada et al. 2008; Gómez et al. 2008, 2016; Marscher et al. 2008) Faraday conversion induced in helical fields appears to explain our finding of widespread and strong CP.
We caution that although we support BR-driven FC for the production of the CP observed in our sample, these previously discussed models are based on the assumption of homogeneous sources. For the more realistic case of inhomogeneous jets, like the self-similar jet model discussed by Blandford & Königl (1979), the frequency dependence of CP may be very different. CP from the intrinsic mechanism and from Faraday conversion may then have flat or even inverted spectrum (see the discussion by Wardle & Homan 2003). Our findings of widespread (Section 3.1) and high CP (Section 3.3) at short mm wavelengths support such models where CP is not strongly frequency dependent. Furthermore, it may be also possible that the intrinsic mechanism and BR- and FR-driven Faraday conversion operate simultaneously with relative contributions that change with time, be source dependent, or even change at different jet locations within the same source. In their detailed study of 3C 279 using high-resolution images at several radio frequencies, Homan et al. (2009) propose that some of the jet components have an inhomogeneous structure, and they tentatively attribute the CP detected in these components to the intrinsic mechanism. Unfortunately, our CP data at 1 mm are not yet accurate enough for deriving mC spectral indexes. Quasi-simultaneous CP spectra covering radio and mm wavelengths are needed for more definite conclusions.
3.7 Relation between linear and circular polarization
As we discussed in Section 3.6 that CP may result from Faraday conversion of linear polarization in regions of changing magnetic field, it is interesting to explore the statistical relation between mC and mL. Fig. 5 shows this relation for all 3 mm observations of all sources in our sample. Since we did not see any statistical difference between positive and negative mC data, we simply plot its absolute value |mC| against the degree of linear polarization mL.
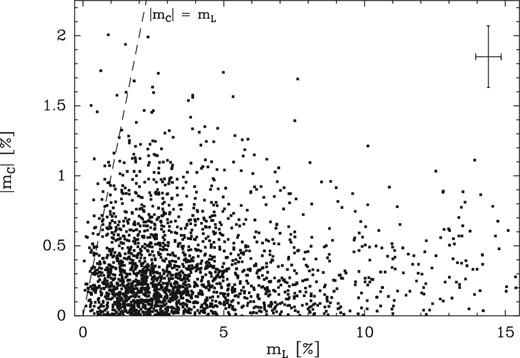
Circular polarization, mC, versus linear polarization, mL, at 3 mm wavelength. The absolute value of mC is plotted of all observations of all sources in our sample (Table 2) where mL > 0. The cross bar at the right-hand upper corner shows the typical observational error. The dashed line indicates the locus where circular and linear polarization are numerically equal.
The observations are contained between the maximum |mC| ∼2.0 per cent as discussed above and the maximum mL∼16 per cent.2 Apart from a general trend towards low linear and circular polarization, there is no correlation between the two kinds of polarization. High CP occurs at any value of mL. The weak decrease of the maximum |mC| towards high mL may just be due to a selection effect: there are fewer highly linearly polarized sources. The lack of correlation holds down to very low mL values. CP as high as 1.5 per cent is detected in some sources where mL is below the 3σ detection threshold of 0.75 per cent.
In Fig. 5 we have drawn a dashed line where linear and circular polarizations are equally strong. Half the linearly polarized flux is then converted into CP. Such high conversion efficiency is of course unlikely in AGN jets, given the randomness of magnetic field orientations, variable optical depths along the jet and possible beam depolarization. Furthermore, depolarization due to an internal or external Faraday screen may also play a role at our frequencies if its rotation measure is high and variable (see e.g. Attridge, Wardle & Homan 2005). Nevertheless, space near this dashed line appears to be well populated by observations up to ∼2.0 per cent.
There are 102 observations (4.5 per cent) located to the left of the limiting line, most of which are not shown due to their clustering at mL= 0. In only four of these observations, however, CP is both significantly detected and significantly larger than mL. Two of these observations were made on the quasar 0528+134.
Few other sources with this property have been found before: Sgr A* (Bower et al. 1999; Sault & Macquart 1999) and two low-luminosity AGN, M81* and NGC 6500 (Bower et al. 2002b). A common feature of these peculiar sources is the weakness or even absence of any jet. The four observations of AGN reported here do not easily fit into this picture. The explanation of the mL< |mC| property may involve nearly complete depolarization and a substantial component of low-energy electrons or thermal plasma near the mm core where efficient Faraday conversion can take place. In the model presented by Marscher et al. (2008), the short millimetre emission originates in the turbulent zone of the jet upstream of the standing conical shock. Conditions favouring mL < |mC| may then occur during periods when no strong shocks are propagating through this zone. Shocks would tend to align the magnetic field and thus likely increase linear polarization. In sources with powerful jets, like those in our sample, such periods may be rare, while they may be the rule in more quiescent sources like Sgr A*.
Ruszkowski & Begelman (2002) and Beckert & Falcke (2002) have theoretically studied these peculiar jets. In their models, the jet plasma is optically thick and highly turbulent. Complete depolarization is avoided if the magnetic flux has a small bias and if there are not too many field reversals along the line of sight. The small bias of the magnetic flux also explains the long-term persistence of the handedness of CP.
3.8 Events in CP time sequences
The dominant characteristic of the time sequences shown in Fig. 2 is their stochastic nature with only few observations above the 5σ threshold. Comparing the typical 1σ error bars with the distribution of the mC values, it is also evident that there are many more observations above 1σ than expected from a Gaussian distribution. These characteristics have already been quantified in the histograms of the mC distributions (Section 3.2), and they demonstrate the widespread presence of CP. But there are several events in the mC time sequences that cannot be caught by a mere statistical analysis. We briefly describe two of them in this section, but postpone more detailed analyses to later papers.
3.8.1 A dip in 1127−145
A nearly 1 yr long dip of mC occurs in this quasar centred on 2013.1. The dip is about 0.8 per cent deep. It is outlined by 12 observations, six of which are above 3σ and one being a 5σ detection. Most of the other observations outside the dip scatter around zero.
Fig. 6 shows that simultaneously to the mC dip occurs a sharp peak in linear polarization of similar time duration and also peaking around the same time. A weighted mean of the angle measurement during the mL peak is −80°, close to the position angle of the inner jet (Jorstad et al. 2001; Tingay et al. 2002). The sudden and simultaneous increase of linear and circular polarization has no counterpart in the total flux light curve that is increasing almost featurelessly over 4 yr between emission peaks near 2010.0 and 2014.0. There is no second observation of such simultaneous linear/circular polarization surges in our data base, nor are we aware of any such observation elsewhere. Such events are sufficiently rare that they get masked in mL versus mC plots like Fig. 5 by the much larger number of situations when mL and mC are unrelated or mC is simply below the detection threshold.
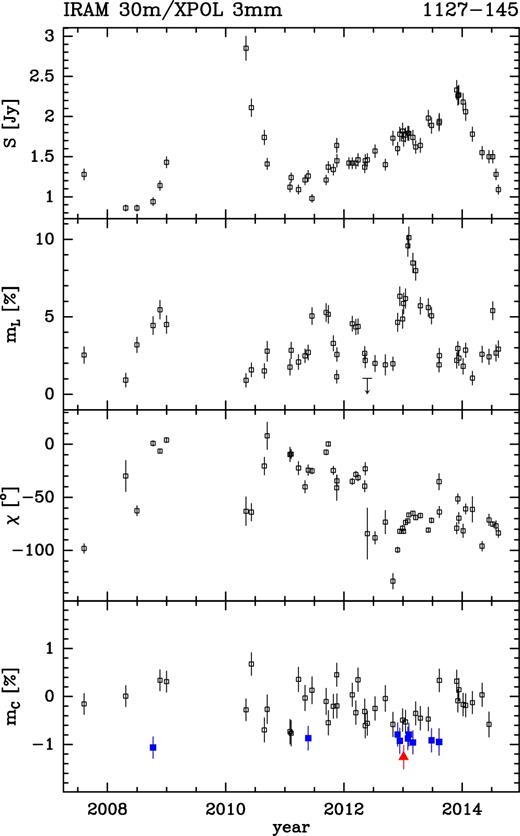
The quasar 1127−145 (z = 1.184). Detections of circular polarization are shown as filled symbols (squares for S/N ≥ 3 or triangles for S/N ≥ 5, coloured blue or red, respectively, when viewed online). Data are from the POLAMI data base.
Such correlation is however a natural consequence of Faraday conversion, the favoured mechanism for generating CP. The conversion efficiency from linear to circular polarization is of the order of 10 per cent during this rather singular event. We speculate that the event may be caused by the emergence of a new jet component with a high degree of field order, but we postpone a more detailed discussion to a separate paper.
3.8.2 Oscillatory behaviour in 1055+018
Systematic departures from mC = 0 occur in several sources in our sample, but are most noticeable in the BL Lac object 1055+018 over a large fraction of the monitoring period. Departures go in positive and negative directions, and are reminiscent of oscillations. The intervals of systematic offsets from zero last ≲1 yr, similar to 1127−145 discussed in the previous subsection. And as in the latter source, the excursions of mC occur in the interval between two peaks of total flux density where the emission evolves almost linearly without any significant features. But unlike the event in 1127−145, the mC excursions in 1055+018 do not have clear-cut counterparts in linear polarization (Fig. 7).
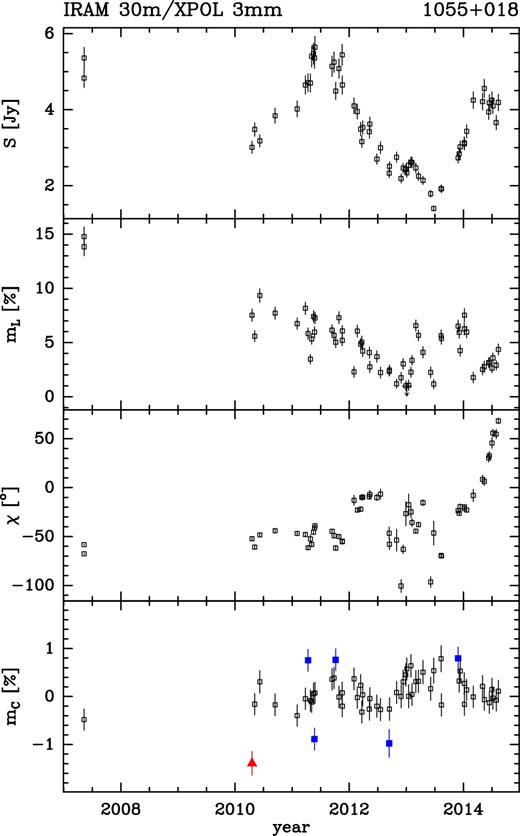
The BL Lac object 1055+018 (z = 0.888). Detections of circular polarization are shown as filled symbols (squares for S/N ≥ 3 or triangles for S/N ≥ 5). Data are from the POLAMI data base.
3.9 Other CP properties of our sample
No correlations have been found between mC and various other source parameters. Specifically, there is no dependence of mC on AGN class (Fig. 3) or redshift (not shown). A systematic difference between quasars and BL Lac objects could have followed from the difference in the angle under which the jets in both classes are viewed. The absence of such an effect is however understandable from the argument that CP is due to Faraday conversion that depends mainly on the structure of the magnetic field in the jet. The very weak dependence on viewing angle is discussed in Gabuzda et al. (2008).
Furthermore, mC does not systematically correlate with the simultaneously measured total flux density. The absence of any systematic correlation with linear polarization was demonstrated in Section 3.7.
Despite the considerable number of mC detections, we do not have a single observation where mC was detected at the 5σ level in both the 3- and 1-mm bands. Higher sensitivity will be required for a reliable measurement of the spectral slope of CP at short millimetre wavelengths.
4 CONCLUSIONS
We present the results of our 7-yr monitoring of CP of a sample of 37 AGN, the first such campaign at short millimetre wavelengths. The data, collected in the POLAMI data base together with simultaneous measurements of linear polarization and total flux density, demonstrate that CP is widespread in the blazar population and easily detectable at 3 mm. CP changes sign in most sources, but there is a subset of seven sources whose CP polarity is strongly biased.
The relatively easy detectability of CP at short mm wavelengths constrains the mechanism by which AGN generate CP. The values at which we detect CP are comparable to the highest values observed at cm wavelengths. The intrinsic CP of synchrotron radiation appears to be too weak to account for the bulk of our CP detections. The same is true for CP generated by FR-driven Faraday conversion due to the strong frequency dependence (∝ν−5) of this mechanism. We therefore favour BR-driven Faraday conversion where the linear polarization of the synchrotron emission in one region of the jet can be converted to CP in a downstream region with different orientation of its |$\boldsymbol {B}$| field (Wardle & Homan 2003). The assumed widespread presence of helical magnetic fields in AGN jets combined with our finding of widespread CP in the blazars sample (all but one source detected at 3 mm) may provide a natural environment for this mechanism. The potentially high efficiency of CP generation in helical fields was already pointed out by these authors. Quasi-simultaneous CP spectra, ideally observed at high angular resolution and covering radio and mm wavelengths, are however needed for more definite conclusions.
A singular event observed in the quasar 1127−145 where around the year 2013.1 the quasar went through a nearly 1-yr long period of correlated linear and circular polarization. We speculate that the event may be caused by the emergence of a new jet component with a high degree of field order, but postpone a detailed interpretation to a future paper.
The easy detectability of CP furthermore demonstrates that the large beam used in our observations is not a severe handicap. Apparently, at our high observing frequency only the jet core and very few more jet components are visible, possibly due to reduced opacity at short mm wavelengths. This greatly diminishes the chances of self-cancellation of CP from components of different CP polarity inside the beam.
We find that CP varies at short (≲1 month) and longer (∼1 yr) time-scales. The fast variations of CP may either be caused by a high level of turbulence developing downstream in the jet (Marscher 2014) or originate in instabilities of the disc/jet system near the black hole as found in recent simulations (McKinney et al. 2012). A characteristic time-scale for a 109 M⊙ black hole rotating near maximum is 5 d. If such variations propagate from the disc to the pc-scale jet, they might induce the fluctuations of the orientation of the field needed for the rapid fluctuations of CP that we observe.
The long time-scale variations however cannot be explained in this way. The subset of sources (24 per cent of our sample) that have a strong bias in their CP polarity like 3C 84 pose a similar problem. These sources may require more quiescent conditions in their jets, possibly approaching the situation described by Enßlin (2003) where the sense of CP is directly related to the sense of rotation of the black hole.
We cannot presently exclude that there exists in fact a continuous range of time-scales, due to limitations of the sampling density and sensitivity of our observations. A dedicated programme using an order of magnitude denser sampling and higher instrumental sensitivity is needed for a few of the most promising sources.
Acknowledgements
We are grateful to Daniel Homan (Denison University, USA) for valuable comments and for sharing unpublished data, and to Ioannis Myserlis (MPIfR, Germany) for a careful reading of the manuscript. We thank an anonymous referee for insightful and helpful comments. This paper is based on observations carried out with the IRAM 30-m telescope. IRAM is supported by INSU/CNRS (France), MPG (Germany) and IGN (Spain). CT thanks the gildas software group, notably Sebastien Bardeau, for competent and rapid support. IA acknowledges support by a Ramón y Cajal grant of the Ministerio de Economía y Competitividad (MINECO) of Spain. The research at the IAA-CSIC was supported in part by the MINECO through grants AYA2016-80889-P, AYA2013-40825-P and AYA2010-14844, and by the regional government of Andalucía through grant P09-FQM-4784. This research has made use of the NASA/IPAC Extragalactic Database (NED) which is operated by the Jet Propulsion Laboratory, California Institute of Technology, under contract with the National Aeronautics and Space Administration. We have also made use of NASA's Astrophysics Data System Bibliographic Services.
We keep the linear polarization calibrator 1328+307 in the sample, since its CP properties are largely unexplored.
We follow the IAU convention on polarization that designates a wave as right-hand circular (RHC) if its electric vector rotates counterclockwise when looking into the approaching wave. This convention also defines Stokes V = RHC − LHC.
REFERENCES
APPENDIX A: DETERMINATION OF THE SIGN OF STOKES V
The Stokes parameters I, Q, U and V have units of flux density, but unlike I, the parameters giving the polarization Q, U and V can have positive and negative signs. The calibrations of their sign with XPOL has been briefly described in Thum et al. (2008) for the previous generation receiver on the IRAM 30-m telescope. Here we give a detailed description for the current receiver EMIR.
The most practical of the three methods described by Thum et al. (2008) uses observations of the Crab Nebula that is easily detected at 3 mm. Although the CP of the Crab Nebula is negligibly small at any radio wavelength (see Wiesemeyer et al. 2011 and references therein), its linear polarization at short millimetre wavelengths is high, mL ∼30 per cent, and its angle is well measured, χ = 152° (Aumont et al. 2010). Using a quarter-wave plate (QWP) optimized for 86 GHz the linear polarization is then readily converted to a strong circularly polarized signal. As soon as the relative orientation of the polarization of source, receiver and the optical axis of the plate are known, the distribution of the incoming linearly polarized flux into outgoing linearly and circularly polarized flux components and their orientation and sign is determined.
Fig. A1 shows observations of the Crab Nebula in Stokes Q and U over an hour angle (HA) range where Q attains a broad maximum near HA = −1.7 and a sharper minimum near +1.1. Stokes Q and U curves refer to the Nasmyth coordinate system where the receivers are stationary and where the x-coordinate is horizontal and y vertical. At HA = −1.7 all linearly polarized flux is then in the horizontal component, and in the vertical component at HA = +1.2.
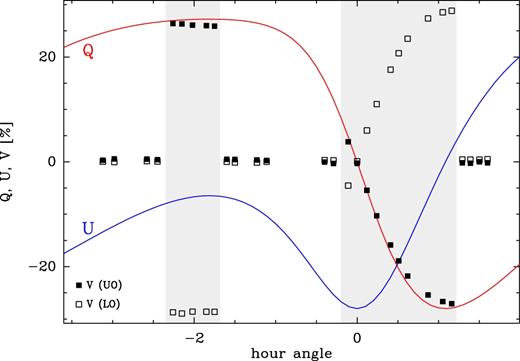
Circular polarization of the Crab Nebula as measured in the Nasmyth coordinate system KN versus hour angle. Observations in both sidebands are shown. The grey shaded areas indicate periods when a quarter-wave plate was inserted in the beam path. The continuous curves labelled Q and U indicate how the Crab Nebula's linearly polarized flux projects into KN.
We inserted a QWP into the beam path during the two periods that cover the two critical HAs. The plate was oriented such that the horizontal component H makes an angle of 45° counted counterclockwise from the grooves as viewed from the receiver. In this configuration, incoming H is nearly completely converted into left-hand circular (LHC) polarization.3 Stokes V is thus at a negative maximum (LHC) at HA = −2.0 and at a positive maximum (RHC) at HA = +1.2 where the incoming linear flux is fully in the local vertical component. Since there is an even number (6) of reflections between the plate and the aperture plane, LHC at the plate is also LHC incident on to the telescope. Therefore, the QWP makes appear the Crab Nebula as a strongly LHC polarized celestial source when observed near HA = −2.0 and as RHC near HA = +1.2.
These strongly circularly polarized waves are seen by the linearly polarized channels of EMIR as waves whose vertical component is advanced/retarded by 90° at the critical HAs = −2.0/+1.2. Since XPOL derives Stokes V from cross-correlation of the two channels after down-conversion into one of its four IF subbands (Carter et al. 2012), we must consider how down-conversion affects the relative phase between the two wave components.
Frequency down-conversions maintain the phase relationship of the original waves at radio frequency if down-conversion occurs into the upper sideband (USB), but the relative phase is inverted when downconverted into the lower sideband (LSB). Table A1 summarizes the phase relationship resulting for the four EMIR subbands. A positive sign indicates the phase between two incoming waves at radio frequency is maintained after down-conversion, and inverted for the subbands with negative signs.
Phase relationship with respect to radio frequency for the EMIR subbands.
| Subband | LO | LI | UI | UO |
|---|---|---|---|---|
| IF frequency, GHz | −10 | −6 | +6 | +10 |
| Phase relation | + | − | + | − |
| Subband | LO | LI | UI | UO |
|---|---|---|---|---|
| IF frequency, GHz | −10 | −6 | +6 | +10 |
| Phase relation | + | − | + | − |
We have made observations of the Crab Nebula at 86 GHz using EMIR configured to record the lower outer (LO) and upper outer (UO) sidebands simultaneously. XPOL observations were made during HAs from −3.0 to +1.5. At or near the critical HAs the QWP was located in the beam as described above. The results obtained are shown in Fig. A1 where the periods with QWP inserted are greyed.
Outside the greyed periods the observed Stokes V is zero in both sidebands as it should be (Wiesemeyer et al. 2011). Inside the first greyed area near HA = −2.0 apparent CP is as strong as the linear polarization observed at 86 GHz (Aumont et al. 2010). The Crab's linearly polarized flux is nearly fully converted into circular as expected. We find Stokes V negative for the LO subband and positive for the UO subband. In the second greyed window near HA = +1.2 these signs are reversed, and as discussed above. Since we expect LHC (Stokes V negative) near HA = −2.0, the subband LO gives the correct result. According to Table A1, the signs of the subbands LI and UO must be inverted, while the sign of UI is preserved. The EMIR Stokes V data that we discuss in this paper were all obtained in the LI subband, and their sign has consequently been inverted in accordance with Table A1.
