


1-20 of 13704

Journal Article
Erratum: Doppler confirmation of TESS planet candidate TOI1408.01: grazing transit and likely eccentric orbit
Monthly Notices of the Royal Astronomical Society: Letters, Volume 531, Issue 1, June 2024, Page L33, https://doi.org/10.1093/mnrasl/slae027
Published: 17 April 2024
Journal Article
ACCEPTED MANUSCRIPT
Scaling and Universality in the Temporal Occurrence of Repeating FRBs
Monthly Notices of the Royal Astronomical Society: Letters, slae031, https://doi.org/10.1093/mnrasl/slae031
Published: 13 April 2024
Journal Article
ACCEPTED MANUSCRIPT
Evidence of the gamma-ray counterpart from nova FM Cir with Fermi-LAT
Monthly Notices of the Royal Astronomical Society: Letters, slae032, https://doi.org/10.1093/mnrasl/slae032
Published: 13 April 2024
Journal Article
ACCEPTED MANUSCRIPT
On dataset tensions and signatures of new cosmological physics
Monthly Notices of the Royal Astronomical Society: Letters, slae030, https://doi.org/10.1093/mnrasl/slae030
Published: 12 April 2024
Journal Article
ACCEPTED MANUSCRIPT
The radius variations of accreting main sequence stars and mass transfer instability
Monthly Notices of the Royal Astronomical Society: Letters, slae029, https://doi.org/10.1093/mnrasl/slae029
Published: 10 April 2024
Journal Article
ACCEPTED MANUSCRIPT
Primordial Intermediate and Supermassive Black Hole formation during the electron-positron annihilation epoch
Monthly Notices of the Royal Astronomical Society: Letters, slae028, https://doi.org/10.1093/mnrasl/slae028
Published: 09 April 2024
Image
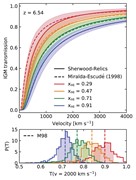
Top: mock IGM damping wings realigned along the velocity axis such...
in
Monthly Notices of the Royal Astronomical Society: Letters
>
The origin of the characteristic shape and scatter of intergalactic damping wings during reionization
Published: 08 April 2024
Figure 1.
Top: mock IGM damping wings realigned along the velocity axis such that the different transmission curves all reach a transmission T = 0 at the same point. The different colours represent different volume-weighted average neutral fractions. The solid lines are the median values of the transmissio
Image
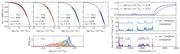
Top left: the coloured points show the IGM transmission at v...
in
Monthly Notices of the Royal Astronomical Society: Letters
>
The origin of the characteristic shape and scatter of intergalactic damping wings during reionization
Published: 08 April 2024
Figure 2.
Top left: the coloured points show the IGM transmission at v = 2000 km s −1 as a function of the average H i number density along the line of sight, weighted by its contribution to the damping wing. Each panel shows results at a different volume-weighted average IGM neutral fraction. The verti
Journal Article
The origin of the characteristic shape and scatter of intergalactic damping wings during reionization
Monthly Notices of the Royal Astronomical Society: Letters, Volume 531, Issue 1, June 2024, Pages L34–L39, https://doi.org/10.1093/mnrasl/slae022
Published: 08 April 2024
Image
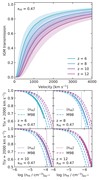
Top: mock IGM damping wings realigned along the velocity axis such...
in
Monthly Notices of the Royal Astronomical Society: Letters
>
The origin of the characteristic shape and scatter of intergalactic damping wings during reionization
Published: 08 April 2024
Figure 3.
Top: mock IGM damping wings realigned along the velocity axis such that the different transmission curves all reach a transmission T = 0 at the same point. The different colours represent different redshifts. The solid lines are the median values of the transmission curves and the shaded regions
Image
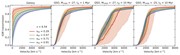
Mock IGM damping wings realigned along the velocity axis such that the diff...
in
Monthly Notices of the Royal Astronomical Society: Letters
>
The origin of the characteristic shape and scatter of intergalactic damping wings during reionization
Published: 08 April 2024
Figure 4.
Mock IGM damping wings realigned along the velocity axis such that the different transmission curves all reach a transmission T = 10 −6 at the same point. The colours represent different volume-weighted average IGM neutral fractions. The solid line is the median transmission curve and the shaded
Journal Article
ACCEPTED MANUSCRIPT
Diverse features of dust particles and their aggregates inferred from experimental nanoparticles
Monthly Notices of the Royal Astronomical Society: Letters, slae025, https://doi.org/10.1093/mnrasl/slae025
Published: 04 April 2024
Image
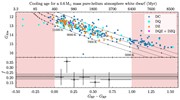
Top panel: the Gaia Hertzsprung–Russell Diagram (HRD) showing the...
in
Monthly Notices of the Royal Astronomical Society: Letters
>
The frequency of metal enrichment of cool helium-atmosphere white dwarfs using the DESI early data release
Published: 04 April 2024
Figure 1.
Top panel: the Gaia Hertzsprung–Russell Diagram (HRD) showing the metal-enriched (orange and magenta triangles) and non-enriched (blue stars and cyan squares) systems used in the calculation of the frequency of planetary systems around cool, helium-atmosphere white dwarfs, f (see Section 3 ).
Journal Article
The frequency of metal enrichment of cool helium-atmosphere white dwarfs using the DESI early data release
Monthly Notices of the Royal Astronomical Society: Letters, Volume 531, Issue 1, June 2024, Pages L27–L32, https://doi.org/10.1093/mnrasl/slae026
Published: 04 April 2024
Journal Article
The Milky Way bar pattern speed using Hercules and Gaia DR3
Monthly Notices of the Royal Astronomical Society: Letters, Volume 531, Issue 1, June 2024, Pages L14–L19, https://doi.org/10.1093/mnrasl/slae024
Published: 30 March 2024
Image
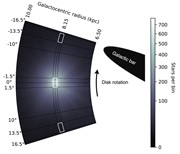
Gaia DR3 data set in the context of the MW disc. This region exten...
in
Monthly Notices of the Royal Astronomical Society: Letters
>
The Milky Way bar pattern speed using Hercules and Gaia DR3
Published: 30 March 2024
Figure 2.
Gaia DR3 data set in the context of the MW disc. This region extends from Galactocentric radius R = 6.5 kpc to R = 10 kpc, and from median azimuth ϕ = −15 ○ to ϕ = 15 ○ . An approximation of the Galactic bar is also shown. The MW disc is rotating clockwise (in the direction of −ϕ), and the sol
Image
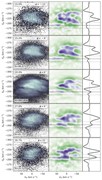
The velocity plane and its wavelet transformation for five neighbourhoods l...
in
Monthly Notices of the Royal Astronomical Society: Letters
>
The Milky Way bar pattern speed using Hercules and Gaia DR3
Published: 30 March 2024
Figure 3.
The velocity plane and its wavelet transformation for five neighbourhoods located at ϕ = −15 ○ , −9 ○ , 0 ○ , 9 ○ , and 15 ○ . ϕ = 0 ○ corresponds to the location of the Sun, and negative ϕ is in the direction of rotation, while positive ϕ is counter to the direction of rotation. The left column sh
Image
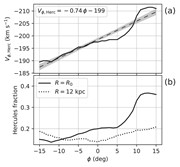
Properties of Hercules as a function of azimuth. The top panel shows the me...
in
Monthly Notices of the Royal Astronomical Society: Letters
>
The Milky Way bar pattern speed using Hercules and Gaia DR3
Published: 30 March 2024
Figure 4.
Properties of Hercules as a function of azimuth. The top panel shows the mean V ϕ for the Hercules group as detected using the location of the peak in the wavelet histogram. A linear fit with the 95 per cent confidence interval is shown as a dashed line and grey shading. The best-fitting equation
Image
Panel a shows the 2D histogram of all the solar neighbourhood stars in the ...
in
Monthly Notices of the Royal Astronomical Society: Letters
>
The Milky Way bar pattern speed using Hercules and Gaia DR3
Published: 30 March 2024
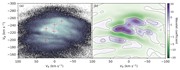
Figure 1.
Panel a shows the 2D histogram of all the solar neighbourhood stars in the V R – V ϕ kinematic plane using Gaia DR3 with a bin size of 0.5 km s −1 . Panel b shows the resultant wavelet transformed image at a scale of 8–16 km s −1 . The purple and green regions depict the relative strength of t
Image
Hercules azimuthal velocity as a function of Galactocentric radius. Followi...
in
Monthly Notices of the Royal Astronomical Society: Letters
>
The Milky Way bar pattern speed using Hercules and Gaia DR3
Published: 30 March 2024
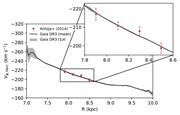
Figure 5.
Hercules azimuthal velocity as a function of Galactocentric radius. Following the technique outlined in Antoja et al. ( 2014 ), we determine V ϕ for the Hercules mode as a function of radius using our Gaia DR3 data set at ϕ = 6 ○ . Our results are shown as a solid black line with the grey regio
