


Abstract
Exoplanets of a few Earth masses can be now detected around nearby low-mass stars using Doppler spectroscopy. In this Letter, we investigate the radial velocity variations of Kapteyn's star, which is both a sub-dwarf M-star and the nearest halo object to the Sun. The observations comprise archival and new HARPS (High Accuracy Radial velocity Planet Searcher), High Resolution Echelle Spectrometer (HIRES) and Planet Finder Spectrograph (PFS) Doppler measurements. Two Doppler signals are detected at periods of 48 and 120 d using likelihood periodograms and a Bayesian analysis of the data. Using the same techniques, the activity indices and archival All Sky Automated Survey (ASAS-3) photometry show evidence for low-level activity periodicities of the order of several hundred days. However, there are no significant correlations with the radial velocity variations on the same time-scales. The inclusion of planetary Keplerian signals in the model results in levels of correlated and excess white noise that are remarkably low compared to younger G, K and M dwarfs. We conclude that Kapteyn's star is most probably orbited by two super-Earth mass planets, one of which is orbiting in its circumstellar habitable zone, becoming the oldest potentially habitable planet known to date. The presence and long-term survival of a planetary system seem a remarkable feat given the peculiar origin and kinematic history of Kapteyn's star. The detection of super-Earth mass planets around halo stars provides important insights into planet-formation processes in the early days of the Milky Way.
1 INTRODUCTION
Sub-m s−1 velocity precision can now be achieved for M dwarfs resulting from stabilized spectrographs [such as HARPS (High Accuracy Radial velocity Planet Searcher); Mayor et al. 2003] and specialized spectral analysis techniques (Anglada-Escudé & Butler 2012). This increased sensitivity enables the detection of planets of a few-Earth masses orbiting in the star's habitable zone. Recently, statistical population analyses of the NASA/Kepler mission (Dressing & Charbonneau 2013), and ground-based Doppler surveys (Bonfils et al. 2013; Tuomi et al. 2014b), suggest that every low-mass star has at least one (or more) planet with an orbital period less than 50 d. Very small planets in very short period orbits have recently been discovered by the Kepler mission (e.g. KOI-1843; Ofir & Dreizler 2013). We recently started the Cool Tiny Beats survey to characterize the Doppler variability over short time-scales and search for such small planets in short-period orbits around nearby low-mass stars. The programme uses HARPS spectrograph installed at the 3.6 m European Southern Observatory (ESO) telescope at La Silla/Chile and its northern counterpart at the Telescopio Nationale Galileo/La Palma.
2 KAPTEYN'S STAR
At only 3.91 pc, Kapteyn's star (or GJ 191, HD 33793) is the closest halo star to the Sun (van Leeuwen 2007). It is subluminous with respect to main-sequence stars of the same spectral type and was spectroscopically classified as an M1.0 sub-dwarf by Gizis (1997). A radius of 0.291 ± 0.025 R⊙ was directly measured by Ségransan et al. (2003) using interferometry. This combined with an estimate of its total luminosity was then used to derive an effective temperature of 3570 ± 156 K and its mass was estimated to be 0.281 ± 0.014 M⊙. Woolf & Wallerstein (2005) determined a metallicity of [M/H] = −0.86 which coincides with several later estimates within 0.05 dex (e.g. Neves et al. 2013). We independently obtained estimates of its metallicity and temperature by comparing its observed colours (B, V, J, H and K) to synthetically generated ones from the PHOENIX library (Husser et al. 2013), obtaining compatible values of [Fe/H] = −0.89 and 3550 ± 50 K. Only an upper limit has been measured for its projected rotation velocity (vsin i < 3 km s−1; Browning et al. 2010), and its X-ray luminosity has been measured to be comparable to other multiplanet host M dwarfs such as GJ 876 and GJ 581 (Walkowicz, Johns-Krull & Hawley 2008). Therefore, planets of a few Earth masses orbiting such an inactive M-star should be detectable using Doppler spectroscopy (Barnes, Jeffers & Jones 2011). A precise age estimation of the star cannot be obtained from models, as they change very little for M < 0.6 M⊙ in the range of ages between 0.4 and 15 Gyr (Baraffe et al. 1997; Ségransan et al. 2003). The low metallicity and halo kinematics suggest an ancient origin, which is consistent with its low activity and slow rotation.
3 OBSERVATIONS
The observations comprise both new and archival data from HARPS, High Resolution Echelle Spectrometer (HIRES) and Planet Finder Spectrograph (PFS) spectrometers. HARPS is a stabilized high-resolution spectrometer (resolving power ∼110 000) covering from 380 to 680 nm. The HARPS data we use come from two programmes: the Cool Tiny Beats survey and archival data from the first HARPS-GTO survey. The Cool Tiny Beats data were obtained in two 12 night runs in 2013 May (11 spectra) and in 2013 December (55 spectra). The HARPS-GTO data contain 30 spectra taken between 2003 and 2009. Bonfils et al. (2013) reported some possible signals on Kapteyn's star, but no detection claim could be made at the time. Doppler measurements were obtained using the least-squares template-matching approach as implemented by the harps-terra software (Anglada-Escudé & Butler 2012). For each spectrum, we also use two measurements of the symmetry of the mean line profile as provided by the HARPS data reduction software. These are the bisector span (BIS) and the full width at half-maximum (FWHM) of the cross-correlation function. BIS and FWHM are known to correlate with activity-induced features that can cause spurious Doppler signals. For example, changes in the line symmetry caused by corotating dark and magnetic spots induce changes in the symmetry of the lines that produce spurious Doppler shifts (e.g., Reiners et al. 2013). The variability in the Ca ii H+K emission lines was also measured by harps-terra through the S-index. The variability in the S-index is also known to correlate with magnetic activity of the star (Gomes da Silva et al. 2012) and localized active regions such as spots. Any Doppler signal with a period equivalent to variability detected in the BIS, FWHM and S-index is likely to be spurious.
We include 30 Doppler measurements spanning between 1999 and 2008 using the HIRES spectrometer at Keck (Vogt et al. 1994). These measurements were obtained using the iodine cell technique as described in Butler et al. (1996). A new HIRES stellar template was generated by deconvolving a high signal-to-noise iodine-free spectrum of the star applying maximum-likelihood deconvolution with boosting (MorhácŽ & Matouøsec 2009). The star is never at an altitude greater than 26 deg from Hawaii, which could explain the lower accuracy compared to the HARPS measurements. The long baseline of HIRES puts strong constraints on the long-period variability and mitigates alias ambiguities in the HARPS data. We also included eight new Doppler measurements obtained with PFS (Crane et al. 2010) at Magellan/Las Campanas observatory, also using the iodine cell technique. While the statistical contribution of PFS is small, the significance of the preferred solution increases thus providing further support to the signals. All spectroscopic measurements used are given in Table 1.
Spectroscopic measurements. Median value and a perspective acceleration were subtracted to each RV set (Ins. 1 is HARPS, 2 is HIRES, 3 is PFS). FWHM, BIS and S-index are provided for HARPS only. Uncertainty in the FWHM is 2.5 × σBIS.
| JD | RV | σRV | Ins. | BIS | σBIS | FWHM | S-index | σS-index |
|---|---|---|---|---|---|---|---|---|
| (d) | (m s−1) | (m s−1) | (m s−1) | (m s−1) | (km s−1) | |||
| 245 2985.741 11 | 3.11 | 0.80 | 1 | −4.64 | 0.86 | 3.215 61 | 0.2966 | 0.0042 |
| 245 2996.763 21 | 3.00 | 0.27 | 1 | −9.75 | 0.56 | 3.192 06 | 0.2699 | 0.0033 |
| 245 3337.800 96 | −2.65 | 0.89 | 1 | −8.17 | 0.76 | 3.180 36 | 0.1859 | 0.0036 |
| 245 3668.835 37 | −2.57 | 0.52 | 1 | −10.27 | 0.49 | 3.212 16 | 0.2678 | 0.0026 |
| … |
4 SIGNAL DETECTION METHODS
The initial signal detection is performed using log-likelihood periodograms (Baluev 2009; Anglada-Escudé et al. 2013) and tempered Markov chain samplings using the delayed-rejection adaptive Metropolis method (or DRAM; Haario et al. 2006) as implemented in Tuomi et al. (2014a). These methods produce maps of the maximum likelihood and posterior densities as a function of the period being investigated. As in classic periodograms, preferred periods will appear as peaks (local probability maxima). The significance is then assessed using the Bayesian criteria described in Tuomi et al. (2014b). We say that a Doppler signal is detected if (1) its period is well constrained, (2) its amplitude is statistically significantly different from zero and (3) inclusion of the signal in the model increases the Bayesian evidence by a factor of 104, which is more conservative than usual because important effects might be missing in the model, especially when combining data from different instruments. The model of the observations is fully encoded in the definition of the likelihood function. In addition to the usual Keplerian parameters, our model includes three nuisance parameters for each instrument (INS): a constant offset γINS, an extra white-noise term σINS and a moving average coefficient ϕINS that quantifies the amount of correlation between consecutive measurements. ϕINS is bound between +1 and −1 (anticorrelation), and a value consistent with zero implies no significant correlation. Our model also assumes an exponential decay of the correlation that depends on a characteristic time-scale τINS. Adding it as a free parameter led to overparametrization, so a fixed value of τINS = 4 d was set by default. Linear trends caused by the presence of planets with periods much longer than the time-baseline is parametrized as |$\dot{\gamma } (t_i-t_0)$|, where |$\dot{\gamma }$| is also a free parameter of the Doppler model and t0 is an arbitrary reference epoch (see Table 2). The log-likelihood periodograms use the same likelihood model but do not include correlations terms. False alarm probability (FAP) assessments using likelihood periodograms (see Baluev 2008) are also computed to double-check the significance of each detection.
5 ANALYSIS OF THE TIME SERIES
The search for signals in the Doppler time series is summarized in Fig. 1. Two very significant periods are detected at 121 and 48.6 d. The Bayesian evidence ratios are 3.2 × 10⁹ for the one-planet model against the no-planet model and 3.1 × 10⁹ for the two-planet solution against the one-planet model. These numbers are well in excess of the 104 threshold indicating very confident detections. The FAPs as derived from the log-likelihood periodograms are 1.5 × 10⁻⁶ and 8.9 × 10⁻⁵, respectively, which are also very small further supporting the detections (acceptable detection thresholds using periodogram methods are typically between 1 and 0.1 per cent). The support of the signals by the three data sets is illustrated in the phase-folded curves in Fig. 2. The uneven sampling can produce biases in the significance estimates. To investigate this, we also performed the same analysis using nightly averaged measurements. The same two signals are detected well above our significance thresholds, thus providing further confidence in the detections. As for other stars, further follow-up over the next few years is desirable to confirm that both low-amplitude signals remain coherent over time.
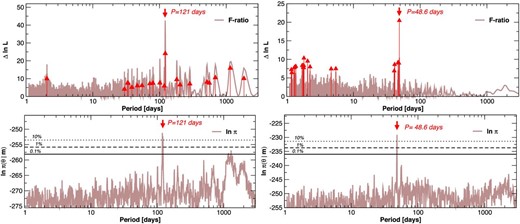
Top panels illustrate the detection periodograms for a model with one-planet (left) and the search for the second signal (right). Brown thick line shows the F-ratio periodogram applied to residual data; it does not adjust for the extra white noise as a free parameter and is only used to initialize the global maximum-likelihood searches. Red triangles represent the top 20 likelihood maxima. Bottom panels show the posterior probability contours as obtained by tempered MCMC samplings using the DRAM algorithm (see the text). Horizontal lines indicate relative probability thresholds compared to the maximum posterior. For perfectly known uncertainties and in the absence of correlations, the F-ratio and the log-likelihood ratio statistic should coincide. However, this is hardly the case when dealing with Doppler data. Top panels also illustrate the perils of working with residual data statistics to assess significance of signals. That is, the F-ratio is overoptimistic in the significance of the first candidate (left-hand panel, 121 d brown peak is much higher), while the significance of the second signal at 48.6 d (right-hand panel) would be greatly underestimated.
![Phase-folded Doppler curves to the reported signals with the other signal removed [HARPS are red circles, High Resolution Echelle Spectrometer (HIRES) are brown diamonds and Planet Finder Spectrograph (PFS) are blue squares]. The maximum-likelihood solution is depicted as a black line.](https://oup.silverchair-cdn.com/oup/backfile/Content_public/Journal/mnrasl/443/1/10.1093_mnrasl_slu076/4/m_mnrasl_443_1_l89_f2.jpeg?Expires=1716410689&Signature=3Hk-OJp94yhbkHIrr00BGEepLwmQiqYCZ~yxOdWbGVND~e8Px-Bhe-v~Lao5fpIzLhhqgycyeKQy4tc-XTVWSIvuoEfWAxBms5FYMHTdeCtmdxbRryN2Oy9GYesUxH1EfnlThsS-IaZyWhIe7TJLWDIj2tn3cUCntZu3-ydtSnzPApCe9OyEh8-S2-AxQU5GK9ySxra0ivPixbZfi0sefIVAo2W~Tco5NoNjmwTTCRWYNmQQ8b-XDdvdvaqkaQUR8J0ma7iN0y8ZtL7gkHE0-jvZDfXe1AUL0z7SMcWdz0EHDhyBOrlP06pxR-q9~zClUsju~HslAqL-V-olGiI4qg__&Key-Pair-Id=APKAIE5G5CRDK6RD3PGA)
Phase-folded Doppler curves to the reported signals with the other signal removed [HARPS are red circles, High Resolution Echelle Spectrometer (HIRES) are brown diamonds and Planet Finder Spectrograph (PFS) are blue squares]. The maximum-likelihood solution is depicted as a black line.
We investigated linear correlations with activity indices by including them in the likelihood model of the HARPS data. While we could still easily detect the planetary signals, these models had lower probabilities due to overparametrization and are not included in the final solution. We also verified whether if any indicator of activity showed variability in similar time-scales as the Doppler data. While the BIS does not show any hint of temporal coherence, the FWHM and S-index do share similar periodogram structures with tentative peaks between 140 and 2000 d. However, neither had FAPs that were lower than 5 per cent, indicating little significance.
The Keplerian solution of the combined RVs presented as median of the posterior estimates and corresponding 68 per cent credibility intervals. The uncertainties of semi-major axes and minimum masses include uncertainties in the stellar mass. Reference epoch t0 for computation of M0 (mean anomaly) and λ0 (mean longitude) is assumed to be JD = 2 452 985.741 11 d.
| Model parameter | Kapteyn b | Kapteyn c |
|---|---|---|
| P (d) | |$48.616^{+0.036}_{-0.032}$| | |$121.54^{+0.25}_{-0.25}$| |
| K (m s−1) | |$2.25^{+0.31}_{-0.31}$| | |$2.27^{+0.28}_{-0.26}$| |
| e | |$0.21^{+0.11}_{-0.10}$| | |$0.23^{+0.10}_{-0.12}$| |
| ω (deg) | |$80.4^{+30.7}_{-28.9}$| | |$3.9^{+28.9}_{-33.2}$| |
| M 0 (deg) | |$269.6^{+38.3}_{-32.2}$| | |$357.6^{+32.3}_{-27.9}$| |
| |$\dot{\gamma }$| (m s−1 yr−1) | |$-0.181^{+0.088}_{-0.086}$| | |
| σHARPS (m s−1) | |$0.65^{+0.10}_{-0.10}$| | |
| σHIRES (m s−1) | |$1.17^{+0.51}_{-0.47}$| | |
| σPFS (m s−1) | |$0.32^{+0.69}_{-0.43}$| | |
| ϕHARPS | |$0.03^{+0.10}_{-0.08}$| | |
| ϕHIRES | |$0.40^{+0.50}_{-0.50}$| | |
| ϕPFS | |$0.10^{+0.30}_{-0.30}$| | |
| Derived quantities | ||
| λ0 = ω + M0 (deg) | |$350^{+19.1}_{-18.7}$| | |$1.6^{+20.5}_{-20.1}$| |
| m psin i (M⊕) | 4.8|$^{+0.9}_{-1.0}$| | 7.0|$^{+1.2}_{-1.0}$| |
| a (au) | 0.168|$^{+0.006}_{-0.008}$| | 0.311|$^{0.038}_{0.014}$| |
| S/S⊕ | 40 % | 12 % |
| HZ-range (au) | ∼0.126–0.236 | |
| P c/Pb | |$2.496^{+0.021}_{-0.029}$| |
We also analysed V-band photometry obtained from the latest release of the ASAS programme (Pojmanski 1997).1 A standard deviation computed using the central 80 per cent percentile was used to remove 4σ outliers resulting in 503 epochs spanning from 2000 December to 2007 September. A log-likelihood periodogram analysis identified two significant signals at 340 and 1100 d, both with amplitudes of ∼ 5 mmag. The signal at 1100 d is compatible with other reports of periodicities in activity indices of M dwarfs (Gomes da Silva et al. 2012), and the 340 d variability might be caused by seasonal systematic errors or by a long rotation period. The periodogram structure of the photometry resembles those of the FWHM and the S-index, further supporting potential low-level activity changes happening at time-scales of several hundred days. Given that the activity and Doppler signals appear uncorrelated, we conclude that the simplest interpretation of the Doppler data is the presence of two planets (see Table 2). With a period of 48.6 d, Kapteyn b lies well within the liquid water habitable zone of the star (Kopparapu et al. 2013). Assuming rocky composition, its properties and possible climates should be similar to those discussed for GJ 667Ce (Anglada-Escudé et al. 2013). Kapteyn c receives ∼10 per cent of Earth's irradiance, implying that the possibility of it being able to support liquid water on its surface is less probable.
We used optimal BLS (Ofir 2014) to search for possible transit events in the ASAS photometry. No transits were found when searching for a signal in the range of parameters compatible with the Doppler solution. Further observations at the predicted transit windows are needed to put meaningful constraints on possible transit signals.
6 DISCUSSION
The age of Kapteyn star can be inferred from its membership to the Galactic halo and peculiar element abundances (Kotoneva et al. 2005). The current hierarchical Milky Way formation scenario suggests that streams of halo stars were originated as tidal debris from satellite dwarf galaxies being engulfed by the early Milky Way (Klement 2010, and references therein). This scenario is supported by the age estimations of the stars in the inner halo (∼10–12 Gyr; Jofré & Weiss 2011) and globular clusters. The work by Eggen and collaborators (see Eggen 1996 as review summary) established the existence of such high-velocity, metal-poor moving groups in the solar neighbourhood. Kapteyn's star is the prototype member of one of these groups, which has been recently investigated by Wylie-de Boer, Freeman & Williams (2010) among others. Stars in Kapteyn's group share a retrograde velocity of rotation around the Galactic Centre of about −290 km s−1(Eggen 1996). Spectroscopic observation of 16 members has shown that the group likely originated from the same progenitor structure as the peculiar globular cluster ω Centauri, but not from within the cluster itself (Kotoneva et al. 2005; Wylie-de Boer et al. 2010). The origin of Kapteyn's star within a merging dwarf galaxy sets its most likely age around the young halo's one (>10 Gyr) and should not be older than 13.7 Gyr, which is the current estimate of the age of the universe (Planck Collaboration 2013).
Numerical integration of several possible orbits over 104 yr to 1 Myr using mercury 6 (Chambers 1999) shows very small changes in the orbital parameters. Despite that the periods for the two planet candidates are compatible with a 5:2 period commensurability (see Table 2), the analysis of the resonant angles for the best-fitting solution did not support the presence of dynamical mean-motion resonances, whose existence also depend on a number of other properties such total planet masses and mutual inclinations. We found, however, that the difference in periastron angles Δω = ωb − ωc librates around 180 deg, which corresponds to a long-term stable configuration called apsidal locking. This is sufficient to show that the proposed system is compatible with long-term physically viable solutions. It has been suggested that two-planet systems that underwent weak dissipation (slow migration) should always end up in apsidal locking (Michtchenko & Rodríguez 2011), which has consequences on the likely planet-formation scenario. A more thorough analysis to properly quantify the significance of the apsidal locking and possible mean-motion resonances requires a much more extended discussion (e.g., Anglada-Escudé et al. 2013) which is beyond the scope of this Letter.
The detection of two super-Earths here is consistent with the idea that low-metallicity stars are more prone to the formation of low-mass planets rather than gas giants (Udry & Santos 2007; Buchhave et al. 2012). This is further supported by a significant paucity of lowest mass planets in Doppler searches of metal-rich stars (Jenkins et al. 2013) and non-confirmation of previous claims of gas giants around extremely metal poor stars (Desidera et al. 2013; Jones & Jenkins 2014). These observational findings are compatible with recent population synthesis experiments such as those in Mordasini et al. (2012).
Once the planets signals are included in the Doppler model, the radial velocity residual variability is reduced to instrumental noise (i.e. extra jitter term is compatible with reported stability of HARPS, and correlation coefficients compatible with 0). This indicates that the star is very Doppler stable, possibly more stable than the instruments themselves. This indeed would be expected because pulsation and convective motions are thought to be much smaller in inactive low-mass stars than in earlier types. At the likely age of the system, most G and K dwarfs are evolving away from the main sequence into giants, which makes the Doppler detection of small planets unfeasible due to increased activity levels(e.g., Nowak et al. 2013). As a result, original architectures of the first planetary systems can only be explored by observing venerable low-mass stars which are still on the main sequence such as Kapteyn's star.
We thank R. P. Nelson, J. Chanamé and R. Baluev (referee) for constructive comments and discussions. We acknowledge funding from DFG/Germany through CRC-963 (CJM); DFG/Germany 1664/9-1 (AR); Alexander Von Humboldt Foundation/Germany (JM); ERC-FP7/EU grant number 27347 (MZ), AYA2011-30147-C03-01 by MINECO/Spain, FEDER funds/EU and 2011 FQM 7363 of Junta de Andalucía/Spain (CR-L and PJA); JAE-Doc programme (CR-L); FPI BES-2011-049647 MINECO/Spain (ZMB); CATA (PB06, CONICYT)/Chile (JSJ); CONICYT-PFCHA/Doctorado Nacional/Chile (MD); NSF/USA grants AST-0307493 and AST-0908870 (SSV); and NASA grant NNX13AF60G S02 (RPB). This work is based on observations made with ESO Telescopes under programme ID 191.C-0505 and ESO's Science Archive Facility (req. number GANGLADA95087). We also acknowledge the effort of the HARPS team programme obtaining data within programme 072.C-0488. Some data were obtained at the W.M. Keck Obs. made possible by the support of the W.M. Keck Foundation and operated among Caltech, Univ. of California and NASA. We are most fortunate to conduct observations from the sacred mountain of Mauna Kea. This study uses data obtained at Magellan, operated by the Carnegie Inst., Harvard Univ., Univ. of Michigan, Univ. of Arizona and the Massachusetts Inst. of Technology.
All Sky Automated Survey (ASAS-3) release, http://www.astrouw.edu.pl/asas/?page=catalogues
REFERENCES
SUPPORTING INFORMATION
Additional Supporting Information may be found in the online version of this article:
Table 1. Spectroscopic measurements (http://mnrasl.oxfordjournals.org/lookup/suppl/doi:10.1093/mnrasl/slu076/-/DC1).
Please note: Oxford University Press is not responsible for the content or functionality of any supporting materials supplied by the authors. Any queries (other than missing material) should be directed to the corresponding author for the paper.
