


Abstract
How chromosomes are folded, spatially organized and regulated in three dimensions inside the cell nucleus are among the longest standing questions in cell biology. Genome-wide chromosome conformation capture (Hi-C) technique allowed identifying and characterizing spatial chromatin compartments in several mammalian species. Here, we present the first genome-wide analysis of chromatin interactions in chicken embryonic fibroblasts (CEF) and adult erythrocytes. We showed that genome of CEF is partitioned into topologically associated domains (TADs), distributed in accordance with gene density, transcriptional activity and CTCF-binding sites. In contrast to mammals, where all examined somatic cell types display relatively similar spatial organization of genome, chicken erythrocytes strongly differ from fibroblasts, showing pronounced A- and B- compartments, absence of typical TADs and formation of long-range chromatin interactions previously observed on mitotic chromosomes. Comparing mammalian and chicken genome architectures, we provide evidence highlighting evolutionary role of chicken TADs and their significance in genome activity and regulation.
INTRODUCTION
During the last decade, whole-genome chromosome conformation capture (3C)-derived approaches had revolutionized our understanding of 3D genome organization, allowing to estimate DNA interaction frequencies averaged in millions of cells at resolution from dozens of kilobases to megabases (1–6). Studies on mammals and flies show spatial partitioning of genome into epigenetically distinct compartments. There are also local contact-enriched areas within compartments, which correspond to topologically associated domains (TADs) (2,7,8). According to the current hypothesis, TADs represent structural units of folded chromatin in the nucleus and set a background for gene regulation (9–12). However, it is still less clear how TADs and compartments are established and whether principles of TAD folding are universal or sequence and species-specific (6,13).
The comparative analysis of TADs (or TAD-like domains) between evolutionary remote species and different cell types is a powerful tool for delineation of evolutionary-conserved features of chromatin organization and the key players of the genome shaping (14,15). Our current views of TADs are generally based on the Hi-C data from human (1,2,16), mouse (2,3,7) and Drosophila (8,17–19) cell types. Drosophila TADs are smaller than their mammalian counterparts and correlate well with certain epigenetic domains demarcated by histone modification marks, while mammalian TADs have more complex epigenetic characteristics (17,18). In both species, there is significant level of conservation of TADs and compartments between different cell types (18,20).
Apart from mammals, TADs are understudied in other vertebrate subgroups including birds, which are the most diverse group of terrestrial warm-blooded animals. Bridging this gap by examining avian genome interaction maps could give us fresh insights to the organizing principles of genomic domains. Chicken together with mouse and fruit fly is an important model organism for developmental and medical research (21,22). The chicken shares a common ancestor with mammals ∼300–350 million years ago (23). Large syntenic regions have been identified in human and chicken genomes (24). However, mammalian and avian genomes differ in several aspects. Birds, and chicken in particular, have the smallest genome among amniotes, mainly because of the loss of repetitive sequences, large segmental deletions and gene shortening (25,26). Unlike mammals, most of birds have remarkably stable karyotype consisting of ∼40 pairs of chromosomes (27). Chicken karyotype comprises 10 pairs of large and gene poor chromosomes and 29 gene-dense microchromosomes (28). Previously, spatial genome organization in chicken interphase nucleus was thoroughly investigated by FISH and light-microscopy techniques, which demonstrated highly ordered radial distribution of macrochromosome territories at the nuclear periphery and microchromosome positioning within the nuclear center (29–32). To date, 3D genome organization in birds has not been comprehensively studied by molecular approaches.
In the present study, we generated genome-wide profiles of chromatin contacts in chicken embryonic fibroblasts (CEF) and adult mature and immature erythrocytes using in situ Hi-C technology (1). Mature erythrocytes are non-replicating, quiescent cells with a greatly depressed RNA synthetic activity (33–36). Several peculiarities of nuclear organization of chicken adult mature erythrocytes (CME) set them aside from other terminally differentiated cell types with generally silent nucleus. The nucleus size in CME is several times smaller than common interphase nucleus and contains extremely compacted chromatin (37,38), which forms tightly packed 30 nm fibers (37,39–43). Chromatin packaging in CME rely on a number of global changes in chromatin structure, including developmentally regulated deposition of linker histone H5 and DNA-bound non-histone serpin-family protein MENT (44–46), which both bring nucleosomes together aiding in the formation of compact nucleosome arrays (47).
We used embryonic fibroblasts, which lack all aforementioned features, as an example of ‘typical’ somatic cells and compared spatial contacts between different cell types. In both fibroblasts and erythrocytes, we identified spatial compartments. We also identified TADs in fibroblast genome and showed that chicken erythrocytes are unique cells, which do not have TADs. In addition to the absence of TADs, Hi-C and electron microscopy data shows that erythrocyte nucleus displays certain features of mitotic chromosomes. Thus, comparison of chicken erythrocytes’ and fibroblasts’ Hi-C data provided a first example of somatic cell types belonging to the same organism, which shows extremely different spatial organization of genomes.
We demonstrated that the fundamental principles of 3D architecture of chicken genome are similar to one previously explored in mammal species, and showed a notable conservation of TADs between these species. We also showed association of chromosomal rearrangements that occurred during avian evolution with boundaries of chicken TADs.
MATERIALS AND METHODS
Preparation of chicken embryonic fibroblasts and adult erythrocytes
Animals were bought from commercial stocks. Embryonic fibroblasts were extracted from 14-day-old embryos as described elsewhere (48). Genotype of cells was determined using polymerase chain reaction (PCR) with primers 1237L 5′-GAGAAACTGTGCAAAACAG-3′, 1272H 5′-TCCAGAATATCTTCTGCTCC-3′ as described in (49), and a culture obtained from female embryo was used for library preparation. Cells fixation was performed at passage 3.
Anemia was induced in adult (2–5 months old) female animals as described before (50). Briefly, we injected animals with 1ml of 5% phenylhydrazine (Sigma Aldrich, P26252) solution daily for 4 days. At day 5 after beginning of injections, blood was collected from phenylhydrazine-treated and control animals. According to Brilliant Cresyl Blue staining, proportion of immature erythrocytes at this point was ∼ 95% (189 out of 200 counted cells) in treated animals and 3.5% (9 out of 256 counted cells) in control animals.
Blood was centrifuged at 500 g, 4°C for 10 min. Supernatant containing a layer of white cells was discarded, and red pellet was resuspended in 20 ml of cold phosphate buffered saline (PBS). The procedure of centrifugation and PBS-wash was repeated two more times. Finally, cells were counted, and desired amount of erythrocytes was pelleted and resuspended in fixation solution.
Preparation and sequencing of Hi-C libraries
For each sample (red blood cells and fibroblasts) two independent fixations (biological replicas) were performed. In all experiments, fixation conditions were exactly as described in (1). All Hi-C libraries were prepared using in situ protocol (1). DNA libraries were sequenced from both ends on Illumina HiSeq 2500 platform in 3 runs total. The sequencing was conducted in 2 × 101 and 2 × 10⁶ mode with TruSeq Rapid SBS chemistry, and in 2 × 126 mode using HiSeq® SBS Kit v4 (Supplementary Table S1).
Probes for FISH
Triplet of BAC-probes covering ∼200 kb regions from two neighboring large TADs were selected from CHORI-261 chicken BAC-library, so that the genomic distance between each BAC-probe from the triplet was almost equal. Details of BAC-clones used for probe generation are summarized in the Supplementary Table S3. BAC DNA was collected from Escherichia coli night cultures according to standard alkaline-lysis method. Labeled probes were amplified from BAC DNA by DOP-PCR using biotin-11-dUTP (Sileks) or digoxigenin-16-dUTP (Roche). For FISH 100 ng of each labeled probe were precipitated with 1.75 μg of salmon sperm DNA and 4 μg of chicken Cot5 DNA and dissolved in the premix, containing 50% formamide (Amresco), 10% dextran sulfate (Sigma-Aldrich), 2×SSC. Chicken Cot5 DNA was prepared from ultrasonically sheared chicken genomic DNA, which was denatured, then renatured in controlled conditions and digested with S1 nuclease (ThermoFisherScientific) according to the published protocol (51).
FISH
Chromosomal location of individual BAC-probes was confirmed by FISH on chicken metaphase chromosomes following standard procedures (52) (data not shown). FISH in interphase nuclei was performed as described in (30). Briefly, slides were denatured in 2×SSC-buffered 70% formamide during 20 min at 70°C, dehydrated in ice-cold ethanol series and air-dried. Probe mixes were denatured at 96°C for 10 min and pre-annealed at 37°C for 1 h. Immediately after pre-annealing probes were applied to denatured slides, sealed by rubber cement and hybridized at 37°C for 1–2 days. Slides were washed in 2×SSC (5 min) and 0.2×SSC 60°C (15 min), probe detection was carried out as described before (32). Biotin-labeled probes were detected by avidin-Alexa488 (ThermoFisherScientific) with signal-amplification by biotinylated anti-avidin antibodies (Jackson ImmunoResearch). Digoxigenin-labeled probes were detected with Cy3-conjugated mouse anti-digoxigenin antibodies (Jackson ImmunoResearch) with signal amplification by Cy3-conjugated anti-mouse secondary antibodies (Jackson ImmunoResearch). Finally, slides were dehydrated in ethanol series, air dried and mounted (65% glycerol, 2% 1,4-diazabicyclo[2.2.2]octane [DABCO], 1 μg/ml 4′,6-diamidino-2-phenylindole [DAPI]) for microscopy.
Microscopy and image analysis
Slides were examined under Leica TCS SP5 confocal microscope (Leica-Microsystems) using glycerol immersion HC PL APO 63 × objectives and LAS AF software (Leica-Microsystems). Different fluorochromes were detected in separate sequential channels to exclude fluorochrome crosstalk. Voxel size for each scanned nucleus was 0.0457 × 0.0457 × 0.1259 μm. After confocal image stack acquisition, image channels for each cell were converted to separate .TIFF files with FiJi. Pairwise 3D-distances between FISH probes were calculated using NEMO software (53), which allows automatic segmentation of spotted FISH-signals and estimation of their mass and geometrical centers. Smoothing, 3D median filter, TopHat filter and 3D masks were optionally enabled to improve object segmentation. Statistics of FISH distance distribution was performed using Origin 8.
Transmission electron microscopy (TEM)
Preparation of erythrocytes and fibroblasts for TEM was made using the protocol described in detail by (54). Briefly, cell were pelleted by mild centrifugation (200g) and fixed in 2.5% glutaraldehyde in 0.1 M sodium cacodylate buffer for 1 h at room temperature, post-fixed for 1 h in 1% aqueous solution of osmium tetroxide containing a few crystals of potassium ferricyanide (K3[Fe(CN)6]) and then incubated overnight at 4°C in 1% aqueous solution of uranyl acetate. Then, specimens were dehydrated in ethanol series and in acetone, and embedded in Agar 100 Resin (AgarScientific, Essex, UK). Complete polymerization of samples was effected by keeping them in oven at 60°C for 3 days. Ultra-thin (70 nm) sections were obtained with a Leica ultracut ultra-microtome (Leica ultracut UCT, Vienna, Austria). Sections were examined with a JEOL JEM-100SX transmission electron microscope at 60 kV in the Inter-institutional Shared Center for Microscopic Analysis of Biological Objects (Institute of Cytology and Genetics, Novosibirsk, Russia). The obtained images were slightly modified in Photoshop CS5 using levels, brightness and contrast tools. All measurements were made using ImageJ software (55).
Protein cellular lysates preparation
Freshly obtained CEF, HEK293 cells and erythrocytes, ∼3 × 10⁶ cells, were washed twice in ice-cold TBS (15 mM Tris–HCl, pH 7.5, 150 mM NaCl, 0,5 mM phenylmethylsulfonyl fluoride (PMSF)), centrifuged at 4°, 2000 g for 5 min and the pellets were resuspended in the lysis buffer (150 mM NaCl, 1% Nonidet P-40 (Sigma 74385), 0,5% sodium dodecyl sulphate, 50 mM Tris, pH 8.0, 5 mM ethylenediaminetetraacetic acid, 1 mM PMSF and cOmplete mini protease inhibitor cocktail (Roche)). Cells were incubated on ice for 30 min and homogenized in the Minilys homogenizer (Bertin Instruments) followed by centrifugation at 4°, 20 000 g for 30 min. The concentrations of total proteins in the extracts were measured by Qubit fluorometer protein kit and turned out to be ∼3.5 mg/ml.
Western blotting
CEF, erythrocytes and HEK293 protein extracts, (52 mcg, corresponding to 110 000 cells) along with the protein marker SM0661, Fermentas, were separated by 10% sodium dodecyl sulphate-polyacrylamide gel electrophoresis and transferred to 0.45 mkm Polyvinylidene difluoride membrane for Western blotting (Biotrans, US) using a mini transfer cell (Bio-Rad, Hercules CA). After transfer the membrane was blocked by an 1 h incubation in 5% fat-free dry milk dissolved in PBST (1× PBS, 0.1% Tween-20), washed three times in PBST and incubated with primary antibody anti-CTCF (Cell Signaling Technology, 3418S) or with primary antibody anti-Rad21 (Abcam, ab16-473-100) (3 h, RT). After three washes in PBST the membrane was incubated with affinity purified alkaline phosphatase-conjugated goat anti-rabbit IgG (A3812, Sigma) or with affinity purified alkaline phosphatase-conjugated goat anti-mouse IgG (A3562, Sigma). Three washes in PBST of the membrane was followed by 5 min incubation in the buffer for alkaline phosphatase (100 mM Tris–HCl, pH 9.5, 100 mM NaCl, 10 mM MgCl2) and the bound antibodies were visualized using nitro-blue tetrazolium/5-bromo-4-chloro-3′-indolyphosphate (BCIP/NBT) substrate for alkaline phosphatase (Sigma).
The protein marker was visualized by amido black staining according to a standard protocol.
Computational analysis
All data analysis was performed using computational nodes of Novosibirsk State University high-throughput computer cluster.
Generation of heatmaps
GalGal5 genome (Gallus_gallus-5.0, GCF_000002315.4) was obtained from NCBI. All unplaced contigs >50 kb or containing less than two HindIII sites were filtered out, which resulted in a list of 524 contigs of total lengths 1022 MB. Reads were aligned and filtered using mirnlib software (hereinafter versions mirnylab-hiclib-8f1f24b289b9 and mirnylab-mirnylib-87e00ea3e16c were used). In CEF there were more reads filtered out, mainly because of ‘dangling ends’ filter. This most probably stems from lower efficiency of enzymatic reactions during preparation of CEF Hi-C library.
We used contig-level datasets for calculation of dependence of contact probabilities from genomic distance. For chromosome-level heatmaps, used for domains identification, we discarded reads aligned to unplaced and unlocalized contigs. Coordinates of the remaining alignments were converted to coordinate system of assembled chromosomes according to AGP files provided by the genome assembly. Both contig- and chromosome-level datasets were filtered and iteratively corrected as described in (3). Heatmaps were generated at different resolutions using mirnlib software. Due to a very high similarity (Pearson R = 0.995–0.997 for heatmaps at 1 MB resolution; Supplementary Figure S1), corresponding replicas were merged into a single dataset that was used for further analysis.
Eigenvector decomposition and TADs calling
There are two algorithms to perform Eigenvector decomposition of Hi-C matrices (56,57). Algorithm described in (56) uses only interchromosomal contacts to calculate Eigenvectors and Eigenvalues. The advantage of this approach is that it is not biased by local contact perturbations, i.e. caused by the presence of TADs. However, it requires high amount of interchromosomal data, which is not available at high resolution. For CEF we were able to compute Eigenvectors from interchromosomal data at resolutions above 50–100 kb. For chicken adult immature erythrocytes (CIE) and CME data, which have more interchromosomal contacts (see results), we were able to compute Eigenvectors at 40 kb resolution.
Another algorithm, implemented in (57) calculates Pearson correlation of cis contacts to provide Eigenvectors. This approach can be robust at higher resolutions; however, the algorithm processes each chromosome independently, which does not allow direct comparison of compartments between chromosomes.
In this study, we used both algorithms. To compare compartments distribution between cell types and between chromosomes, we used 100 kb binned heatmaps and employed algorithm (56) (implemented as doEig function of mirnylab module). Compartmentalization strength was calculated as in (58). To compare compartments with domain borders, we obtained Eigenvector values at 40 kb resolution using algorithm (57) (implemented as eigenvector function of juicer tools v. 1.7.5), and then normalized values obtained for each chromosome to be in diapason +1..−1.
To call domains we used heatmaps binned at 40 kb resolution. Dixon TADs were obtained using algorithm described in (2) with default parameters. Armatus TADs were obtained using algorithm described in (59). Size of domains obtained using this algorithm depends on parameter γ (59). Indeed, we observed several sets of domains corresponding to different γ values). We summarize results obtained with different γ values in a set of ‘consensus domains’, as described in (59). TADtree TADs were obtained using an algorithm described in (60) with parameters S = 50, M = 25.
For comparisons of domain sets we either directly compared genomic coordinates of domain borders at accuracy level of 40 kb, which corresponds to 1 bin, or used variation of information coefficient (61). Low values of variation of information coefficient indicate high similarity of domains; when comparing two identical sets, the coefficient is equal to zero.
To characterize insulation of TAD boundary we compared contacts frequency between two loci separated by TAD border with genome-wide average.
Gene localization and expression analysis
Gene coordinates were obtained from the genomic annotation files included in GalGal5 genome assembly. To analyze expression levels, RNA-seq data (Embryonic fibroblasts: (62), ENA SAMEA3106400; immature erythrocytes: (50), SRR2983616 and SRR2983617) were obtained from NCBI or ENA and processed using Tophat and CuffDiff as described in (63). Obtained FPKM values were used to classify all genes as highly expressed (top 25% of genes according to levels of their expression) or low expressed (bottom 25%).
Analysis of CTCF and epigenetic modifications distribution
Identification of CTCF-binding sites in mature erythrocyte is technically challenging. However, recent study identified a set of CTCF-binding sites that were shared between different chicken tissues and supposed to be ‘cell-type-unspecific’ (64). Coordinates of cell-type-unspecific CTCF peaks were obtained from (64), converted to GalGal5 genomic coordinates using NCBI ReMap (https://www.ncbi.nlm.nih.gov/genome/tools/remap) and used in this study. For CIE and CME we also used erythrocyte-specific CTCF sites from (65) and obtained similar results (data not shown). Orientation of CTCF sites was determined using MEME-chip online tool (66). Coordinates of F1 chromatin regions and H3K4me3 or H3K27ac peaks identified in immature erythrocytes were obtained from (50) (NCBI PRJNA305808) and converted to GalGal5 genomic coordinates using NCBI ReMap.
Comparison of avian and mammalian domains
Coordinates of TADs identified in mouse embryonic fibroblast and human IMR90 fibroblasts were obtained from (3) and (2), respectively. For TADs comparison, both chicken and mammalian TAD border coordinates were converted to the same genome version (mm10 for mouse and hg38 for human) using USCS leftover tool with default parameters. Note that only domains located in syntenic regions were successfully converted, thus only these domains were analyzed. Coordinates of TAD borders were considered similar if distance between them was <40 kb.
To compare composition of genes surrounding TAD borders, we first generated a list of chicken/mouse, chicken/human and mouse/human 1-to-1 orthologous genes using Ensemble API. Next, we aimed to define orthologous TAD borders, i.e. pairs of TAD borders that share maximal number of orthologous genes. Even taking that TAD boundaries are enriched for genes both in chicken and mouse, in many cases they contain less than 2–3 orthologs, a minimal number needed to analyze similarity of gene composition between species. Thus, we extended border regions so that in most cases at least three genes were located inside (median number of genes within extended region is equal to 3). We should note that obtained regions never exceeded 30% of domain length. After extended TAD boundaries were defined for each species, they were compared in a pairwise manner to find pairs with the highest number of similar orthologs. Finally, we calculated a percentage of orthologous genes in defined pairs of border regions.
Analysis of evolutionary breakpoint regions, conserved non-coding elements and transposable elements
A list of evolutionary breakpoint regions was obtained from (67). We used regions defined at 100 kb resolution only; also all duplicated regions (reused breakpoints) were removed. Remaining regions were converted to GalGal5 genome coordinates using NCBI Remap tool, which resulted in 2036 regions. A rare long evolutionary breakpoint regions spanning more than one bin (more than 40 kb) were split into consecutive regions, with the length of each equal to 40 kb.
Conservative non-coding elements were obtained from Ancora database (http://ancora.genereg.net/) (68). We considered elements with identity threshold 70% (with parameter C set to 50). Coordinates of transposable elements were obtained from http://transpogene.tau.ac.il/. All obtained data were converted to GalGal5 genomic coordinates.
Statistical analysis of domain properties
For all studies of domain properties, we compared results with controls represented by at least 100 sets of randomly permuted domains. Unless otherwise noted, all figures show average +/− 3 standard deviations of the control data.
Analysis of interchromosomal contacts
Standard pipeline described in ‘Generation of heatmaps’ assumes filtering of all repetitive sequences, i.e. removal of those reads that cannot be unambiguously aligned to the genome. While this strategy ensures correct counting of spatial contacts, it leads to a loss of information that in some cases may be useful. For instance, some repetitive sequences may be chromosome-specific, occurring multiple times but all belonging to a single chromosome. Examples of such repeats are chrZ-specific repetitive cluster recently assembled in the chicken genome, or ribosomal gene repeats on chr16 (see (32) for complete list of tandem repeats in the chicken genome). Reads originating from these regions may be unmapped on a sub-chromosomal resolution; however, these contacts can be accounted when interchromosomal interactions are of interest.
To estimate interchromosomal contacts carefully, we developed a following pipeline. All reads were mapped to GalGal5 genome using bwa with option bwa samse -n 15, which saves up to 15 different alignments for those reads that cannot be unambiguously mapped. A number 15 was selected because higher values of this parameter significantly increased alignment time. We kept reads that had multiple alignments, but all belonging to a single chromosome. This gave only a small increase in the total amount of obtained reads (∼1.5% of all kept reads were aligned unambiguously), but was important for estimation of repeat-enriched regions, such as, for instance, chromosome 16.
where N is a total number of chromosomes. Knowing each Ti from experiment, we solved equation system obtained from (2), calculated bi values and, therefore, were able to compute expected values (nij) for each interchromosomal contact.
Ethics approval and consent to participate
All animal experiments were approved by St Petersburg State University Ethics Committee for Animal Research (approval number 131–03-2) and conducted following the Guide for Care and Use of the Laboratory Animals (69).
RESULTS
A comprehensive map of chromosomal contacts in chicken cell nuclei
To study chromatin structure in avian somatic cells, we determined genome-wide chromatin interaction frequencies by performing the Hi-C experiment in CEF, CME and CIE obtained from anemic animals (Figure 1). Sequencing of Hi-C libraries resulted in 816 million reads, which after filtering provided information ∼448 million spatial contacts (Supplementary Table S1). Generated contact maps were visually similar at low resolution (Figure 1), which is consistent with a high correlation between heatmaps (Pearson R = 0.95; Supplementary Figure S1). Among three cell types, CIE and CME were more similar to each other than to fibroblasts (Figure 1 and Supplementary Figure S1).
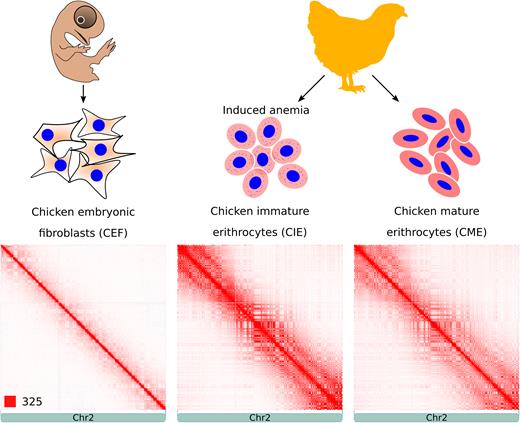
Hi-C contact heatmaps of CEF, CIE and CME. Figure shows experiment design (top) and representative heatmaps displaying spatial contacts of CEF, CIE and CME (bottom). The color of each dot on heatmaps represents the log of the interaction probability for the corresponding pair of genomic loci according to standard JuiceBox color scheme (57).
Identification and characterization of compartments in chicken erythrocytes and fibroblasts
The contact heatmaps of chicken genome displayed a typical plaid-pattern, demonstrated previously in mammalian Hi-C data (Figure 1) (3). The plaid-pattern suggests the presence of large spatial compartments, such as A/B-compartments. Indeed, Eigenvector decomposition of a contact matrix demonstrated that chicken genome could be divided into two categories, characterized by positive and negative values of the first Eigenvector, which correspond to A- and B-compartments, respectively (Supplementary Figure S2A). We did not observe a sharp transition between two compartments, i.e. some loci displayed intermediate values of the first Eigenvector (Supplementary Figure S2A). We noticed that A and B compartments are not randomly distributed: in all cell types large macrochromosomes were enriched for regions belonging to B-compartment, whereas A-compartment was more often attributed to the regions located on small microchromosomes (Supplementary Figure S2B). In addition, A-compartment was associated with higher levels of gene expression (Supplementary Figure S2C).
We found that strength of compartmentalization was different between cell types (Supplementary Figure S3A). Mature erythrocytes show very strong interactions between far-away loci belonging to the same compartment, sometimes spanning entire arm of the chromosome (Figure 1 and Supplementary Figure S4). Slightly less intense interactions within compartment were observed in CIE. In CEF compartmentalization strength was much lower. The pattern of compartmentalization was moderately similar between CEF and CME (Spearman R > 0.74) and highly similar between CIE and CME (Supplementary Figure S3B; Spearman R > 0.94). Visually inspecting CEI and CME heatmaps, we found only few regions that display different patterns of compartmentalization (see, for example, an LPP gene locus represented on Supplementary Figure S5).
In addition to Hi-C data, we demonstrated differences of chromatin compartmentalization of CEF and CME genomes using transmission electron microscopy (Figure 2). In CME, heterochromatin formed a compact electron-dense cluster located on the periphery of the nucleus, whereas in CEF multiple small electron-dense clusters were distributed through entire nuclear space. This observation highlights differences of chromatin organization in fibroblasts and erythrocytes.
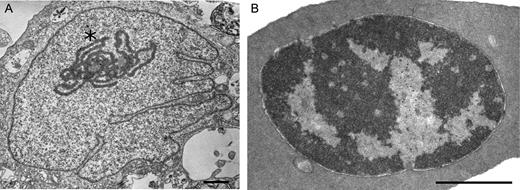
Transmission electron microscopy analysis reveals different organization of chromatin in chicken fibroblasts and erythrocytes. Representative examples of CEF and CME cells are shown on (A) and (B), respectively. Note the pronounced nucleolus in CEF cell (marked by asterisk). Scale bar: 1uM
Topologically associated domains in chicken fibroblast genome
In addition to the presence of A/B-compartments, we observed local interaction-enriched regions represented as squares along the heatmap diagonal in CEF data (Figure 3A). These regions resemble mammalian topological domains and physical domains in Drosophila. Such domains were identified on both macro- and microchromosomes. In many cases, these regions demonstrated hierarchal structure, i.e. it was possible to subdivide large contact-enriched areas into several smaller self-interacting regions (Figure 3A).
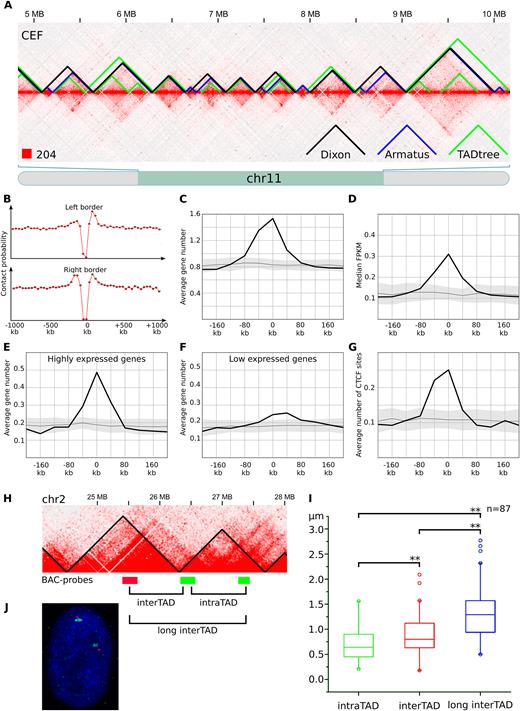
TADs identified in chicken fibroblasts. (A) The fragment of the CEF heatmap displays the representative examples of TADs identified by Dixon, Armatus and TADtree algorithms. (B) The drop of contact probability between the genomic loci separated by the Dixon TAD border. The X-axis shows a distance from the border of a domain. The Y-axis represents average value of contact frequencies of pairs of loci located 40 kb upstream and 40 kb downstream of the point defined by X-axis values. An obvious drop of contact frequencies at the point 0 means reduced number of contacts between pair of loci located 40 kb away from a domain border: one locus is within the domain and another is outside of the domain. (C–G) Distribution of genomic features in relation to the Dixon TAD borders. X-axis represents a distance from the border of a domain as on A, the Y-axis shows the average number of features (or median value of feature on C) in a 40 kb interval centered according to the X-axis value. Black line and gray area represent average value and three standard deviations obtained by at least 100 permutations of Dixon TADs. Features depicted on C-G include genes (C); gene expression, represented as FPKM values (D); highly expressed (top 25% based on FPKM values) genes (E); low expressed (bottom 25%) genes (F); CTCF sites (G). (H) Scheme of the ∼3 MB region from chicken chromosome 2, containing two consecutive Dixon TADs. BAC-probes, labeled by different colors are located in neighboring TADs. Note that BAC-clones are equidistant (∼700 kb) from each other in the linear genome. (I) Distribution of distances between BAC-probes after FISH, shown as boxplots with outliers. Distances between probes were compared pairwise using paired sample Wilcoxon signed rank test. Significant differences are labeled ** when P ≤ 0.01. (J) Representative image after two-color FISH with TAD-specific BAC-probes in CEF nucleus.
We employed several computational approaches to systematically identify self-interacting regions in CEF genome (Figure 3; Table 1). The original algorithm proposed by Dixon et al. (2) reported ∼1250 large domains with a median size 640 kb (average size ∼770 kb). The Armatus algorithm (59) revealed ∼3100 smaller domains with a median size 240 kb (average size ∼310 kb). Finally, the TADtree algorithm, which finds hierarchical sets of domains representing TADs and subTADs, produced nested sets of regions with average and median length varying between 160 and 260 kb (Table 1).
Sizes of TADs identified in chicken fibroblasts
| Algorithm | Number | Total length, Mbp | Genome coverage, % | Mean length, Kbp | Median length, Kbp |
|---|---|---|---|---|---|
| Aramtus | 3102 | 954.48 | 93.44 | 307.698 | 240 |
| Dixon | 1252 | 962.84 | 94.26 | 769.042 | 640 |
| TADtree (Level 0) | 2857 | 757.16 | 74.12 | 265.019 | 160 |
| TADtree (nested, Level 1) | 870 | 208.72 | 20.43 | 239.908 | 200 |
| TADtree (nested, Level 2) | 39 | 7.28 | 0.71 | 186.667 | 160 |
Although TADs identified by different algorithms do not overlap completely, their distributions were moderately similar (value of variation of information coefficient for TADs identified by different algorithms was 16–28% lower than in randomized controls; see Supplementary Figure S8). It often happens that a large domain identified by one algorithm was represented by several smaller domains in a set obtained by another algorithm (Figure 3A). For example, 392 of TADs identified by Armatus algorithm were identical to Dixon TADs. Additionally, cases when several consecutive Armatus TADs were merged into single large Dixon domain account for 1899 Armatus TADs. Moreover, all obtained sets of domains show similar distribution of genetic and epigenetic marks near their borders (see below). By analogy with mammalian domains, we designated identified regions as chicken TADs.
As in mammals, borders of chicken TADs insulate loci within a domain from contacts with loci outside of this domain (Figure 3B and Supplementary Figure S6). At the same time, intra-domain regions interact with each other more often than regions separated by the same genomic distance, but located outside of the domain or in two different domains (Figure 3A and В; Supplementary Figure S6). We used FISH with TAD-specific BAC-probes to randomly-chosen pairs of relatively large TADs to verify the results of TAD-calling algorithms (Figure 3H–J). In CEFs, probes belonging to the same TAD were significantly closer in the nuclear space, than equidistantly located probes separated by the TAD border. Thus, a chicken TAD represents compact local self-interacting region isolated from the other parts of chicken genome.
An insulation property of domain borders and increased frequency of intra-domain contacts suggest a biological function of TADs. To understand a role of domains in chicken genome organization, we analyzed interposition of domains and available genomic features. We found that TAD borders in CEF are enriched for genes (Figure 3C and Supplementary Figure S6). For more than 60% of CEF domains at least one gene was located within +/− 5 kb region surrounding border. The average number of genes located near the domain border was 1.5–2 times higher for microchromosomes than for macrochromosomes, which is in agreement with the higher gene density of the formers.
As was shown before, positions of chromatin domains may reflect distribution of certain histone modifications and correlate with gene expression (2,18). Thus, we separately analyzed localization of genes with high and low expression levels in CEF (Figure 3D–F and Supplementary Figure S6). We found that both categories of genes were enriched in domain borders, but for actively expressed genes, the enrichment was much more prominent. Clustering of actively expressed genes near domain borders in CEF is even more evident from expression intensity plots, presented on Figure 3D.
Whereas, in Drosophila gene expression and histone modifications are main factors defining domains borders (18), in mammals architectural proteins, especially CTCF, play major role in configuring the genome topology (2,13,70). We analyzed the available ChIP-Seq data and found that in CEF TAD borders are strongly enriched for CTCF-binding sites, whereas slight CTCF-depletion was observed inside domains (Figure 3G and Supplementary Figure S6). Moreover, contact frequencies between loci separated by a CTCF site were lower than between other regions, showing that CTCF insulate local contact domains in chicken genome (Supplementary Figure S7A). Importantly, CTCF sites at TAD anchors occur preferentially in a convergent orientation (Supplementary Figure S7B), which is consistent with the data previously obtained on mouse and human cells (1,70).
Unique organization of chromatin in chicken erythrocytes
After identification and characterization of TADs in CEF genome, we used the same three computational approaches to call TADs in mature and immature erythrocytes (Supplementary Table S2). We observed insulation of spatial contacts near the borders of reported domains (Figure 4A and B); however, all other properties were different between fibroblasts and erythrocytes TADs.
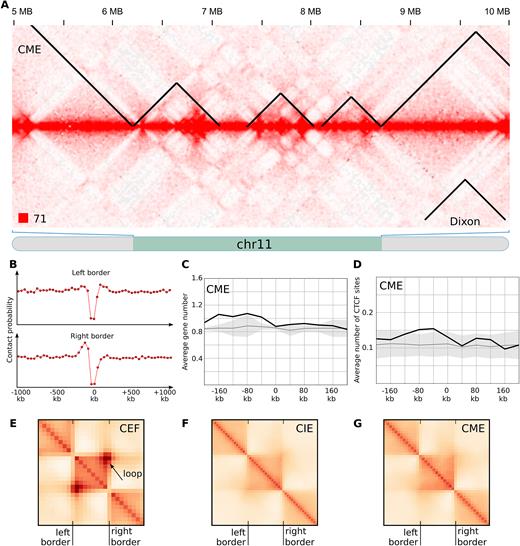
Chicken erythrocytes lack typical TADs. (A) The fragment of the CME heatmap displays the representative examples of TADs identified by Dixon algorithms. Note obvious difference with data presented on Figure 3A for fibroblasts, as well as pronounced plaid-pattern of contacts map. (B). The drop of contact probability between the CME genomic loci separated by the Dixon TAD border. Data presented as on Figure 3B. (C and D) Distribution of genomic features in relation to the CME Dixon TAD borders. Data presented as on Figure 3C and D. (E–G) Average Dixon TAD identified in CEF, CIE and CME. Arrow shows pronounced contact between TAD borders observed in CEF, which can be interpreted as formation of chromatin loop. In CME or CIE we did not observe formation of loops.
First, TADs were similarly distributed in CIE and CME but for both locations of domains differ from CEF TADs (Supplementary Figure S8). Second, in both CME and CIE genes were not enriched near the TAD borders (Figure 4C and Supplementary Figure S9). Third, there was no association between CTCF-binding sites and TADs in erythrocytes (Figure 4D and Supplementary Figure S9B). Fourth, many of CEF TADs display a loop anchored at TAD borders (Figure 3A and Figure 4E). These loops were especially pronounced for Dixon TADs; we did not find these loops neither in CIE nor in CME data (Figure 4A, F and G; Supplementary Figure S9C and D). Thus, although TADs identified in erythrocytes represent insulated self-interacting regions, their properties are very different from those observed in CEF.
When visually inspecting TADs in erythrocytes, we found that in the vast majority of cases borders of self-interacting regions correspond to transitions between A- and B-compartment (Figure 4A). Indeed, Figure 5 shows that almost all TAD borders with high insulation scores separate A- and B-compartments in CME and CIE. In CEF TAD borders were also enriched for regions separating A- and B-compartments; however many of CEF TAD borders with strong insulation index were located within compartment, which almost never happened in erythrocytes (Figure 5 and Supplementary Figure S10).
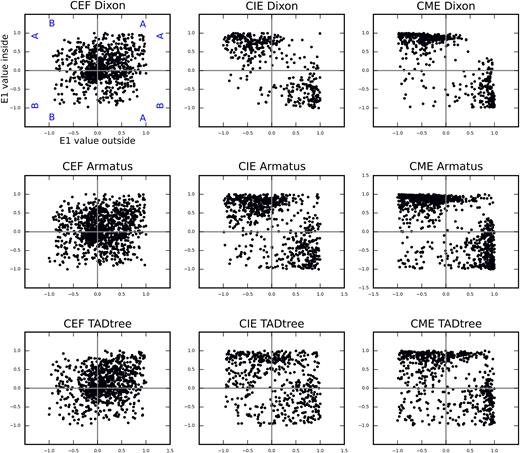
TAD borders identified in CME represent transition between compartments. Each dot represents single TAD border, and located on the scatterplot according to the E1-values of two loci separated by this border: the E1-value for loci outside TAD (X-axis) and inside TAD (Y-axis). We consider TAD border only if the border displays stronger insulation than average loci in genome, i.e. contacts frequency between two loci separated by this border was less than genome-wide average – 1*SD.
Based on our visual observation of erythrocytes data, absence of correlation between erythrocyte TADs and CTCF binding, absence of loops connecting TAD borders, and almost complete coincidence of compartments transition regions and TAD borders, we concluded, that regions identified by TAD-calling algorithms in erythrocytes data are not truly TADs. Instead, these regions are local compartments identified at high resolution, which are well pronounced due to high compartmentalization of erythrocytes genome (Supplementary Figure S3A). Thus, chicken erythrocytes represent unique cell type where interphase chromosomes are not organized in TADs.
According to the loop extrusion model (71), formation of TADs requires presence of CTCF and cohesin in the cell nucleus. Western blot analysis of CTCF and cohesin subunit Rad21 indicates that both are present in chicken erythrocytes with the levels comparable to those of CEF (Supplementary Figure S14). However, staining with CTCF antibodies depicted unusual compartmentalization of CTCF protein (Supplementary Figure S15) in erythrocytes, reproducing results reported previously by (72). Thus, although both CTCF and Rad21 are present in erythrocyte nucleus, it is not clear whether loop extrusion is functional in these cells.
We next analyzed how contacts probability (P) depends on genomic distance between loci (s) in erythrocytes and fibroblasts. This dependence was employed in several studies to suggest a physical model of DNA packaging (73). For both fibroblasts and erythrocytes, we observed a rapid exponential decrease of contact frequencies with increase of distance between interacting loci (Figure 6). The exponential dependence of contact frequencies from genomic distance was similar for micro- and macrochromosomes of one cell type (Supplementary Figure S11), but differed between cell types. In CME and CIE we observed an increase of long-range interaction frequencies compared to CEF, which resulted in almost two times more interactions of loci separated by more than 2 MB (Figure 6 and Supplementary Figure S4).
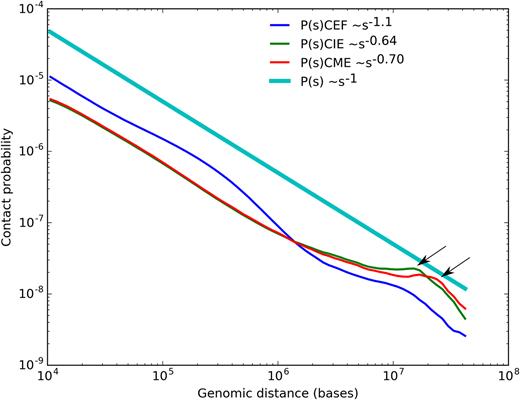
The dependence of the contact probability on the genomic distance P(s) averaged over all chromosomes, compared with P ∼1/s. Arrows indicate increase of contact probabilities for loci separated by 10–15 MB (for CIE), or 15–17 MB (for CME).
We also observed an unexpected increase of contact probability for loci separated by 10–15 MB in CIE and for loci separated by 15–17 MB in CME (Figure 6, indicated by arrow). On the heatmaps this increase of long-range interactions was reflected by a distinct second diagonal band, running in parallel with the primary diagonal for all loci (Figure 1). Interestingly, the very similar second diagonal band was observed recently in Hi-C data on mitotic chromosomes (74).
The second diagonal reflects formation of consecutive loops emanating from a central axial scaffold of mitotic chromosome (74). We aimed to identify potential cytological structures representing scaffolds-like elements in the interphase nucleus of the erythrocyte. Interestingly, ultrastructural analysis of serial sections of the cells allowed us to identify several dozen cavities with the diameter ranging from 40 to 160 nm in CME nucleus (Figure 7). Larger cavities with mean diameter of 100 nm may be detected through several (typically 1–3) 70 nm sections being up to 200 nm in length and contain an electron-dense core (mean diameter of 55 nm), presumably formed by proteins. Considering the number of cavities and their size, it is not excluded that these structures represent axial chromosomal cores from which large, megabase-scaled loops emanate to form a chromatin architecture similar to recently described for mitotic chromosomes (74).
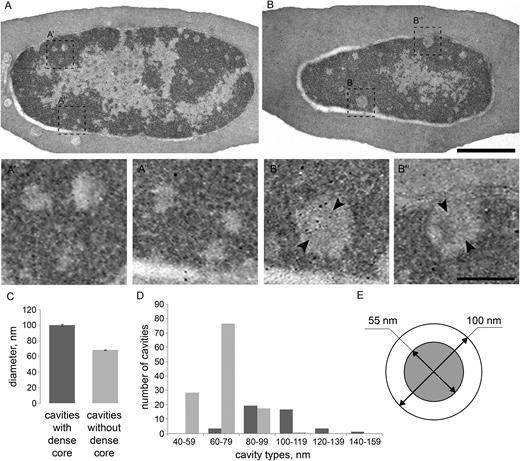
Transmission electron microscopy analysis of chromatin organization in erythrocytes. (A and B) Different sections of the same erythrocyte, showing large regions of heterochromatin with peripheral localization. Note the small round-shape cavities in the heterochromatin without (A’’, B’) or with (A’, B’’) a dense core. (C) Mean diameter of the cavities with or without the dense core quantified on 18 serial sections of four cells. (D) The abundance of cavities of different diameter with or without the dense core. (E) Scheme of cavity with the dense core showing mean diameter of the cavity and the core (55 nm). Scale bar: 1uM (A, B), 100nm (A',A'',B',B'')
Evolutionary role of topologically associated domains
It is known that a portion of CTCF sites is highly conserved between species, including ∼230 conserved sites in mammals and chicken (64). Keeping in mind the role of CTCF in spatial organization of CEF genome, one can propose a potential evolutionary conservation of domains identified in chicken and mammalian fibroblasts. Mammalian red blood cells are enucleated, thus comparison of 3D architecture of mammalian and chicken erythrocytes is not possible. Meanwhile, TADs were identified in mouse and human fibroblasts (2,3), allowing comparison of these data with CEF domains. Since mouse and human domains were called using Dixon algorithm, for evolutionary comparisons we used only Dixon set of CEF TADs.
We found that 26.77% of TAD borders were conserved between chicken and human fibroblasts, compared to 7.351% at random (P-value <10e-23, Fisher's exact test; Figure 8A and B). In many cases, similar clusters of orthologous genes were found near human and chicken TAD borders; accordingly, for more than 45% of chicken TAD borders we found a border in human genome surrounded by similar (80–100% similarity) set of orthologous genes (Figure 8C and D). In general, similarity of orthologs near domain borders in chicken and human was 1.5–2 times higher than expected. Cognate results were obtained comparing chicken and mouse data (Figure 8B and D). Moreover, 35% of all chicken-to-mouse orthologs were located near TAD borders in both species (compared to expected 14+/−1%).
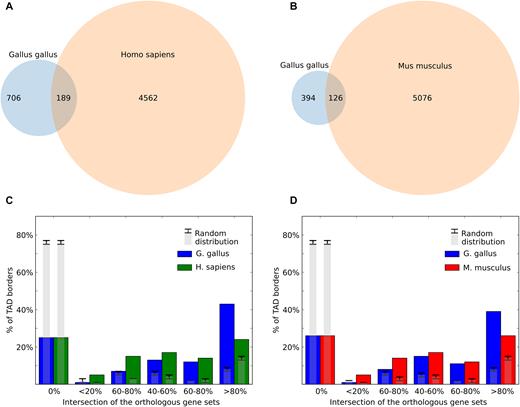
Evolutionary conservation of TAD borders. (A and B) The overlap of chicken and human (A) or chicken and mouse (B) Dixon TAD boundaries in syntenic regions. (C and D) The similarity of orthologs near Dixon TAD borders. All TAD borders were classified into six categories depending on the gene synteny level near the border. For example, if six genes are located near a given chicken TAD border, and five orthologs of these genes are jointly located near any TAD border in human genome, the intersection between sets will be 0.83 (83%) and the chicken TAD border will be classified as highly conserved (category >80% similarity). Gray bars indicate values obtained at random, with error bars showing three standard deviations.
Observed conservation of chicken and mammalian TADs prompted us to investigate if the regions of domain borders are preserved in evolution of birds. Recently, more than 1000 evolutionary breakpoint regions (EBRs), i.e. regions where ancestral chromosomes break and/or combine in descendant species, were identified by analysis of 20 avian and five outgroup genomes (67). We found that avian evolutionary breakpoint regions were strongly enriched within CEF TAD boundaries, while inside CEF TADs the frequency of breakpoint regions was slightly depleted (Figure 9A). This pattern was similar in both galliform linage specific and non-galliform EBRs (Supplementary Figure S12A).
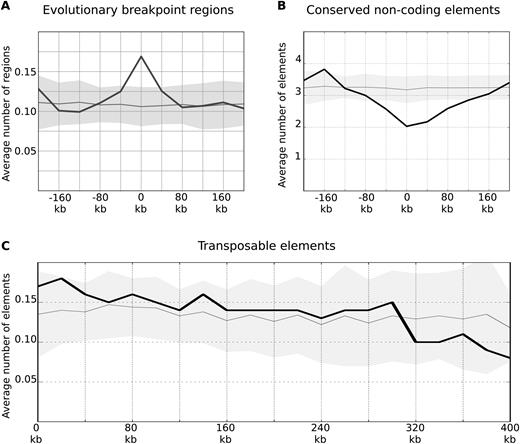
TAD borders are hotspots of avian evolutionary breakpoints. (A and B) The distribution of evolutionary breakpoint regions (excluding galliform linage specific EBRs) and conserved non-coding elements is shown as on Figure 3C. The X-axis represents a distance from the border of a domain. (C) The distribution of transposable elements relative to domain borders is shown as on Figure 3C, the negative and positive distances on the X-axis are averaged and the X-axis is extended to 400 kb to show decline of the curve.
Studies in mammals and birds show that at least in some cases evolutionary breakpoint regions are enriched with transposable elements and depleted of conserved non-coding elements (67,75). Indeed, the conserved non-coding elements show statistically significant depletion near TAD borders and more frequent occurrence inside domains (Figure 9B). As for transposable elements, we did not find statistically significant enrichment near TAD borders, however we detected a trend toward decline of transposable element frequencies with increase of distance from TAD border (Spearmen R = −0.93; Figure 9C). This trend was observed in different classes of transposable elements (Supplementary Figure S12B–D). Thus, we showed that avian chromosomal rearrangements occur between TADs more often than within domains, and TAD borders display typical properties of evolutionary breakpoint regions, such as the presence of transposable elements and the depletion of conserved non-coding elements.
Analysis of interchromosomal contact distribution in chicken nuclei
Considering domains as the contact-enriched areas which interact mostly within themselves, we should mention that the most prominent examples of such self-interacting regions of chicken genome are individual chromosomes. In both fibroblasts and erythrocytes, intrachromosomal contact frequencies were several times higher than interchromosomal ones (Figure 10A). Of note, the difference between frequencies of intra- and interchromosomal contacts were more prominent in CEF data, where chromosomes 16 and 21–28 display 100–150 times more intra- than interchromosomal contacts (the same chromosomes in CME had 24–46 times difference in contact frequencies). In all cell types, microchromosomes display higher ratio of intra- to interchromosomal contacts than macrochromosomes (Figure 10A).
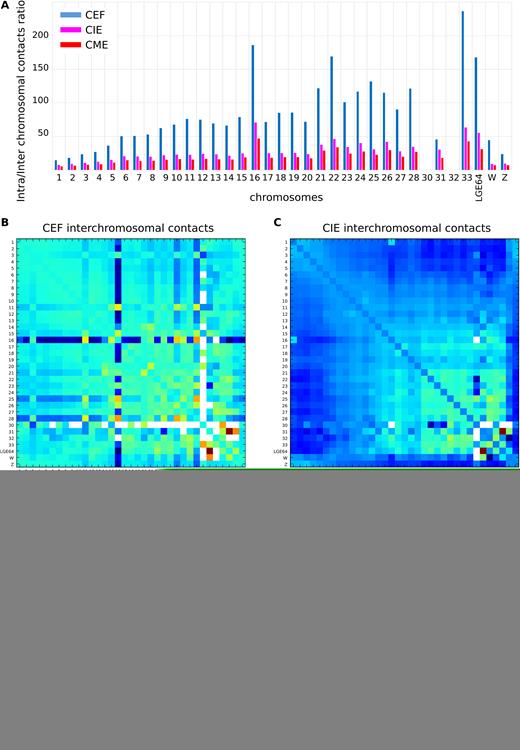
Interchromosomal contacts in CEF, CIE and CME. (A) The ratio between intra- and interchromosomal contact numbers for CEF (blue), CIE (magenta) and CME (red). Note that it was not enough data to calculate the ratio for chromosomes 30 and 32. (B–D) The 2D heatmaps show the observed number of interactions between any pair of chromosomes divided by the expected number of interactions between those chromosomes in log2 scale for CEF (B), CIE (C) and CME (D). The color of each dot represents the enrichment (red) or depletion (blue) of contacts compared with the expected values.
The rare interchromosomal contacts were not equally distributed among chicken genome; in both CEF and CME data, we observed clustering of microchromosomes and several unexpectedly strong interchromosomal interactions, such as, for example, contacts between linkage group LGE64 and chromosome 31 (Figure 10B–D). Interestingly, in CEF chromosome 16 displayed a specific pattern of interchromosomal contacts, which was observed in both replicas (Figure 10B–D and Supplementary Figure S13). This pattern was not detected in CME or CIE (Figure 10C), denoting the difference of spatial organization of chromosome 16 in these cell types.
To facilitate further research of chicken chromatin organization, we performed visualization of obtained CEF, CIE and CME data using JuiceBox software (57) and made it publically available at http://icg.nsc.ru/ontogen/.
DISCUSSION
Here, we present a first high-resolution genome-wide analysis of chromatin interactions in chicken cell nucleus. We showed that the fundamental principles of spatial genome organization previously observed in several mammalian species appear to be similar in chicken cell nuclei.
TAD dimensions scaling with genome size was deduced from TAD comparisons of Drosophila and mammalian cell types (2,7,8,17). However, in chicken the median size of TADs roughly corresponded to mammalian TADs, while the chicken genome approximately three times smaller than the human genome. This means that smaller size of chicken genome results in reduced number of TADs rather than proportional decrease of TAD length. Due to our limited knowledge of ancestral genomes and their spatial structure, we cannot dissect whether some large ancestral TADs were split into smaller domains during evolution of mammals or some TADs were lost during avian evolution. In addition, we cannot exclude technical explanation of difference in TADs number between chicken and mammals: calling of TADs with defined parameters and at a defined resolution may favor reporting of domains with a defined length. Any favored domain length will result in production of different number of TADs for chicken and mammalian genomes. It is important to note, that small physical domains identified in Drosophila were called at 4–20 kb resolution (8,17,18), whereas chicken and mammalian TADs were identified at 40 kb resolution (2,3,16,76).
Consistent with it, we did not observe any difference in sizes of TADs between gene-dense micro- and gene-poor macrochromosomes. We were not able to identify TADs in several smallest chicken chromosomes, because they are poorly represented in the current assembly of the chicken genome (25). Further improvement in the chicken genome assembly and physical mapping will apparently contribute to the analysis of spatial organization of these tiny chromosomes in interphase nucleus.
It has been shown previously that genome segregation into physical domains in Drosophila could be unambiguously explained by differences in chromatin compaction of transcriptionally active and inactive regions, determined by epigenetic profile (18). However, principles orchestrating TADs formation in Drosophila could not be directly translated to mammalian TADs, where CTCF is put forward as the main TAD builder (2,13,70,71,77). A strong enrichment of CTCF sites near domain borders observed in CEF data favors hypothesis that, as in mammals, this factor plays a major role in organization of chicken fibroblast domains.
One of the highlighted features of mammalian TADs is that they are present in all studied cell types and show moderate degree of conservation even when comparing very different cells, such as mouse fibroblasts and sperm (1–3,16). Surprisingly, our study shows that chicken erythrocytes are unique cells, which do not form spatial structures analogous to mammalian TADs during interphase. It is considered that in mammals cohesin forms TADs by extruding chromatin loops until it encounters CTCF (78). Thus, to explain absence of TADs in chicken erythrocytes we might speculate that loop extrusion is active in these cells, but CTCF does not bind DNA to demarcate TAD borders. This hypothesis finds support in current and previous observations of unusual distribution of CTCF in erythrocytes nuclei, obtained using immunofluorescence (72). Another possibility is that loop extrusion does not occur because one or several components of cohesin complex are inactive in erythrocytes. Although we showed that Rad21 is present in erythrocytes, it is possible that other components of cohesin complex, or proteins associated with cohesion activity such as NIPBL are absent or not active. This suggestion is in a good agreement with increased compartmentalization observed in erythroid cells, because it was recently shown that process of loop extrusion decreases the level of genome compartmentalization (79). At last, chicken erythrocytes contain a specific lysine-rich histone H5, and the total level of H1 and H5 histones in polychromatic and mature erythrocytes is higher than in other vertebrate cells, which may contribute to unique features of chromatin packaging in these cells (80).
Interestingly, another group has recently reported formation of TADs within 2.7 MB segment of chicken chromosome 14 harboring the α-globin gene cluster in both undifferentiated and differentiated chicken erythroid HD3 cells (81). This discrepancy between results of (81) and our data most probably stem from specific features of HD3 model system. Although HD3 cells are widely used to study erythropoiesis (82), it is not known whether all aspects of chromatin organization of these cells are similar to primary erythrocytes. Moreover, as almost all differentiation systems, differentiation of immortalized HD3 cells results in mixed population, enriched by terminally differentiated erythrocytes, but also containing undifferentiated or not completely differentiated cells. The research describing HD3 cells and their differentiation potential provides evidences that proportion of undifferentiated cells may vary from 2% to more than 50% depending on HD3 subline (83). According to results obtained by (84) and our observations, presence of ∼5% of cells harboring TADs in population is sufficient for depiction of TADs in population-derived Hi-C maps. Thus, TADs identified by (81) in differentiation-induced HD3 cells may reflect presence of these chromatin topologies in undifferentiated subpopulation present in culture.
We found that CIE and CME contact maps display the second diagonal—a feature previously observed on mitotic chromosomes. It is not excluded that large loops with the size >10 MB formed by condensin during mitosis are preserved in the interphase nucleus of erythrocytes. The disappearance of TADs further extends similarity between mitotic chromosome and CME interphase genome. Interestingly, the size of CIE loops is comparable with previously reported size of mitotic chromosome loops (∼12 MB); however, loops identified in CME are bigger (15–17 MB). The increase of loop size during transition from CIE to CME may be involved in the mechanism of the mature erythrocyte genome compaction.
One more difference observed between CEF and erythrocytes is related to interchromosomal contacts of microchromosome 16, which encompassed nucleolus organizing region (85,86). We believe this discrepancy could be explained by the difference in activity of ribosomal NOR genes in CEF and erythrocytes. In CEF, NOR genes are active and fully functional nucleolus could be easily distinguished, as evident from Figure 2A. Nucleolar proteins, transcription factors and newly synthesized ribosomal RNA probably mask microchromosome 16 from a number of long-range contacts with other chromosome territories, resulting in general depletion of interchromosomal interactions compared to other microchromosomes. In contrast, CME lacks functional nucleolus (87) and conventional pattern of microchromosome interchromosomal interactions is observed for microchromosome 16.
Surprisingly, we found almost no differences in spatial organization of mature and immature erythrocytes. Immature erythrocytes obtained by induced anemia belong to reticulocytes or (according to another classification) mid- and late-polychromatic erythrocytes (50,88). Similarity of CIE and CME indicates that major events underlying unique spatial organization of erythrocytes’ genome occur earlier than polychromatic erythrocyte stage.
Finally, we wish to highlight evolutionary aspect of 3D-genome organization in chicken nuclei. Recently, it was shown that the 3D organization of chromatin partially explains evolutionary fragile genomic regions in mammals (15,89). Comparison of avian evolutionary breakpoint regions and TADs location provided evidence that spatial organization of chromosomes may play a similar role in evolution of birds. Besides, we found a notable conservation of domain borders in chicken and human, species separated by a large evolutionary distance. The conservation of spatial architecture of genomes was also evident from the high percentage of orthologous genes that are grouped similarly near TAD borders in chicken and mammals. These facts again indicate the important role of TADs as units of genome regulation.
DATA AVAILABILITY
The sequencing results of Hi-C libraries are available in the NCBI GEO database (GSE96037). Processed data (JuceBox .hic files and domain coordinates) are available at http://icg.nsc.ru/ontogen/
SUPPLEMENTARY DATA
Supplementary Data are available at NAR Online.
ACKNOWLEDGEMENTS
The work was partially performed using experimental equipment of the Research Resource Center ‘Biobank’ and ‘Molecular and Cell Technologies’ of St Petersburg State University Research Park. Cell culture and Hi-C libraries preparation were performed in Resource Center of the Institute of Cytology and Genetics (state project No. 0324-2018-0016 of Russian Academy of Sciences). We appreciate scientific discussions with Sergey Ulianov, who proposed the idea that CME lack TADs.
Authors contribution: Alla K. initiated the study. Alla K., V.F., N.B. and O.S. designed all experiments and supervised the study. N.B., V.F. and A.M. isolated cells, Alexey K. performed intravenous injections. N.B. prepared Hi-C libraries. V.F. and M.N. performed computational analysis. A.M. and A.Z. performed FISH. D.C. performed western-blotting. A.S. performed TEM. All authors contributed to manuscript preparation.
FUNDING
Russian Science Foundation [#14-14-00131]; Russian Foundation for Basic Research [RFBR #18-04-00668]; Grant of President of Russia [MK-1630.2017.4].
Conflict of interest statement. None declared.
REFERENCES
Author notes
The authors wish it to be known that, in their opinion, the first two authors should be regarded as Joint First Authors.

Comments