


Abstract
Guanine-rich nucleic acids can fold into the non-B DNA or RNA structures called G-quadruplexes (G4). Recent methodological developments have allowed the characterization of specific G-quadruplex structures in vitro as well as in vivo, and at a much higher throughput, in silico, which has greatly expanded our understanding of G4-associated functions. Typically, the consensus motif G3+N1–7G3+N1–7G3+N1–7G3+ has been used to identify potential G-quadruplexes from primary sequence. Since, various algorithms have been developed to predict the potential formation of quadruplexes directly from DNA or RNA sequences and the number of studies reporting genome-wide G4 exploration across species has rapidly increased. More recently, new methodologies have also appeared, proposing other estimates which consider non-canonical sequences and/or structure propensity and stability. The present review aims at providing an updated overview of the current open-source G-quadruplex prediction algorithms and straightforward examples of their implementation.
INTRODUCTION
G-quadruplexes (G4) are four-stranded secondary structures formed by particular G-rich nucleic acid sequences. They result from the stacking of multiple stable ‘G-quartets’, planar arrangements of four guanines held together by Hoogsteen-type hydrogen bonding and further stabilized by monovalent cations (generally K+ or Na+) (1–3) (Figure 1A). Extensive biophysical and structural studies revealed a striking diversity of quadruplex conformations depending on the number of stacked G-quartets, the length of the interconnecting loops and their sequences, as well as nucleic acids strand orientation during folding or the nature of the cation present in the central ion channel (4–7). Notably, G4s can adopt intramolecular folds when arising from a single G-rich DNA or RNA strand, or intermolecular folds, through dimerization or tetramerization of two or more strands (Figure 1B) (8–10). Extensive evidence implicates G4 sequences in various essential biological functions, including telomere maintenance (11–14), DNA replication (15–17), genome rearrangements (18–20), DNA damage response (21–23), chromatin structure (24–26), RNA processing (27–29) and transcriptional (30–34) or translational regulation (35–37). Although current reports of biologically relevant quadruplexes mainly focus on unimolecular folds (described hereafter), intermolecular structures possibly implicated in critical cellular functions have recently been described (38–41). The structural diversity, folding topologies and in vitro stability of quadruplexes have been widely studied, thus allowing to study its properties as a novel pharmacological target for small molecules, or G4 ligands (42), which have potential to modulate oncogene expression (43–46) or exert antiviral activity (47,48).
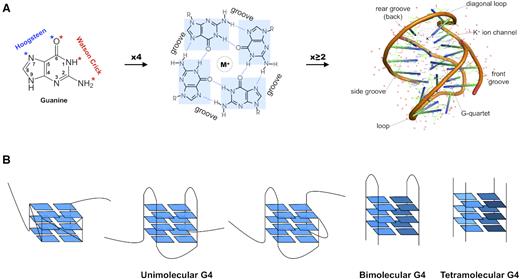
From guanines to G-quadruplexes. (A) From left to right, guanine residue; four guanines form a planar tetrad stabilised by a central monovalent metal ion (M+), or G-quartet (R, sugar-phosphate backbone of nucleic acids); the stacking of multiple G-quartets forms a G-quadruplex secondary structure. Cartoon representation of the Oxytricha telomeric DNA G4 crystal structure (PDB accession 1JPQ (112)). Structure visualisation was performed with the PyMOL v2.3.1 software (The PyMOL Molecular Graphics System, Version 2.0 Schrödinger, LLC), using default colours. (B) Diversity of the G-quadruplex structure. From left to right, three conformations of unimolecular G4s with different backbone arrangements (parallel, anti-parallel and mixed); interstrand bimolecular quadruplex and; interstrand tetramolecular quadruplex. Shades of blue represent different strands.
There are a number of largely described experimental techniques that have been used to validate the G4-forming capacity of specific sequences. These include methods that provide structural information, such as NMR (49), X-ray crystallography (50) or circular dichroism spectroscopy (51) – also used to monitor the kinetics of the formation of quadruplex (52–54), as well as methods that provide information on the thermal stability of quadruplexes, namely UV melting (55,56), and finally, methods that use fluorescence tags for visualization (57–59). However, none of these techniques is suitable nor sufficiently high-throughput to scan and identify new G-quadruplexes on a genomic level; thus, some form of predictive algorithm is necessary in order to identify putative G-quadruplexes on a whole-genome scale. Indeed, most approaches to characterize G-quadruplex structures have so far combined in silico predictions with in vitro biophysical evidence of G4 folding. Interestingly, the first algorithms for in silico detection were developed on criteria based on a variety of biophysical and biochemical experiments. The algorithmic development in quadruplex detection initially used regular expression matching approaches, that were further enriched through the use of score calculations, which might also be combined with sliding window algorithms and, most recently, machine learning approaches (Table 1).
Open-source G-quadruplex motif detection tools
| Method | Name | Features | Language | Reference |
|---|---|---|---|---|
| Regular expression matching | Quadparser | Gt1NL1Gt2NL2Gt3NL3Gt4, with t = 3–5 and L = 1–7 by default (G4L1–7) | C++, Python | Huppert and Balasubramanian (2005) (61) |
| Quadruplexes | G3–5N1–7G3–5N1–7G3–5N1–7G3–5 | C++ | Todd et al. (2005) (62) | |
| AllQuads | Intermolecular G4 detection: | Perl | Kudlicki (2016) (69) | |
| G3+N1–7G3+N1–7C3+N1–7C3+ | ||||
| G3+N1–7C3+N1–7G3+N1–7C3+ | ||||
| G3+N1–7C3+N1–7C3+N1–7G3+ | ||||
| G3+N1–7G3+N1–7G3+N1–7C3+ | ||||
| G3+N1–7G3+N1–7C3+N1–7G3+ | ||||
| ImGQfinder | Allows to match imperfect intramolecular G4 sequences with a single defect: mismatches (Gi-1NGk-1, where N = {A,T,C}, while a canonical G-run would be noted as Gk) or bulges (Gi-1NGk-i+1, where N = {A,T,C}) | Web | Varizhuk et al. (2017) (71) | |
| Scoring | QGRS Mapper | GxNy1GxNy2GxNy3Gx, with x ≥ 2. | Standalone: Perl, Java; Web: PHP, Java | Kikin et al. (2006) (72) |
| Restrictions: maximum length set to 30 nt, can be set to 45 nt by the user. A single loop of 0 length is allowed. | ||||
| Scoring: Gscore, benefits short and similar sized loops, and high number of tetrads; depends on the selected maximum G4 length. | ||||
| pqsfinder | Three-step procedure: | C++ and R | Hon et al. (2017) (73) | |
| - step 1: identification of all possible G-run quartets; | ||||
| - step 2: score assignment; | ||||
| - step 3: overlap resolution | ||||
| Sliding window, scoring | G4P calculator | G-run length>3 | C# | Eddy and Maizels (2006) (74) |
| number of G-runs per window ≥4 | ||||
| window length 100 nt; and sliding interval length 20 nt | ||||
| cG/cC | |${\rm{cG}}( {\rm{s}} ) = {\rm{\ }}\mathop \sum \limits_{i\ = \ 1}^n (| {Gs( i )} |\ \times \ 10\ \times i$| | Spreadsheet treatment | Beaudoin et al. (2014) (75) | |
| |${\rm{cC}}( {\rm{s}} ) = {\rm{\ }}\mathop \sum \limits_{i\ = \ 1}^n (| {Cs( i )} |\ \times \ 10\ \times i$| | ||||
| |${\rm{cG}}/{\rm{cC\ score\ }} = {\rm{\ cG\ score}}/{\rm{cC\ score}}$| | ||||
| G4Hunter | Scoring based on G richness and G skewness: A,T: s = 0; G s > 0; C s < 0 | R/Python | Bedrat et al. (2016) (76) | |
| Sliding window set at n = 25 nt by default | ||||
| Window score = Sum(per-base values)/n | ||||
| |${\rm{Window\ score\ }} = \mathop \sum \limits_{i = 1}^{25} {s_i}/n{\rm{\ \ }}$| | ||||
| Machine learning | G4RNA screener | Artificial neural network (ANN) trained with sequences of experimentally validated RNA G4s from the G4RNA database (77) | Python (PyBrain library) | Garant et al. (2017) (78) |
| Quadron | Tree-based gradient boosting machine (GBM) algorithm trained on G4-seq data (79) for the human nuclear genome | R (xgboost library) | Sahakyan et al. (2017) (80) | |
| Specialized tools | ViennaRNA folding suite (RNAfold) | Estimates RNA G4 (rG4) folding energy and assesses competition (minimum free energy comparison) between this fold and alternative RNA secondary structures (e.g. hairpin) | Web server Standalone: C | Lorenz et al. (2013) (81) |
| G4PromFinder | Two-step procedure for the prediction of putative promoters in bacteria: | Python | Di Salvo et al. (2018) (82) | |
| - step 1: sliding window search over a query sequence (step: 1bp) until %AT reaches 40% (‘AT-rich element’); | ||||
| - step 2: regular expression matching approach for G4 sequences, GxNyGxNyGxNyGx, with 4 ≥ x ≥ 2, 10 ≥ y ≥ 1 and maximum length set to 30 nt |
REGULAR EXPRESSION MATCHING ALGORITHMS: THE CLASSICAL APPROACH
A regular expression (regex) is a discrete sequence of characters that defines a search pattern. This technique is based on the detection of a strict pattern that the putative G4-forming sequence should take. As previously mentioned, biophysical data led to the definition of a motif sequence for intramolecular G4s comprising stretches of guanines (G-runs or -tracts) separated by gaps (loop sequences) of limited length, which were predicted to fold into stable G4s under near-physiological conditions (60). Seminal publications from the Balasubramanian and Neidle groups describe the first analyses of G-quadruplex forming potential in the human genome (61,62), which led to the identification of 376 000 putative unimolecular G4s in the hg19 reference. They used the regular expression G3–5N1−7G3–5N1−7G3–5N1−7G3–5, which requires a matching sequence to rigorously satisfy two criteria: (i) each of the four guanine runs has a length of three to five nucleotides, and (ii) the lengths of the three loops are comprised between one and seven nucleotides, where N is any of the four nucleotides {A,T,C,G}. Many scripting languages provide frameworks for regular expression matching implementation, for instance the following syntax is used in Python: ‘([gG]{3,5}\w{1,7}){3}[gG]{3,5}’ (or ‘([cC]{3,5}\w{1,7}){3}[cC]{3,5}’ in the C-rich strand, as both G- and C-rich patterns are taken into account). This type of search produces a binary ‘yes/no’ output, without any judgment as to the potential structure stability or the in vivo folding likelihood. A major difficulty lies in the evaluation of nested structures, i.e. hits occurring in long stretches of multiple G-tracts with the potential to adopt multiple G4 folds and where the definition of an individual quadruplex may be ambiguous. We have proposed handling overlapping matches following two simple rules: (i) counting non-overlapping identical motifs only or, (ii) counting overlapping motifs with different loop sequences; for instance, the ‘GGGAGGGAGGGTGGGAGGG’ sequence would count for two G4 motifs, one with loops A-A-T and another one with loops A–T–A (63).
Since 2005, this motif (or slight variants of the same underlying expression using different limits on the length of the loops) has been used in most studies (6,21,33,36,44,64–68). More recently, a study described the identification of intermolecular DNA quadruplexes in the human genome using a similar pattern finding approach, but taking into consideration both DNA strands (69). Five different topologies of cross-strand G-quadruplexes were assessed, depending on the order of G- and C-tracts (denoted here as G for GGG and C for CCC): (i) GGCC, (ii) GCGC, (iii) GCCG, (iv) GCCC, (v) CGCC, and were predicted to be widespread in the human reference genome (550 977 unique interstrand G4s in the hg19 reference, when allowing loop sizes between 1 and 7 nt, compared to 374 834 intrastrand motifs). A recent report illustrates the use of this intermolecular G4 prediction approach to assess the relationship between quadruplex formation and genome instability in yeast, through a direct, genome-wide, DNA double-strand break labelling technique (70).
Let us note that the global pattern, Gx1NL1Gx2NL2Gx3NL3Gx4, has some important features which can be used to distinguish and categorize sequences for further analysis; namely, the individual loop sequences (L) and the length of the guanine runs (x). Considering a loop of length between one and seven nucleotides can give up to 21 844 possible sequences and the combination of three loops would give over 1013 different patterns, which can partly explain the limited number of studies focusing on loop nucleotide identity (whole-genome view (62); single-nucleotide G4s (63,68)). There has been more focus on categorization by motif length (loop size, G-tract size), which was already largely described by Huppert and Balasubramanian, who provided a map of the loop lengths of all putative quadruplexes found in the human reference genome (61).
SLIDING WINDOW AND SCORING APPROACHES
The quadruplex-forming G-rich sequence (QGRS) mapper algorithm takes a slightly different approach from regular expression matching algorithms by scoring each of the possible sequences in order to rank them and hence predict the most likely sequence when there are several alternatives (72). Its implementation uses a more flexible motif definition Gx1NL1Gx2NL2Gx3NL3Gx4, where the length of the G-tracts is defined as x ≥ 2 nt and it allows for at most one of the gaps to be of zero length. The scoring method (termed G-score) is based on three considerations: (i) shorter loops are more common than longer loops, (ii) loop sizes tend to be similar and, (iii) the greater the number of guanine triplets, the more stable the quadruplex. Nevertheless, experimental data supporting the G-score significance are limited and verification of some of the attributes considered in the scoring process is lacking (83).
Recently, the existence of imperfect or non-canonical quadruplexes has been validated by in vitro and in vivo experiments (84–87). The corresponding sequences lack four G-triplets, and consequently escape the canonical G4 motif. Accordingly, new tools for quadruplex prediction allowing mismatches, bulges or incomplete tetrads (G-triads) have been developed. Notably, ImGQfinder (71) considers the possibility of a single bulge or mismatch in a wider variety of guanine run lengths, and pqsfinder (73) authorizes up to three imperfections in a single sequence (mismatches, bulges in G-runs and/or long loops >9 nt) and has the advantage of assigning a score to each predicted G4, allowing to quantify the relationship between sequence and structure stability (as it gives a bonus to G-tetrad stacking but penalizes mismatches and bulges). Although this scoring system is an empirical approximation, the pqsfinder tool provides a very flexible framework for experienced users as it allows to define custom criteria for matching and scoring (73).
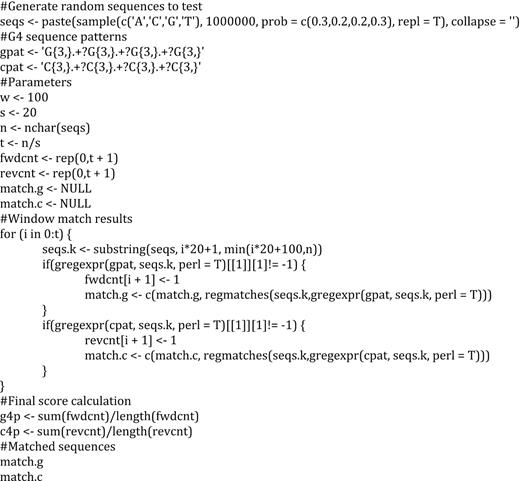
Alternatively, algorithms based on sliding window approaches have also been developed and used to detect potential G4s within a genome. This detection method does not define strict individual PQS boundaries nor sequence composition, and therefore it would be able to identify non-canonical G4s, at the expense of being unable to examine overlapping structures (as portions of nucleotides are analysed instead of regular sequences). The G-quadruplex potential (G4P) calculator (74) evaluates runs of guanines in a sliding window depending on three parameters, (i) length of each run of guanines (k = 3 by default), (ii) window size (w = 100 nts by default) and (iii) step or sliding interval (s = 20 nts by default). Within a window of size w, and starting from the beginning of the user-defined input sequence, the algorithm searches for 4 runs of guanines of k length every s nucleotides, so the final G4P is the fraction of these windows containing four guanine k-mers separated by at least one nucleotide. This approach limits the length of the G4 sequence candidate but not the length of its individual loops, in accordance with the observation that large loops (>7 nt) can support G-quadruplex formation in vitro (88–90). The authors have made publicly available a program that runs only on a Windows OS; Ryvkin and colleagues have proposed an R implementation pseudo-code (91), which we have updated and modified here to also output the matched sequences (assuming k ≥ 3):
Interestingly, the more recent computational approaches introduce validation stages using large-scale experimental data, as opposed to the approaches previously described which were based on a generalization from a restricted number of biophysical studies. The pqsfinder tool was largely tested on the high-throughput, in vitro-generated G4-seq dataset (79) (detailed hereafter), which was used to train the algorithm's parameters. The G4Hunter algorithm (76) was tested and validated using 392 G4 sequences confirmed in vitro and by an in-depth analysis of the G4-propensity in the GC-rich human mitochondrial genome. This tool was developed to calculate quadruplex propensity scores by taking into account the G-richness (reflecting the fraction of guanines in the sequence) and the G-skewness (reflecting G/C asymmetry between the complementary nucleic acid strands) of a given sequence. These two parameters were introduced in order to consider the experimental destabilization effect caused by nearby cytosine presence on the G-quadruplex, as C can base pair with G and ultimately obstruct G-quartet formation (75). The Python implementation of the G4Hunter method requires the setting of two parameters, the window size (set, by default, to 25 nt) and a score threshold for G4 detection. A window size of 25 nt was used for most of the validation analyses described by the authors and seems to be a reasonable choice given that it corresponds to the actual size of many in vitro experimentally characterized G-quadruplexes. As for the score threshold, a value of 1.2 results in a good discrimination of G4 versus non-G4 sequences and represents a good compromise between sensitivity and specificity. Indeed, setting a higher score threshold (>1.7) considerably minimizes the number of false positive but results in a high number of false negatives; therefore, to perform an exhaustive exploration of G4 potential within a genome or a set of target sequences, lower thresholds are to be privileged. The main limitations of this method are the context independent scoring of loop bases (equal null per-base scores for A and T are not necessarily justified since, for instance, G4 structures carrying single thymine nucleotides are significantly more stable than the ones with loops of single adenine (63,68,92)), and the empirical choice by the user of a score threshold for detection. Similarly, the cG/cC scoring scheme was conceived specifically for G4 RNA to address the issue of competition between G:C base pairing and Hoogsteen G:G base-pairing required for G-quartet assembly (75). This method penalizes the presence of Cs within the target sequences to account for their negative effect on G4 stability by calculating the ratio between two different scores (cG and cC), each proportional to the number of G or C tracts, incrementally weighted for longer stretches, according to the formula shown in Table 1. This approach also uses experimental validation (although upon two relatively small sets of 20 characterized G4 sequences), which has led to an empirical detection threshold of 2.05–3.05 cG/cC score for the formation of a stable G4, and where the higher the cG/cC scores are, the more likely is the G4 folding. However, the parameterization seems arbitrary, as both the score threshold for detection and the multiplicative factors in the formulas (i terms) are chosen based on heuristics that have not been rigorously justified (93). Finally, the current implementation of the cG/cC scoring system does not easily support genome-wide detection, but is suitable for queries on specific sequences of interest.
MOST RECENT DEVELOPMENTS: MACHINE LEARNING APPROACHES
Overall, the previous approaches were mostly based on expert knowledge (biophysical and biochemical data, insight from resolved structures) and considered a limited number of observed G4 structures that could perfectly depict an incomplete picture of the wide variety of G4 conformation possibilities (known or still unknown). Such strategies would not be necessarily suitable if the goal was to predict new conformations or sequences purely by computational investigation. Therefore, the newest approaches in the field are centred on the development of machine-learning algorithms (fundamental methods applied in computational biology are reviewed in (94)), which let the data drive the predictions. These approaches avoid predefined motif definitions and minimize folding assumptions to improve the analytical accuracy on non-canonical or unanticipated PQS, but are relatively obscure when it comes to providing further insight into the predictive features determining G4 formation (so-called ‘black-boxes’). The G4RNA screener (78) method implements a minimal machine learning model (a feedforward, single-layer artificial neural network) that trains itself in the recognition of G4-prone sequences based on the experimentally-validated G4s available in the G4RNA database (149 G4 and 179 non-G4), and reports a score illustrating the similarity of a given input sequence to known G4s (77). This model demonstrated to have an excellent predictive power for RNA G4s and to be especially efficient in discarding randomly selected transcripts (78). The approach was later tested on nearly 4000 in vitro detected RNA G4s (rG4-seq) (95) and compared to the cG/cC and the G4Hunter algorithms for classification performance, giving comparable or better outcomes. G4RNA screener was originally released in command line form but interestingly, as many users are not familiar with such implementations, the authors have since released a graphical interface which should facilitate access to the tool (96). Finally, the RNAfold tool, included in the Vienna RNA secondary structure prediction software package (81), could be used as a complementary approach to include the estimated folding energies of the predicted rG4 sequences (Table 1).
In a similar fashion, the Quadron algorithm (80) uses tree-based gradient boosting machines (GBMs, a regression and classification method) as its model's central framework, which was trained on an extensive experimental in vitro G4-formation dataset (over 700 000 sequences) recently obtained for the human genome using the G4-seq methodology (79), and specifically for DNA G4s in this case. The program, which includes a graphical interface that can be run locally, outputs a file containing the sequence and location (start position, length, strand) of the detected G4 sequences as well as prediction score of the corresponding G4-seq mismatch level for a polymerase stalling at quadruplex sites. The authors state that score values above 19 indicate that the corresponding PQS is predicted to fold into a highly stable G-quadruplex (80). Nevertheless, the current version of this tool does not output scores when assessing isolated sequences (for instance, when the user provides a single sequence input such as ‘GGGAGGGAGGGAGGG’). This program assesses formation propensity for canonical sequence motifs (with 12-nt maximum loop size), thus reducing the false positive and false discovery rates of the classical pattern matching method. However, to date, its methodology has not been extended to account for non-canonical sequences (80), thus limiting the advantages of the machine learning approach.
PERFORMANCE COMPARISON OF DIFFERENT TOOLS ON A SET OF EXPERIMENTALLY VERIFIED G4S
The aforementioned software (or their variants) is publicly available, open-source and can be accessed through the repositories/web servers listed in Table 2. Notably, all the stand-alone programs can be run locally on desktop computers (originally run on an iMac Retina 2017 3.5 GHz i5 for this review). In the scope of this work, we have decided not to detail and/or test prediction tools that were not open-source or readily available. An example is the analytical approach described by the Myong lab (97), using linear and Gaussian process regression models to predict G4 folding potential: even though the approach is thoroughly described in the associated publication, the original code is MATLAB-based which is not open-source software.
G-quadruplex detection open-source software availability
G-quadruplex detection open-source software availability
We have compared the performance of different open-source, currently working, G-quadruplex prediction tools on a reference dataset (Figure 2). The reference quadruplex set used for this evaluation is composed of 392 in vitro experimentally verified G4 sequences, consisting of 298 positive (‘G4’) and 94 negative (‘noG4’) samples, as previously described (76). Let us note that this sequence set has various drawbacks, as it is unbalanced (there are 3-fold more G4 than noG4 sequences and the large majority of the motifs are canonical) and it is composed of isolated sequences without context. However, it is the only experimentally validated (in vitro) sequence set that is currently available and thus was chosen to perform a straightforward tool performance benchmarking. To calculate performance metrics such as accuracy, sensitivity, specificity and Matthews Correlation Coefficients (Table 3), we imposed score thresholds that resulted in the highest possible values for each of the scoring tools and notably, we configured the selected tools with the sets of parameters (default or custom) specified in Table 4. In addition, for tools that associate a score to their predictions, we have also compared the scores obtained for G4 and noG4 sequences (Figure 2A) and measured the area under the ROC curve (AUC; Figure 2B). To note, the G4Catchall tool (99) combines sequence scoring and regular expression matching, but currently outputs the G4Hunter score, therefore it was not considered for AUC calculation.
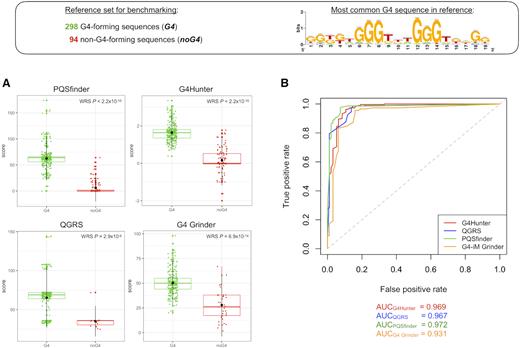
Performance comparison of different G-quadruplex prediction tools on a reference dataset. The reference dataset used for evaluation is composed of 392 in vitro experimentally verified G4 sequences, consisting of 298 positive and 94 negative samples. The sequence logo represents the most common motif found within this set. (A) Tool scores for the reference dataset. Points represent the score values for individual sequences belonging to either G4 or noG4 classes. WRS: Wilcoxon rank sum test. (B) ROC curves for different tool scores on the reference dataset. A random performing estimator would follow the dotted diagonal line. AUC values for each tool are shown below.
Performance metrics used for tool performance assessment than can be directly calculated from a confusion matrix
| Metric | Use | Calculation |
|---|---|---|
| Sensitivity (SEN) | Measure the proportion of true positives (TP) that are correctly identified as such (true positive rate) | |$\frac{{{\rm{TP}}}}{{{\rm{TP}} + {\rm{FN}}}}$| |
| Specificity (SPE) | Measure the proportion of true negatives (TN) that are correctly identified as such (true negative rate) | |$\frac{{{\rm{TN}}}}{{{\rm{TN}} + {\rm{FP}}}}$| |
| False Discovery Rate (FDR) | Measure the proportion of false positives (FP) among positive results | |$\frac{{{\rm{FP}}}}{{{\rm{FP}} + {\rm{TP}}}}$| |
| Accuracy (ACC) | Measure the proportion of true results (true positives and true negatives) among the total number of outcomes | |$\frac{{{\rm{TP}} + {\rm{TN}}}}{{{\rm{TP}} + {\rm{TN}} + {\rm{FP}} + {\rm{FN}}}}$| |
| Matthews Correlation Coefficient (MCC) | Discrete case for Pearson Correlation Coefficient; measures the quality of the binary classification by taking into account true and false positives (TP, FP) and true and false negatives (TN, FN) | |$\frac{{{\rm{TP\ }} \times {\rm{\ TN}} - {\rm{FP\ }} \times {\rm{\ FN}}}}{{\sqrt {( {{\rm{TP}} + {\rm{FP}}} )( {{\rm{TP}} + {\rm{FN}}} )( {{\rm{TN}} + {\rm{FP}}} )( {{\rm{TN}} + {\rm{FN}}} )} }}$| |
| Receiver Operating Characteristic (ROC) curve | Visualize the trade-offs between sensitivity and specificity when performing a binary classification | Plot the sensitivity values against the false positive rate (FPR, or 1 − SPE) at various thresholds (step: 0.1) |
| Area Under the ROC Curve (AUC) | Assess the probability that a true positive is scored greater than a true negative | Calculation based on trapezoidal rule |
G-quadruplex detection software performance comparison
| Tool | Settings | TP | FP | TN | FN | ACC | SEN | SPE | MCC | FDR |
|---|---|---|---|---|---|---|---|---|---|---|
| G4-iM Grinder | Default | 233 | 1 | 93 | 65 | 0.832 | 0.782 | 0.989 | 0.671 | 0.004 |
| G4-iM Grinder | Number of tetrads: 2; max loop len: 25; number of bulges: 3; score threshold: 31 | 285 | 16 | 78 | 13 | 0.926 | 0.956 | 0.830 | 0.795 | 0.053 |
| G4CatchAll | Default | 235 | 4 | 90 | 63 | 0.829 | 0.789 | 0.957 | 0.653 | 0.017 |
| G4CatchAll | Min G-tract length: 2; max loop size: 15; max imperfections: 1; extreme loop allowed (for ≥3 G tracts) | 293 | 20 | 74 | 5 | 0.936 | 0.983 | 0.787 | 0.820 | 0.064 |
| G4Hunter (R scripts) | Score threshold: 1 | 278 | 7 | 87 | 20 | 0.931 | 0.933 | 0.926 | 0.823 | 0.025 |
| G4Hunter (R scripts) | Score threshold: 0.70 | 294 | 15 | 79 | 4 | 0.952 | 0.987 | 0.840 | 0.864 | 0.049 |
| ImGQfinder | Default (max loop length: 7; number of defects: 1), with number of tetrads: 3; max number of non-overlapping GQs | 283 | 5 | 89 | 15 | 0.949 | 0.950 | 0.947 | 0.867 | 0.017 |
| pqsfinder (R package) | Default | 242 | 2 | 92 | 56 | 0.852 | 0.812 | 0.979 | 0.696 | 0.008 |
| pqsfinder (R package) | Score threshold: 25 | 291 | 7 | 87 | 7 | 0.964 | 0.977 | 0.926 | 0.902 | 0.023 |
| QGRS Mapper | Default | 274 | 17 | 77 | 24 | 0.895 | 0.919 | 0.819 | 0.721 | 0.058 |
| QGRS Mapper | Max length: 45; min G-group: 2; loop size: 0–36 nt, score threshold: 30 | 294 | 14 | 80 | 4 | 0.954 | 0.987 | 0.851 | 0.872 | 0.045 |
| Quadparser (G4L1–7) | Default (7-nt loops): ([gG]{3, }\w{1,7}){3, }[gG]{3, } | 196 | 2 | 92 | 102 | 0.735 | 0.658 | 0.979 | 0.543 | 0.010 |
| Quadparser (G4L1–12) | 12-nt loops: ([gG]{3, }\w{1,12}){3, }[gG]{3, } | 225 | 2 | 92 | 73 | 0.809 | 0.755 | 0.979 | 0.635 | 0.009 |
| Quadron | Default | 225 | 2 | 92 | 73 | 0.809 | 0.755 | 0.979 | 0.635 | 0.009 |
TP: true positives; FP: false positives; TN: true negatives; FN: false negatives; ACC: accuracy; SEN: sensitivity; SPE: specificity; MCC: Matthews Correlation Coefficient; FDR: False Discovery Rate
As shown in Table 4, none of the tools identified all the positive G4 sequences, the maximum number of true positives was obtained with G4Hunter (using a relaxed score threshold of 0.70, merely for performance on this limited benchmarking set) and QGRS Mapper (using the most relaxed parameters allowed by the web tool). On this small sequence set, Quadron performed just as Quadparser (allowing loops 1–12 nt), which is not surprising given that, at its current version, the machine learning model was trained on both Quadparser and G4-seq outputs and assesses quadruplex formation propensity for canonical sequence motifs with 12 nt maximum loop size only. All the scoring algorithms allowed to obtain significantly higher mean score values for G4 sequences than for noG4 sequences (pqsfinder: 63 versus 6; G4Hunter: 1.64 versus 0.15; QGRS: 65 versus 35 and; G4 Grinder: 51 versus 28; Figure 2A). This observation contributes to the validation of the scoring system, showing there is a significant association between the scores and the structures’ in vitro formation, and provides simple and intuitive values that can be used as score thresholds to dismiss sequences when these cut-offs are not specified in the tool's documentation (e.g. any sequence found by QGRS with a score < 35 could be considered as non-G4 forming). Finally, as already discussed, since the experimentally validated G4 dataset is unbalanced, the MCC metric is the most relevant performance assessment value. As seen in Table 4, pqsfinder outperformed all the other algorithms (MCC = 0.902) when setting a score threshold of 25 (however, by default, this cut-off is set at 52). Finally, when assessing primary sequence explorations using Quadparser, it appears that performing a search with extended loop sizes (1–12 nt, G4L1–12; MCC = 0.635) gives significantly better results than using the classical consensus motif (1–7 nt, G4L1–7; MCC = 0.543), consistent with an observation that had previously been empirically assessed (33).
ASSESSING QUADRUPLEX-FORMING POTENTIAL IN LOW-COMPLEXITY SEQUENCES
As previously mentioned, some DNA or RNA sequences can potentially form several overlapping G4 motifs, especially in G-rich low-complexity loci (such as CpG islands, simple di- or trinucleotide repeats) or in GC-rich promoters. In these particular cases, the definition of individual quadruplexes becomes uncertain, as regular expression matching algorithms typically fail to account for G4-richness in low-complexity regions and sliding window approaches tend to predict an excessive number of potential G4s for which individual boundaries are not well-defined. We can illustrate this issue with the concrete example of the promoter region of the BCL-2 gene, which contains a 39-bp GC-rich region upstream of the P1 promoter that can form mutually exclusive overlapping quadruplexes competing for common nucleotides in the sequence (102) (Figure 3A). We have run different prediction algorithms after extracting this sequence from the hg38 reference genome (Figure 3B), showing that Quadparser (regular expression matching) reports this region as G4-poor when using default settings (1–7 nt loops) and conversely, G4Hunter (sliding window) can report as many as 15-fold more potential G4s than the previous algorithm. To note, there are some discrepancies between the Python and the R implementations of the G4Hunter algorithm when dealing with overlapping windows: the R scripts were designed to identify G4 motifs with no intention to separate all the possible topological overlapping sequences but rather merge them into an unique sequence potentially able to form a quadruplex, whereas the Python program can output both the merged windows as well as overlapping motifs. Overall, it is useful to have tools that can both predict all overlapping occurrences and are designed to correct the final prediction outputs by associating them with scores. The QGRS Mapper algorithm allows to predict canonical overlapping motifs and assign scores to each occurrence by considering the number of Gs in each run and loop lengths (72). Similarly, the parameters of the pqsfinder tool can be tuned in order to report all overlapping G4s within a sequence and provide the overall density covering each position in the input sequence (73). When applying pqsfinder to the GC-rich region in the BCL-2 promoter (Figure 3B), it allowed to identify 23 overlapping G4 sequences, from which 9 had high assigned scores (>52), correlated with high propensity for G4 folding.
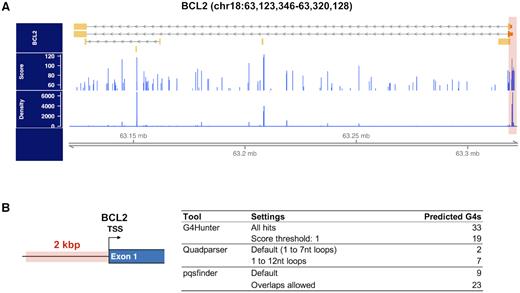
Dealing with overlapping quadruplex motifs in a GC-rich gene promoter. (A) From the upper to the lower track: BCL2 gene annotation (chr18:63 123 346–63 320 128 in the hg38 reference genome); distribution of all G4 motif prediction scores obtained with pqsfinder and; distribution of pqsfinder G4 motif prediction densities. Higher density values indicate low-complexity regions. (B) G4 sequence prediction in the 2 kb, high-density, BCL2 promoter region. The table shows the results obtained with three different prediction algorithms, Quadparser, G4Hunter (Python) and pqsfinder (R package).
IN SILICO AND IN VITRO EVALUATION OF G4 SEQUENCE CONTENT IN 12 SPECIES
Finally, we compared the G-quadruplex potential assessed by in silico predictions (using two different approaches, Quadparser and the G4Hunter Python implementation for processing speed) to the dataset obtained through the latest version of the G4-seq high-throughput detection method. Indeed, genome-wide G4-seq maps for 12 species were recently published (103), including genomes of diverse sizes and %GC contents (Table 5). We obtained the BED files corresponding to the observed quadruplexes for each of the species from the GEO repository accession GSE110582, in two experimental conditions: physiological K+ concentration and upon addition of a G4-stabilizing ligand (pyridostatin, PDS (104)). Importantly, it has been observed that the sensitivity of the G4-seq assay significantly increases under PDS G4-stabilizing conditions (the average assay sensitivity across the 12 species analysed shifts from 31% to 66%), as the ligand allows more putative quadruplexes to be identified (103). In addition, the average specificity is also enhanced in this condition (the average specificity shifts from 81% to 85%), which was explained by the more stringent threshold used for scoring upon PDS treatment, thus possibly limiting the amount of false positives (103).
Potential quadruplexes found in silico and in vitro through G4-seq
| Annotation (G4Hunter ∩ G4seq K+ + PDS, %)a | ||||||||||||||||
|---|---|---|---|---|---|---|---|---|---|---|---|---|---|---|---|---|
| Species | Reference | Size (Mb) | %GC | G4L1–12 | G4Hunter | G4seq K+ | G4seq K+ + PDS | 3′UTR | 5′UTR | TTS | Exon | Intron | Intergenic | Promoter | Repeatsb | LINE/SINE |
| Human | hg19 | 3095.69 | 37.8 | 722 226 | 2 890 423 | 434 272 | 1 376 425 | 1.4 | 0.5 | 2.0 | 2.1 | 29.6 | 21.7 | 4.7 | 5.4 | 17.8 |
| Mouse | mm10 | 2730.87 | 42.6 | 786 453 | 2 724 011 | 797 789 | 1 746 863 | 1.2 | 0.4 | 1.6 | 1.8 | 27.2 | 23.2 | 3.6 | 7.4 | 19.5 |
| Zebrafish | danRer10 | 1371.72 | 36.8 | 103 252 | 263 185 | 141 637 | 321 230 | 1.0 | 0.2 | 1.0 | 9.2 | 21.9 | 61.7 | 2.4 | 2.5 | 0.0 |
| D. melanogaster | dm6 | 143.73 | 42.1 | 24 804 | 110 024 | 19 399 | 55 263 | 1.4 | 0.8 | 7.7 | 9.1 | 39.4 | 21.6 | 10.7 | 8.2 | NA |
| C. elegans | ce11 | 100.29 | 35.4 | 4290 | 36 136 | 4144 | 10 776 | NA | NA | 17.2 | 6.0 | 12.2 | 10.5 | 37.3 | 3.8 | NA |
| S. cerevisiae | sacCer3 | 12.16 | 38.4 | 143 | 2 701 | 103 | 502 | NA | NA | 12.2 | 5.6 | 0.0 | 16.1 | 66.0 | 0.0 | NA |
| L. major | LmjFv6.1 | 32.86 | 59.6 | 16 988 | 100 569 | 17 343 | 36 941 | NA | NA | 20.0 | 10.5 | 0.0 | 20.4 | 34.1 | NA | NA |
| T. brucei | Tb927 | 35.83 | 46.8 | 3231 | 29 219 | 3 236 | 10 666 | NA | NA | 16.8 | 31.5 | NA | 7.5 | 42.4 | NA | NA |
| P. falciparum | Pfalciparum3D7 | 23.33 | 19.6 | 193 | 4341 | 173 | 326 | NA | NA | 4.1 | 11.1 | 0.5 | 76.3 | 8.1 | NA | NA |
| A. thaliana | TAIR10 | 119.67 | 36.1 | 2 849 | 25 786 | 2 407 | 11 953 | NA | NA | 16.7 | 42.3 | 2.2 | 11.9 | 26.2 | NA | NA |
| R. sphaeroides | ASM1290v2 | 4.64 | 68.8 | 1 990 | 10 107 | 47 | 2291 | NA | NA | 19.8 | 3.9 | NA | 0.1 | 76.2 | NA | NA |
| E. coli | ASM584v2 | 4.6 | 50.8 | 131 | 1701 | 291 | 5660 | NA | NA | 23.6 | 1.4 | NA | NA | 75.0 | NA | NA |
aPutative G4 sequences found by both G4Hunter and G4seq were annotated, results are shown as percentage (%) of motifs found in each category (NA, not applicable, indicates that a feature is not present in the annotation for the reference genome);
bThe ‘Repeats’ category includes regions annotated as low-complexity, simple repeats and CpG islands.
The total number of putative G4s found by each of the methods is summarized in Table 5. Provided that a reasonable G4Hunter score threshold is chosen (1.2 in this case, value below which the accuracy of the predictions drops considerably), the number of hits found at the genome-wide level is systematically higher using this sliding window method than the number found using the extended regular expression matching approach (G4L1–12). Nevertheless, when setting a more stringent 1.5 score threshold for G4Hunter, the number of putative quadruplexes found is comparable (e.g. 646,802 sequences found in hg19). Similarly, when sequencing was performed in K++PDS experimental conditions, the numbers of potential quadruplexes found in vitro using the G4-seq method are systematically higher than those predicted by primary sequence; moreover, these values are frequently similar to those predicted by G4Hunter (Table 5).
Next, in order to assess the matches between the different predictions, we annotated and intersected (by genomic coordinates) each of the difference datasets (Figure 4 and Supplementary Figure S1, Table 5). Genomic feature association analysis was performed with the HOMER software package (105). Briefly, for any given motif, we first determined its distance to the nearest transcription start site (TSS) and assigned the motif to that gene; then, we determined the genomic annotation of the region occupied by the centre of the motif to assign an annotation category. For each of the 12 species, we observe similar annotation categories and large overlaps between the sets (significant three-way overlaps, hypergeometric test P < 0.05). However, we have consistently predicted larger numbers of putative G4s using G4Hunter (especially when compared to G4L1-12 predictions and G4-seq in the K+ condition).
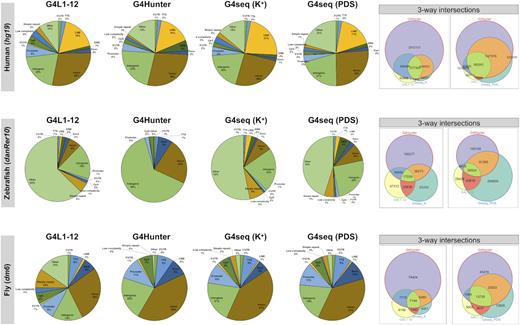
Genomic distribution of G-quadruplex sequences found using different prediction methods. G4 sequences predicted by three different approaches (G4L1–12: regular expression matching G3–5N1−12G3–5N1−12G3–5N1−12 G3–5, G4Hunter: sliding window and scoring, and G4-seq: high-throughput in vitro detection) were annotated. Genomic features were obtained from the respective annotation files in the three species shown. The three-way overlaps between the different datasets are represented as weighted Venn diagrams (with area-proportional circles or faces for clarity).
Indeed, many G4 sequences were found in intergenic, LINE/SINE and repetitive regions (especially in the human, mouse and zebrafish genomes) but in similar proportions to the other tools, suggesting this could be attributed to lower resolution and excessive hits in low-complexity regions (as discussed in the ‘Assessing quadruplex-forming potential in low-complexity sequences’ section). Nevertheless, we have also observed higher overlaps between the G4Hunter predictions and G4-seq results in the K++PDS condition (rightmost panels, Figure 4 and Supplementary Figure S1), which could be indicative of larger numbers of detected non-canonical G4s, which would not be picked-up by Quadparser and would possibly be less stable in K+ (for instance, if G-triads involved). Overall, this observation supports the view according to which the number of G4-folding potential sites within the human genome needs to be significantly revised upwards compared to widely described figure of ∼375 000 PQS and points to the importance of further including and studying non-canonical sequences.
Finally, we have specifically annotated the sequences obtained through the G4-seq method exclusively (i.e. no overlaps with either G4Hunter nor Quadparser), in an attempt to identify sequencing artefacts. For this analysis, we decided to use the most comprehensive annotation files, namely those of the hg19 (human), mm10 (mouse), danRer10 (zebrafish) and dm6 (Drosophila melanogaster) reference assemblies (values for the Caenorhabditis elegans and Leishmania major reference genomes are shown in Supplementary Figure S2). Furthermore, genomic feature enrichment was calculated against the whole-genome background, by considering the total size (base pairs covered) of a given feature in a reference genome and the total size of G4 motifs overlapping this feature (Figure 5, Supplementary Figure S2). Interestingly, we observe an accumulation (log2(enrichment) > 1, permutations test P-value < 0.01) of putative quadruplex sequences located in simple repeats, which were not present in the locations identified by both G4Hunter and G4-seq (Figure 5). Moreover, G4s identified by G4-seq exclusively are less frequent in ‘unique’ regions such as 3′ and 5′UTRs or promoters, genomic features that were found to be enriched for quadruplexes assessed by both this high-throughput method and in silico prediction. This phenomenon could be linked with a limitation discussed by the authors of the G4-seq method, which is the lack of coverage and the assembly problems in GC-rich areas of the genome (79,103) (partly corrected in the latest version of the method), leading to low resolution in individual quadruplex identification in these regions.
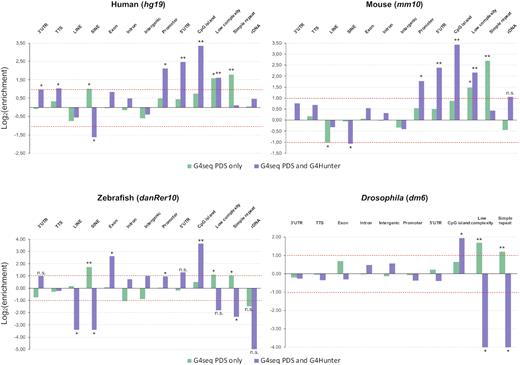
Annotation of G-quadruplex sequences found exclusively by G4-seq. The annotations of G4 sequences found exclusively (i.e. no overlaps between the sets) in vitro using the G4-seq method (green) were compared to those of the motifs predicted by both the G4Hunter algorithm and G4-seq (purple). Genomic features were obtained from the respective annotation files in the four species shown and are reported on the x-axes. Log2(enrichment) for each of the assessed features is reported on the y-axes. Permutation tests (n = 100 permutations) were performed to assess the significance of the associations; **P-value < 0.01 and |local z-score| > 10; *P-value < 0.05 and |local z-score| > 10.
CONCLUDING REMARKS
All computational G-quadruplex prediction approaches have their drawbacks and limitations despite the recent advances in the field and the introduction of validation steps based on experimental data. For the first group of algorithms, based on regular expression matching, accounting for variability is heavily restricted, i.e. only the same kind of structures can be looked for, which generally excludes non-canonical quadruplexes (sequences with more than four G-runs, long loop lengths or G-triads). For machine learning methods, the current limitations mostly rely on the quality and quantity of the available training datasets: for instance, for G4 RNA, training datasets are comprised of only 149 confirmed G4 folding sequences (and 179 confirmed non-G4 sequences) and most of the most recent experimental data is only available for the human genome (rG4-seq (95)), although the Balasubramnian group has recently published G4-seq maps for 12 species (103). Another difficulty could be associated to the quality of the reference genome used for G4-potential evaluation: the assemblies present in large databases such as Ensembl (106) or UCSC Genomes (107) are carefully curated. However, in most references, long runs of repetitive sequences (minisatellites, CpG islands, low complexity mono- or dinucleotide repeats) are missing or arbitrarily truncated, as they are particularly difficult to assemble, which might lead to an underestimation of the genome-wide PQS content particularly. To finish, most of the prediction tools cited in this review have not been explicitly designed to account for higher-order sequences formed by several quadruplex subunits. In particular, much attention has been drawn to the human telomere sequence higher-order assembly, which is one of the main focuses of this new line of exploration (108–111). Currently, two algorithms are designed to predict higher-order, or multimeric, quadruplex structures: G4-iM Grinder, also intended as a tool for i-motif identification (98); and QPARSE, a tool specifically developed for the prediction of both multimeric quadruplex structures and G4s with long, hairpin loops (113).
SUPPLEMENTARY DATA
Supplementary Data are available at NAR Online.
FUNDING
PIC3i program from Institut Curie [91730 ‘Prospects of Anticancer’]; E.P.L. is a recipient of a doctoral fellowship from the French Ministry of Education, Research and Technology. Funding for open access charge: Author’s host department.
Conflict of interest statement. None declared.
Notes
Present address: Emilia Puig Lombardi, Genome Stability and Tumourigenesis Group, The CR-UK/MRC Oxford Institute for Radiation Oncology, Department of Oncology, University of Oxford, Old Road Campus Research Building, Oxford, OX3 7DQ, UK

Comments