


Skip to results
Advanced search
NARROW
1-20 of 217971

Journal Article
MutationExplorer : a webserver for mutation of proteins and 3D visualization of energetic impacts
Nucleic Acids Research, gkae301, https://doi.org/10.1093/nar/gkae301
Published: 22 April 2024
Journal Article
Comprehensive genomic features indicative for Notch responsiveness
Nucleic Acids Research, gkae292, https://doi.org/10.1093/nar/gkae292
Published: 22 April 2024
Journal Article
High-density generation of spatial transcriptomics with STAGE
Nucleic Acids Research, gkae294, https://doi.org/10.1093/nar/gkae294
Published: 22 April 2024
Journal Article
admetSAR3.0: a comprehensive platform for exploration, prediction and optimization of chemical ADMET properties
Nucleic Acids Research, gkae298, https://doi.org/10.1093/nar/gkae298
Published: 22 April 2024
Image
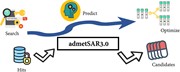
Graphical Abstract
in
Nucleic Acids Research
>
admetSAR3.0: a comprehensive platform for exploration, prediction and optimization of chemical ADMET properties
Published: 22 April 2024
Graphical Abstract
Graphical Abstract
Image
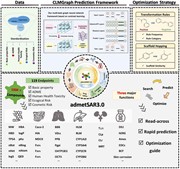
An overview of the new developments in admetSAR3.0.
in
Nucleic Acids Research
>
admetSAR3.0: a comprehensive platform for exploration, prediction and optimization of chemical ADMET properties
Published: 22 April 2024
Figure 1.
An overview of the new developments in admetSAR3.0.
Image
STAGE enables robust cell type prediction and tissue domain segmentation in...
Published: 22 April 2024
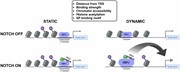
Figure 5.
STAGE enables robust cell type prediction and tissue domain segmentation in human breast cancer tissue section 1. ( A ) Histology image of the human breast cancer tissue section 1. ( B ) Boxplot showing Pearson correlations between the raw and recovered data by STAGE, HisToGene, DeepSpaCE and ST-Net
Image
Dynamic RBPJ sites represent distal enhancers. ( A ) Distance of all, stati...
Published: 22 April 2024
Figure 2.
Dynamic RBPJ sites represent distal enhancers. ( A ) Distance of all, static and dynamic RBPJ sites to the next transcription starting site (TSS). The figure includes the genomic background distribution (random). (B–E) Beko cells were analyzed by ATAC-Seq and ChIP-Seq to characterize the chromatin l
Image
Notch responsiveness is preferentially associated with dynamic RBPJ sites i...
Published: 22 April 2024
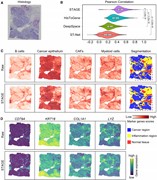
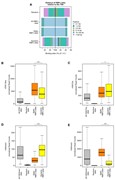
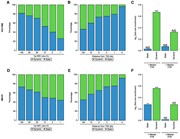
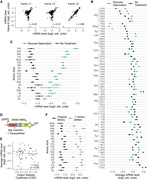
Figure 5.
Notch responsiveness is preferentially associated with dynamic RBPJ sites in triple negative breast cancer (TNBC). Publicly available ChIP-Seq and RNA-Seq data were analyzed to investigate Notch responsiveness in HCC1599 ( A–C ) and MB157 ( D–F ) triple negative breast cancer (TNBC) cells. (A and D)
Image
Application case: Using an example compound ‘methandrostenolone’ (withdrawn...
Published: 22 April 2024
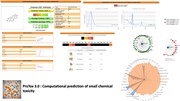
Figure 1.
Application case: Using an example compound ‘methandrostenolone’ (withdrawn drug).
Image
Graphical Abstract
in
Nucleic Acids Research
>
MutationExplorer : a webserver for mutation of proteins and 3D visualization of energetic impacts
Published: 22 April 2024
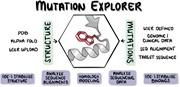
Graphical Abstract
Graphical Abstract
Image
mRNA effects of dipeptide repeats require in-frame translation. ( A ) mRNA ...
in
Nucleic Acids Research
>
Massively parallel identification of sequence motifs triggering ribosome-associated mRNA quality control
Published: 22 April 2024
Figure 3.
mRNA effects of dipeptide repeats require in-frame translation. ( A ) mRNA level of reporters encoding 320 different dipeptide repeats (excluding stop codon-containing dipeptides and pairs that did not pass read count cutoffs) compared between the correct reading frame (frame 0, vertical axis) and c
Image
Deep mutational scanning identifies amino acids critical for mRNA effects o...
in
Nucleic Acids Research
>
Massively parallel identification of sequence motifs triggering ribosome-associated mRNA quality control
Published: 22 April 2024
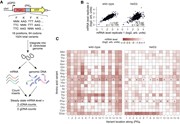
Figure 5.
Deep mutational scanning identifies amino acids critical for mRNA effects of a destabilizing dipeptide repeat. ( A ) Schematic of deep mutational scanning (DMS) of the FK dipeptide repeat. Each location in an (FK) 8 -encoding insert was randomized to all 64 codons. This 1024-variant library was clon
Image
SifiNet pipeline. SifiNet takes the preprocessed feature count matrix as in...
in
Nucleic Acids Research
>
SifiNet: a robust and accurate method to identify feature gene sets and annotate cells
Published: 22 April 2024
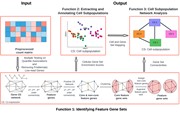
Figure 1.
SifiNet pipeline. SifiNet takes the preprocessed feature count matrix as input, and uses gene co-expression network topology to identify feature gene sets (function 1). The identified feature gene sets are used to annotate cells (function 2), and the gene co-expression network is also used to reveal
Image
(A, B) Performance comparison between SifiNet and competing methods on SD1 ...
in
Nucleic Acids Research
>
SifiNet: a robust and accurate method to identify feature gene sets and annotate cells
Published: 22 April 2024
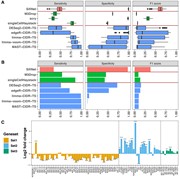
Figure 2.
(A, B) Performance comparison between SifiNet and competing methods on SD1 and Monoclonal. Sensitivity, specificity, and F1 accuracy scores of three types of methods: SifiNet (red), HVG methods (green) and two-step methods (blue). ( A ) Performance on SD1, a simulated dataset with 100 replications.
Image
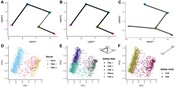
(A–C) UMAPs of SD2, with ( A ) the SifiNet-built lineage, ( B ) the true ce...
in
Nucleic Acids Research
>
SifiNet: a robust and accurate method to identify feature gene sets and annotate cells
Published: 22 April 2024
Figure 4.
(A–C) UMAPs of SD2, with ( A ) the SifiNet-built lineage, ( B ) the true cell subpopulation lineage and ( C ) the Monocle3-built lineage. (D–F) Cellular GSVA score PC plots for CD8. The x- and y-axis are PC directions of the GSVA scores based on the SifiNet-derived gene sets using scRNA-seq and scAT
Image
Genome-wide screening for methylation barriers and sequence signatures. ( A...
in
Nucleic Acids Research
>
Genome-wide screening and functional validation of methylation barriers near promoters
Published: 22 April 2024
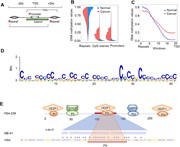
Figure 1.
Genome-wide screening for methylation barriers and sequence signatures. ( A ) Schematic illustration of two PIR trios in a ±2 kbps TSS-flanking region. Each trio comprises a promoter, a CpG island (CGI), and a repeat. ( B ) Split violin plots show distribution of methylation levels by location (repe
Image
Reproducible dmPIRs. ( A ) Transition of methylation level in regions tagge...
in
Nucleic Acids Research
>
Genome-wide screening and functional validation of methylation barriers near promoters
Published: 22 April 2024
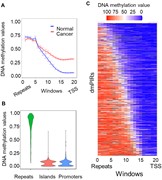
Figure 2.
Reproducible dmPIRs. ( A ) Transition of methylation level in regions tagged by the 620 dmPIRs reproduced in the RRBS data set. ( B ) Violin plots show methylation in the 2171 dmPIRs reproduced in the ENCODE normal samples. ( C ) Heatmap shows transition from high methylation level in repeats to low
Image
Experimental validation of the methylation pattern around the P16 ...
in
Nucleic Acids Research
>
Genome-wide screening and functional validation of methylation barriers near promoters
Published: 22 April 2024
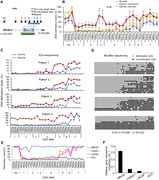
Figure 4.
Experimental validation of the methylation pattern around the P16 TSS in patient samples and cell lines. ( A ) Eight loci (red boxes, Alu and site1∼site7) in this region selected for targeted bisulfite-pyrosequencing. Bisulfite TA cloning and sequencing was performed to identify accurate methylati
