


Abstract
The identification of human cancer-related microRNAs (miRNAs) is important for cancer biology research. Although several identification methods have achieved remarkable success, they have overlooked the functional information associated with miRNAs. We present a computational framework that can be used to prioritize human cancer miRNAs by measuring the association between cancer and miRNAs based on the functional consistency score (FCS) of the miRNA target genes and the cancer-related genes. This approach proved successful in identifying the validated cancer miRNAs for 11 common human cancers with area under ROC curve (AUC) ranging from 71.15% to 96.36%. The FCS method had a significant advantage over miRNA differential expression analysis when identifying cancer-related miRNAs with a fine regulatory mechanism, such as miR-27a in colorectal cancer. Furthermore, a case study examining thyroid cancer showed that the FCS method can uncover novel cancer-related miRNAs such as miR-27a/b, which were showed significantly upregulated in thyroid cancer samples by qRT-PCR analysis. Our method can be used on a web-based server, CMP (cancer miRNA prioritization) and is freely accessible at http://bioinfo.hrbmu.edu.cn/CMP . This time- and cost-effective computational framework can be a valuable complement to experimental studies and can assist with future studies of miRNA involvement in the pathogenesis of cancers.
INTRODUCTION
MicroRNAs (MiRNAs) are small, non-coding RNA molecules encoded in the genomes of animals. They are important regulators of cell differentiation, proliferation/growth, mobility and apoptosis in diverse cancer-related biological processes ( 1–4 ). Accumulating evidence suggests that the over-expression of several miRNAs increases tumor formation; however, other miRNAs are consistently detected at very low levels in tumors and may have tumor-suppressive effects ( 5–8 ). The identification of miRNAs linked to cancer susceptibility is useful for cancer diagnosis, prognosis, treatment and drug target discovery ( 9–11 ).
Experimental methods have been used to identify the relationship between cancers and miRNAs; methods such as microarray profiling and qRT-PCR have achieved remarkable success. Microarray profiling is a high-throughput technique that can be used to systematically detect the differential expression of miRNAs in cancer and control samples ( 12–15 ). However, the different melting temperatures of short-length miRNAs and the high sequence consistency between miRNA family members can lead to false positive microarray results; in addition, the probe design increases the cost of this technique ( 16–18 ). Therefore, the development of computational methods that use the abundant ‘omics’ data sets of miRNAs to assess their relationship with specific cancers is a valuable complement to experimental studies.
Following the recognition of the crucial regulatory functions of miRNAs, computational methods of identifying cancer-related miRNAs have been widely applied to cancer research as a powerful supplement to experimental methods. Computational methods are mostly based on the expression pattern of miRNAs in cancer ( 19 , 20 ) or on the regulatory effects of miRNAs on cancer susceptibility genes or protein products through pathways or functional modules ( 21–23 ). However, factors such as false positive miRNA targets, imperfect cancer miRNA profiles and miRNA interaction or coregulation cascades may reduce the efficiency of miRNA analysis. These studies suggest that it is useful to systematically prioritize potentially cancer-related miRNAs during experimental research.
Genes associated with the same or similar disorders will share common cellular and functional characteristics ( 24 , 25 ). The annotations in Gene Ontology (GO) reveal this functional similarity. Likewise, if miRNAs are associated with a similar regulatory pattern in the same type of cancer, their target genes may share common functional characteristics ( 26 ). Therefore, if miRNAs are associated with a cancer, the miRNA targets must have the same or a similar function as the cancer-related genes. We present a novel method for quantifying and prioritizing miRNAs related to specific cancers by using the functional consistency between miRNA target genes and cancer-related genes. This method is based on the functional consistency score (FCS), which is calculated by the semantic similarity measurement in the context of functional categories. Various applications of semantic similarity have been used for biomedical ontology ( 27 , 28 ) such as GO ( 29 ), Disease Ontology (DO) ( 30 ) and Human Phenotype Ontology (HPO) ( 31 ). These have been demonstrated to be powerful tools for validating biomedical results and for exploring the molecular mechanisms of human disease ( 32 ), including gene classification, gene function prediction, disease gene inference and phenotype analysis of human disease. In this article, a higher FCS revealed a high functional consistency or closer relationship between the miRNA and the cancer. We applied our method to 11 common human cancers and ranked all of the candidate miRNAs according to FCS. Our method had a significant advantage over miRNA differential expression analysis in the identification of cancer-related miRNAs with fine regulatory mechanisms. This method can be a valuable complement to experimental studies used in future studies of miRNA involvement in the pathogenesis of cancer.
MATERIALS AND METHODS
GOterm enrichment analysis
A gene product annotated on GO might be associated with or located in one or more cellular compartments (components). It is active in one or more biological processes, during which it performs one or more molecular functions. Mutant phenotypes often reflect disruptions in biological processes. Fisher's exact test was used for statistical and enrichment analysis of the GO biological process categories. The miRNA target genes and cancer genes were significantly annotated and the threshold of Fisher's P -value was selected to be 0.05. The GO annotation definitions were imported from the January 2010 monthly release ( http://archive.geneontology.org/full/2010-01-01/ ). We implemented our analysis procedure in the Biological Process categories with all annotations (including IEA annotations).
MiRNA target gene sets and human cancer gene set
To minimize the false positives resulting from the computational prediction of miRNA targets and to build a high-confidence resource for miRNA target analysis, the strategy of integrate several miRNA target prediction programs has been widely used ( 33–35 ). We chose miRNA targets from the widely used target prediction programs miRanda, PicTar4 and TargetScan. Only target genes predicted by at least two of the programs were accepted. This miRNA target integrating method had been used before ( 36 ). We obtained a compiled miRNA–mRNA data set containing 244 miRNAs and 43 558 miRNA target pairs. All of the integrated miRNA target gene sets (MFCs) and the human common cancer-related miRNA database can be downloaded from the ‘ Supplementary Data ’ or from http://bioinfo.hrbmu.edu.cn/CMP .
The specific human cancer genes were downloaded from the National Cancer Institute (NCI) with a unique disease EVS ID. In this article, we only selected cancer genes with evidence ID of EV-EXP-IDA, which means they have been investigated and validated by direct experiments. These data sets can be downloaded from the ‘ Supplementary Data ’ or from http://bioinfo.hrbmu.edu.cn/CMP .
Calculating the FCS between miRNA and cancer

 is the number of genes annotated in category
  and its direct or indirect offspring is divided by the number of annotations in the GO domain.
 represents the set of most informative common ancestor categories of
  and
and  .
. 
The first equation describes how to measure the information content of a category. The second and third equations describe how to calculate the semantic similarity between two categories. The fourth equation describes the strategy for integrating the similarity between categories to quantify the functional consistency of two gene sets by the best-match average method. The semantic similarity score between two gene sets is the average of the best-fit column score and the best-fit row score ( 37 ).
Our new approach took advantage of the term measurement of Lin's ( 38 ), and a detailed procedure chart is shown in Figure 1 . We chose Lin 's method because of its superiority in its normalized outputs. We used Lin's semantic similarity measurement to calculate the functional consistency between miRNAs and cancer. The final FCS scores are distributed from 0 to 1 (  ). These normalized outputs facilitate users to identify and prioritize the direct association between a candidate miRNA and cancer. Furthermore, we cited other semantic similarity measurements of SimGIC ( 39 ), Resnik's and Jiang's, which had already proven to be effective in GO, and compare the efficiency of these measurements. We calculated FCSs between miRNA targets and colorectal cancer genes using SimGIC, Lin's, Resnik's and Jiang's, respectively. The performance of recalling known cancer miRNAs and correlation with differential expression analysis are summarized in Sheet 1 of Supplementary Table S3 , more detailed information is also listed in other sheets of Supplementary Table S3 .
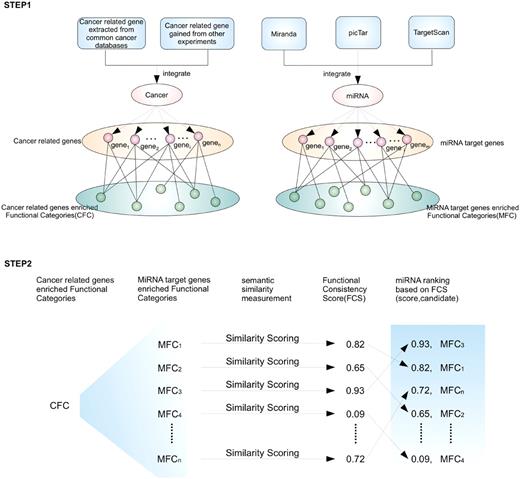
If an miRNA is involved in a specific cancer, the miRNA target genes and the cancer-related genes would be associated with the same or similar functions. The FCS can be used to quantify the association between miRNAs and a specific cancer. In the first step (STEP 1), cancer-related genes are obtained from several cancer databases or experimental results. Next, functional enrichment analyses based on GO are performed on a CFC and an MFC, and the significantly enriched functional categories of the CFC and MFC are obtained. In the second step (STEP 2), for the i th miRNA, an FCS is calculated between MFC i and CFC using a semantic similarity measurement. FCSs can be determined for all the candidate miRNAs. Higher FCS values reflect a closer relationship with the cancer.
A compendium of validated cancer-related miRNAs
Rigorous evaluation of a prediction method requires a ‘gold standard’. In this study, we used a set of validated miRNAs with known functions related to a certain cancer type. For each cancer type, the cancer-related miRNAs were drawn from the mir2Disease database ( http://www.miR2Disease.org ), which contains a compilation of disease-related miRNAs identified by experiment-based studies ( 40 ).
Evaluation of miRNA expression patterns
The corresponding miRNA expression profile GSE10259 with 281 human miRNAs was downloaded from GEO. This profile contained 66 samples from 49 colorectal cancer patients and one normal control; 59 of these 66 samples were cancer samples and 7 were normal samples. A Student's t -test was used to identify the differentially expressed miRNAs between the cancer and control samples in the microarray ( 10 , 15 ), and then each miRNA was given a significant differential P -value. The resulting list of 281 miRNAs was sorted according to P -value. Seventy miRNAs were considered to be significantly differentially expressed and had P -values lower than a threshold of 0.01.
Cell lines and tissue samples
Human colorectal cancer cell lines SW1116, SW620, HCT116, HT29 and LOVO were originally obtained from the American Type Culture Collection. The cells were maintained in Dulbecco's Modified Eagle Medium (Hyclone, USA) with 10% heat-inactivated fetal bovine serum (Hyclone) and 1% penicillin/streptomycin in a 37°C and 5% CO 2 atmosphere.
The tissue samples were collected at surgery from patients who suffered from either colorectal adenocarcinoma cancer (T2N0M0 and T4N0M0) or papillary adenocarcinoma of the thyroid. Tumor tissue (0.5 × 0.5 × 0.5 cm) and normal tissue counterparts were collected as a pair from each patient, immediately flash-frozen in liquid nitrogen, and stored at −80°C. Peripheral blood mononuclear cells (PBMCs) obtained from healthy men and women were used as controls to compare selected miRNA expression with the cancer cell lines. The study was approved by the local ethics committee.
RNA isolation and quantitative real-time PCR
Total RNA was extracted from 1 × 10 5 cells or 0.08 g of the tissue sample with a MirVanaTM miRNA Isolation kit. Next, 0.8 µg of the RNA was reverse transcribed into cDNA with a TaqMan MiRNA Reverse Transcription kit according to the manufacturer's instructions. Then, 20 µl of the real-time PCR reaction was set up with validated TaqMan probes and specific primers including hsa-miR-20a, hsa-miR-20b, hsa-miR-27a, hsa-miR-27b, hsa-miR-106b and snRNA U6 for each miRNA. The reactions were incubated in the ABI STEPONE Real-Time PCR System (Applied Biosystems, Foster City, USA). The real-time PCR reactions were performed in duplicate and repeated three times. The threshold cycle ( Ct ) value was determined by the default settings. An snRNA U6 was used as an endogenous control. We calculated the relative expression of each selected miRNA (as the fold change) in a cancer cell line or tumor tissue and compared this expression to that in the PBMCs of healthy controls or relevant normal tissue counterparts with the  method ( 41 ). All reagents and specific primers for each miRNA were obtained from Applied Biosystems (Foster City, USA) unless otherwise indicated.
RESULTS AND DISCUSSION
The FCS procedure
Previous studies have revealed that genes associated with the same or similar disorders may participate in the same cellular pathways, molecular complexes, or functional ontologies ( 24 , 25 ). Within a specific cancer type, if miRNAs are associated with a similar regulatory pattern, their target genes may share common functional characteristics ( 22 , 26 ). We assumed that if a miRNA is involved in a specific cancer, the miRNA target genes and the cancer-related genes would be associated with the same or similar functions. Based on this assumption, we used the FCS of the miRNA target genes and cancer-related genes to quantify the association between miRNAs and a specific cancer. We calculated the FCS by using the large-scale gene product functional annotation dataset and classic semantic similarity measurements. The detailed steps are shown in the ‘Materials and Methods’ section and Figure 1 . Our method can be used on the web-based server CMP (cancer miRNA prioritization), which is freely accessible at http://bioinfo.hrbmu.edu.cn/CMP .
Performance of FCS
To assess whether the FCS method reflects a biological relationship between miRNAs and cancer, we performed a validation with the known cancer miRNAs obtained from experimental data sets (see ‘Materials and Methods’ section). For a specific human cancer, each of the known miRNAs was taken as one test case. For each test case, we generated 99 negative controls, and each of the negative controls had the same target gene set size as the test case. Next, we calculated the FCSs of the case miRNA and the negative controls; we then ranked the case miRNA together with the negative controls. When the known cancer miRNA is prioritized as top 1, the empirical P < 0.01, which is widely accepted as a strict significant level. A similar performance method has been used before ( 42 ).
According to the 100 randomization, we examined whether known cancer miRNAs can be prioritized as top 1 to produce an ROC curve. We tested 11 human cancers and 655 miRNA–cancer associations. The highest area under ROC curve (AUC) value of 96.36% was obtained with lymphoma cancer, and the lowest AUC of 71.15% was obtained with thyroid cancer. We conducted another performance analysis and generated 999 negative controls for each test case. Then, we examined whether known cancer–miRNA can be prioritized as top 10. The AUC results of both the 100 randomization and 1000 randomization are shown in Supplementary Table S1 . The results suggest that our FCS method can successfully recover known miRNA–cancer associations ( Figure 2 ).
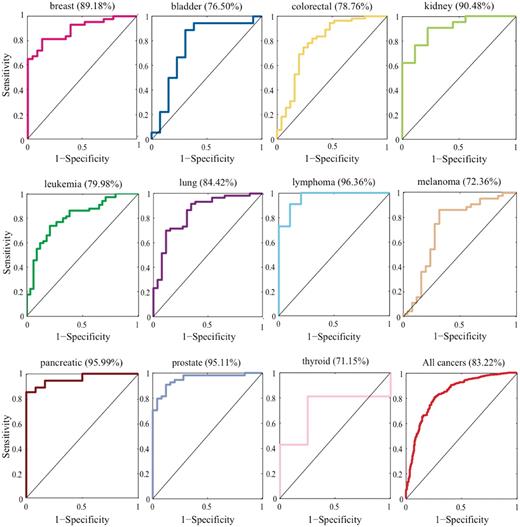
AUC analysis of known cancer miRNAs predicted at top 1. These figures showed 1-specificity versus sensitivity when considering the miRNAs predicted at top 1 varied with the FCS threshold.
For each cancer, we tested the recall rate by analyzing the top-ranked list. If the known cancer miRNA was ranked in the top 10, the prediction was considered to be successful. The performance precision is defined as the recall rate of the top 10. Supplementary Table S1 lists all of the recall numbers of these 11 cancer miRNAs.
FCS versus miRNA differential expression analysis
To further demonstrate the advantage of the FCS method in identifying cancer miRNAs, we compared the colorectal cancer miRNA ranked lists from the FCS and differential expression analyses (DEA). The differential expression values of colorectal cancer genes were calculated using Student's t -test. Each gene was given a significant P -value and ranked by –log( P )-value. The overlap of these two lists included 216 miRNAs, and the resulting list of 244 miRNAs sorted by FCS is shown in Supplementary Table S2 . We then calculated the correlation coefficient between the FCS scored list and the –log( P )-value list by DEA. We observed that miRNAs with higher FCS values tended to have lower P -values, and the correlation coefficient between the FCS and DEA was 0.1835, with a significance level of P < 0.0069 ( Supplementary Table S2 ). In particular, among the top 10 miRNAs with the highest FCSs ( Table 1 ), 7 miRNAs were already experimentally verified and the other 3 miRNAs were prioritized as candidate colorectal cancer miRNAs. Six of the seven known cancer miRNAs were significantly and differentially expressed with P < 0.001. In addition, hsa-miR-20b, which was not a known cancer miRNA, had a very high functional consistency with colorectal cancer (FCS = 0.83062) and was significantly downregulated with an average of  < 0.047 in five colorectal cancer cell lines as determined by qRT-PCR ( Supplementary Table S3 ). This method has a high prediction coincidence with the expression profile analysis, and the high differentially expressed miRNAs tend to be prioritized at the top of the FCS list.
FCS ranked list of the top 10 candidate colorectal cancer miRNAs
| miRNA | FCS | Rank with FCS | P -value of DEA |
|---|---|---|---|
| hsa-miR-20a | 0.84500 | 1 | 8.59E–07 |
| hsa-miR-106b | 0.84499 | 2 | 1.69E–08 |
| hsa-miR-27a | 0.84334 | 3 | 1.80E–01 |
| hsa-miR-27b | 0.84222 | 4 | 8.44E–03 |
| hsa-miR-20b | 0.83062 | 5 | NA |
| hsa-miR-17-5p | 0.83058 | 6 | 1.27E–10 |
| hsa-miR-128a | 0.83007 | 7 | 3.67E–01 |
| hsa-miR-141 | 0.81952 | 8 | 6.02E–04 |
| hsa-miR-153 | 0.81644 | 9 | 2.89E–01 |
| hsa-miR-30a-5p | 0.81204 | 10 | 2.29E–05 |
Previous studies have revealed that miRNAs may act as fine-tuning regulators and that subtle changes in miRNA expression can regulate gene functions ( 43 , 44 ). These important deregulating cancer miRNAs may be neglected by DEA. For example, hsa-miR-27a, which is known to be an oncogenic regulator in colorectal cancer cells, is a target for the anticancer agent CDODA-Me and regulates the zinc-finger protein ZBTB10 and the oncogenic protein Sp1. However, we discovered subtle differential expression by microarray analysis ( P > 0.1) and a non-significant differential expression pattern by qRT-PCR analysis in five colorectal cancer cell lines with an average  > 0.79 ( Supplementary Table S3 ). In this case, hsa-miR-27a is neglected by DEA but can be prioritized by the high FCS of 0.84334. Enrichment analysis reviewed that FCS better distinguished cancer miRNAs and non-cancer miRNAs in different significant intervals, especially P > 0.0001 ( Figure 3 ). Therefore, the FCS method was more efficient than DEA in identifying cancer-related miRNAs with a fine regulatory mechanism.
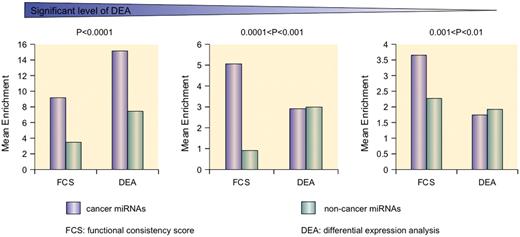
Different distributions of expression significance and FCS values between cancer miRNAs and non-cancer miRNAs. The formula is enrichment = 108/(rank) for an interval of 216 miRNAs. The mean enrichment reflects the position of the cancer miRNAs in the prioritized list. FCS can distinguish cancer miRNAs and non-cancer miRNAs where cancer miRNAs are always enriched at the top positions at different expression significant levels. By contrast, expression analysis confused these two types of miRNAs.
Case study: thyroid cancer
To demonstrate the ability of FCS to uncover known cancer miRNAs and predict novel susceptibility candidates, we present a case study of thyroid cancer. Thyroid cancer mostly originates from the epidermal cells of thyroid follicles and is one of the few malignancies that is increasing in incidence ( 45 , 46 ). Many researchers have demonstrated that miRNAs play an important role in thyroid cancers. Here, we provide a comprehensive prediction of new thyroid cancer-related miRNAs.
First, we extracted 350 thyroid cancer-related genes from NCI ( http://www.cancer.gov/ ) (see ‘Materials and Methods’ section). Next, we calculated the FCSs of 244 candidate miRNAs with thyroid cancer genes, and compared the known thyroid cancer miRNAs with the unknown cancer miRNAs in the FCS-ranked list.
We discovered that 10% of the known thyroid cancer miRNAs have FCS values >0.8, and 83.33% of the known thyroid cancer miRNAs have FCS values > 0.7 ( Figure 4 ). The distribution of FCSs between thyroid cancer miRNAs and unknown cancer miRNAs is significantly different ( P < 3.24e–005 on the Kruskal–Wallis test).
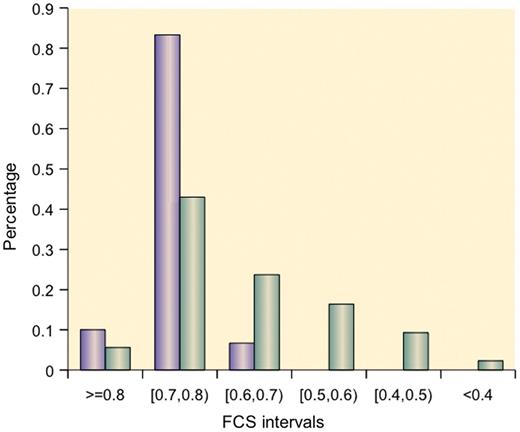
Distributions of FCSs of thyroid cancer miRNAs and other miRNAs (93.3% of known thyroid cancer miRNAs have FCSs > 0.70).
The top 10 miRNAs in the FCS ranked list included miR-20a/b, miR-106b, miR-27a/b and miR-30c/e-5p, and these miRNAs were predicted to be novel thyroid cancer miRNAs ( Table 2 ). Among these novel miRNAs, some proto-oncogenic miRNAs such as miR-20a and miR-17-5p are members of the miR-17-92 intronic miRNA cluster on chr13. Moreover, miR-106b is a member of the miR-106b-25 cluster. The miR-17-92 cluster plays an oncogenic role in anaplastic thyroid cancer cells ( 47 ). Previous research revealed that the transforming growth factor-beta (TGFβ) tumor suppressor pathway is under the inactivation control of the miR-106b-25/miR-17-92 clusters; this pathway plays a major role in the development of a variety of human tumors ( 48 , 49 ). For the same derived transcript, the oncogenic properties of the host gene MCM7 could be linked to the host miR-106b-25 cluster, and members of the miR-106b family have a crucial effect on the cell-cycle progression by regulating P21/CDKN1A ( 50 , 51 ). We also evaluated the expression level of miR-27a and miR-27b in thyroid cancer by conducting qRT-PCR experiments in two cancer samples. The fold changes were calculated by the  method; miR-27a and miR-27b showed a significant upregulated expression pattern in thyroid cancer tissues with average
  values of 2.20 and 2.15 ( Supplementary Table S3 ), respectively. These results demonstrate that the method described in this article is powerful not only in capturing known cancer miRNAs but also in prioritizing novel cancer miRNAs not yet detected by other methods.
The top 10 prioritized thyroid cancer miRNAs in the FCS ranked list
| miRNA | FCS | Functional description | References |
|---|---|---|---|
| hsa-miR-20a a | 0.85164 | B-cell lymphoma, breast cancer, CML, HCC, lung cancer, medulloblastoma, pulmonary hypertension | Inomata M, et al. ( 52 ),Yu Z, et al. ( 53 ), Venturinin L, et al. ( 54 ), Connolly E, et al. ( 55 ), Matsubara H, et al. ( 56 ), Northcott PA, et al. ( 57 ), Brock M, et al. ( 58 ) |
| hsa-miR-106b a | 0.85073 | Alzheimer's disease, CLL, gastric cancer, HCC, multiple myeloma | Hébert SS, et al. ( 59 ), Sampath D, et al. ( 60 ), Kim YK, et al. ( 61 ), Li Y, et al. ( 62 ), Pichiorri F, et al. ( 63 ) |
| hsa-miR-17-5p b | 0.83800 | ATC, breast cancer, CML, HCC, lung cancer, MYC-rearranged lymphoma, NB, pulmonary hypertension, Sezary syndrome | Takakura S, et al. ( 47 ), Yu Z, et al. ( 53 ), Venturini L, et al. ( 54 ), Connolly E, et al. ( 55 ), Matsubara H, et al. ( 56 ), Tagawa H, et al. ( 64 ), Fontana L, et al. ( 65 ), Brock M, et al. ( 58 ), Ballabio E, et al. ( 66 ) |
| hsa-miR-20b a | 0.83752 | T-cell lymphoma | Landais S, et al. ( 67 ) |
| hsa-miR-27a c | 0.82441 | Breast cancer, gastric cancer, HCC | Guttilla IK, et al. ( 68 ), Liu T, et al. ( 69 ), Huang S, et al. ( 70 ) |
| hsa-miR-27b c | 0.82194 | ALL, AML, colorectal cancer | Mi S, et al. ( 71 ), Xi Y, et al. ( 72 ), |
| hsa-miR-30a-5p b | 0.80958 | ATC, cardiac hypertropy, colorectal cancer | Visone R, et al. ( 73 ), Sayed D, et al. ( 74 ), Arndt GM, et al. ( 75 ) |
| hsa-miR-30e-5p a | 0.80916 | Bladder cancer, DMD, HNSCC | Wang G, et al. ( 76 ), Eisenberg I, et al. ( 77 ), Hebert C, et al. ( 78 ) |
| hsa-miR-30c a | 0.80743 | Bladder cancer, cardiac hypertropy, colorectal cancer | Wang G, et al. ( 76 ), Sayed D, et al. ( 74 ), Arndt GM, et al. ( 75 ) |
| hsa-miR-30d b | 0.80684 | AML, ATC, cardiac hypertrophy, CLL | Dixon-McIver A, et al. ( 79 ), Visone R, et al. ( 73 ), Marton S, et al. ( 80 ), Sayed D, et al. ( 74 ) |
a Most updated cancer-related miRNAs prioritized in the top 10.
b Known thyroid cancer miRNAs prioritized in the top 10.
c Unknown cancer miRNAs prioritized in the top 10.
In this study, we used a systematic approach for prioritizing candidate cancer miRNAs based on the functional consistency between miRNA target genes and cancer-related genes. Our method integrated large-scale functional information from GO biological process branches and combined miRNA targets and cancer-related genes. Our approach is useful in many respects and has many advantages for research on cancer miRNAs. The FCS-based prioritized miRNA ranked list is ready for experimental verification and is a cost-effective and time-saving method; it is a powerful supplement for experimental research on miRNAs. In summary, our computational approach is a systematic biological method and is useful for cancer diagnosis, treatment, and prognosis and miRNA-related drug research in cancer pharmacology.
FUNDING
Funding for open access charge: National Natural Science Foundation of China (Grant Nos. 31100948, 30871394, 61073136 and 91029717); the National High Tech Development Project of China, the 863 Program (Grant Nos. 2007AA02Z329); National Science Foundation of Heilongjiang Province (Grant Nos. QC2009C23); the Science Foundation of Educational Commission of Heilongjiang Province (Grant Nos. 11551233); the Graduate Innovation Fund of Heilongjiang Province (Grant Nos. YJSCX2009-226HLJ); the Graduate Innovation Fund of Heilongjiang Province (Grant Nos. YJSCX2011-334HLJ).
Conflict of interest statement . None declared.
REFERENCES
Author notes
The authors wish it to be known that, in their opinion, the first three authors should be regarded as joint First Authors.

Comments