


Abstract
Identifying cancer driver genes and pathways among all somatic mutations detected in a cohort of tumors is a key challenge in cancer genomics. Traditionally, this is done by prioritizing genes according to the recurrence of alterations that they bear. However, this approach has some known limitations, such as the difficulty to correctly estimate the background mutation rate, and the fact that it cannot identify lowly recurrently mutated driver genes. Here we present a novel approach, Oncodrive-fm, to detect candidate cancer drivers which does not rely on recurrence. First, we hypothesized that any bias toward the accumulation of variants with high functional impact observed in a gene or group of genes may be an indication of positive selection and can thus be used to detect candidate driver genes or gene modules. Next, we developed a method to measure this bias (FM bias) and applied it to three datasets of tumor somatic variants. As a proof of concept of our hypothesis we show that most of the highly recurrent and well-known cancer genes exhibit a clear FM bias. Moreover, this novel approach avoids some known limitations of recurrence-based approaches, and can successfully identify lowly recurrent candidate cancer drivers.
INTRODUCTION
It is now common knowledge that cancers arise due to alterations in genes that confer growth advantage to the cell ( 1 ). More than 400 such ‘cancer genes’, identified to date are currently annotated in the Cancer Gene Census ( 2 ). The availability of the human genomic sequence has led to the idea that systematic resequencing of cancer genomes could reveal the full list of mutations in individual cancers and hence identify many of the remaining cancer gene ( 3–7 ).
A challenge to all systematic screens of alterations is therefore to distinguish driver—those that are positively selected during tumor development—from passenger alterations, which are byproducts of tumorigenesis. However, experimental validation of somatic mutations cannot cope with the increased capacity to identify somatic mutations. Thus, computational methods that can successfully identify cancer drivers are urgently needed.
Most methods aimed at distinguishing, for example, significantly mutated genes, which are candidates to cancer drivers, actually rely on the detection of recurrently mutated genes. They rank genes according to the probability to observe by chance the number of somatic single-nucleotide variants (SNVs) found across a number of tumor samples ( 8–13 ). Some known limitations of these methods include the difficulty in correctly assessing the background mutation rate, as all parameters that affect it are not well-understood, and the fact that they usually fail to identify lowly recurrently mutated driver genes. Moreover, frequency-based measurements probably tend to favor early driver genes over those that are mutated late during tumor development ( 14 ). It is therefore clear that novel approaches for the identification of cancer drivers that do not rely on recurrence and can thus overcome these challenges are necessary.
On the other hand, several methods developed in recent years attempt to assess the functional impact (FI) of non-synonymous SNVs (nsSNVs) on protein function relying mostly on evolutionary information. Their results have often been employed to detect likely cancer driver nsSNVs ( 15–19 ) although with one or two exceptions, they were not developed primarily for this task. These methods lack the ability to point at likely driver genes or gene modules, because they focus on ranking individual nsSNVs rather than on their recurrence across several tumor samples.
Here we present a novel approach to detect candidate cancer drivers which does not rely on recurrence. First, we hypothesized that any bias toward the accumulation of somatic variants with high FI observed in a gene or group of genes may be an indication of positive selection and can thus be used to detect candidate driver genes or gene modules. Then, we developed a method to measure this bias (FM bias) and applied it to three datasets of tumor-somatic variants. We show that most highly recurrent and well-known cancer genes exhibit a clear FM bias. We regard this as a proof of concept of our hypothesis. In addition, this novel approach avoids the known limitations of recurrence-based approaches described above, and can, for example, successfully identify lowly recurrent candidate cancer drivers.
We have called this method Oncodrive-fm, since it aims to detect likely driver genes and pathways in cancer through the analysis of functional mutations—a different method called Oncodrive was recently reported by us ( 20 ). It is important to note that despite the similarity in their names which is due merely to coherence, these two sister methods differ in the type of data they analyze and, most importantly, in their approaches to identify likely driver genes. Whereas the original Oncodrive identifies genes that suffer recurrent amplifications, deletions, upregulation or downregulation, Oncodrive-fm prioritizes genes or pathways that show a bias toward the accumulation of functional somatic variants. As a matter of fact—to our best knowledge—Oncodrive-fm is the first method aimed at detecting driver genes or pathways that through the employment of a statistical test assesses the significance of this bias across a cohort of tumor samples.
In this article we describe the Oncodrive-fm approach and present the outcome of its application to three datasets of tumor-somatic variants compared with a well-known recurrence-based approach. Based on the results, we recommend the use of Oncodrive-fm to complement recurrence-based approaches and for exploratory cancer genomics studies, where it may identify likely driver genes and pathways that may be explored further through wider studies.
MATERIALS AND METHODS
Obtaining and processing somatic variants data
We obtained the files with the genomic locations of all SNVs detected in glioblastoma multiforme (gbm) ( 6 ) and ovarian serous carcinoma (osc) ( 7 ) samples by TCGA from the data provided with the MEMo algorithm ( 21 ). These datasets contain somatic variants detected in 1200 genes of 135 samples of gbm and in the exome of 316 samples of osc. We then converted the genomic coordinates of the SNVs to the hg19 assembly of the Human Reference Genome (using the UCSC genome browser liftOver) ( 22 ) and employed the Ensembl Variant Effect Predictor v.62 (VEP) ( 23 ) to identify synonymous SNVs (sSNVs), non-synonymous SNVs (nsSNVs), stop-loss SNVs (stSNVs) and frameshift-causing short indels (fsindels). The VEP also identified the genes affected by the SNVs, and provided SIFT ( 15 , 16 ) and PolyPhen2 ( 17 ) scores of nsSNVs. Then, we used the MutationAssessor (MA) webAPI ( 18 ) to obtain their MA scores. (We used these instead of those reported within the original MEMo files to make sure they had been obtained with the most recent version of the MA software and data.) At the end of this pipeline, we produced for each tumor type a five-column file containing the Ensembl ID of each gene with at least one variant detected across tumor samples, the ID of the sample where the variant had been detected and the FI scores provided by the three methods, or derived from them in the case of sSNVs, stSNVs and fsindels (see below the Results section).
We downloaded the coordinates and donor ids of SNVs found in 109 samples of chronic lymphocytic leukemia (cll) ( 24 ) exomes sequenced by the Spanish Ministry of Science and in 77 gbm sequenced by the Johns Hopkins University (gbm JHU) ( 25 ) from the ICGC Data Coordination Center Biomart database ( 26 ). The coordinates of the mutations in gbm JHU samples were converted to the hg19 assembly as explained above. On the other hand, SNVs in cll samples were already annotated in hg19 coordinates. The remaining processing steps mirrored those described for gbm and osc data.
Recurrence assessment of gbm and osc SNVs
We chose MutSig ( 10 ) to detect recurrently mutated genes in the gbm and osc dataset. As with the gbm and osc mutation datasets, we directly obtained the results of the MutSig execution from the data provided with the MEMo algorithm. We did this instead of running it ourselves, to overcome difficulties in obtaining all the necessary input data. The MutSig list of recurrently mutated genes in gbm contains the results for the 1200 genes sequenced in TCGA phases 1 and 2 on a larger set (339) of samples. (Mutations in IDH1 although included in the maf file with MEMo were not analyzed by MutSig; Figure 2 A and Supplementary Figure S1 ) and on the exome of the same 316 osc samples ( 21 ).
Oncodrive-fm implementation
We have prepared a PERL implementation of the Oncodrive-fm approach which may be downloaded from http://bg.upf.edu/oncodrive . It contains example input files of the gbm and cll datasets. Each input file contains the list of variants detected in every gene and sample of each tumor and the SIFT, PPH2 and MA scores of each of them, as described in the Results section. These data files may be used to reproduce the results described in this manuscript. Users who have obtained lists of genomic variants in several samples of one or more tumor types may also create their own input files using those provided as template. In this implementation users define whether they want to use the external or internal null distributions to compute the FM bias of genes and pathways. One good approach could be to use both and compare the resulting lists of genes or pathways, as exemplified in Figure 2 B for cll genes. Oncodrive-fm is not limited by the number of samples that need to be sequenced—unlike recurence-based analysis—in order to detect likely driver genes or pathways. Note, however, that FM bias can only be computed for genes that have mutations in at least two samples.
RESULTS
Main goal and rationale
The goal of Oncodrive-fm is to detect genes or gene modules that across several tumor samples exhibit a trend toward the accumulation of variants with high FI (FM-biased genes or modules). It results from the assembly of two main components: (i) a measure of FI of the somatic variants of all genes across several tumor samples; and (ii) an assessment of the significance of the bias toward the accumulation of variants with high FI (FM bias) in each gene or gene module.
Component 1 ( Figure 1 A) starts by computing a metric of the FI of each SNV found in a gene across a list of tumor samples. In principle, any measure of the impact of SNVs on the function of the proteins that bear them could be used. Several bioinformatics methods are commonly used to score the effect of somatic mutations found by large oncogenomics studies ( 15 , 17–19 ).
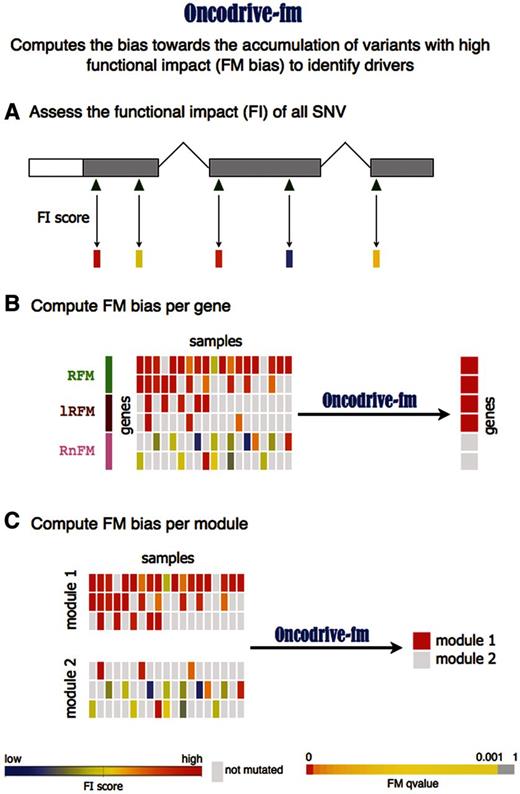
Schematic representation of the Oncodrive-fm approach. Oncodrive-fm computes the bias toward the accumulation of variants with high FI to identify drivers. ( A ) The first step consists in calculating a FI score of variants identified in a cohort of patients. ( B ) Next, Oncodrive-fm assesses if there is a bias toward the accumulation of variants with high FI (FM bias) for each gene, giving as a result a P -value per gene that indicates how biased it is with respect to a null distribution. Note that Oncodrive-fm does not assess how likely it is that a gene has a particular number of mutations, but instead given the number of mutations it has, how biased they are to high FI. RFM, Recurrent and FM biased; lRFM, Lowly Recurrent and FM biased; RnFM, Recurrent but not-FM biased. ( C ) Oncodrive-fm can also be used to assess the FM bias of gene modules (e.g. Pathways).
Component 2 ( Figure 1 B) consists in averaging the FI scores of the variants observed in a gene across all tumor samples and assessing which genes exhibit an FI average that differ significantly from the background. The rationale behind this analysis is that driver genes will show a shift toward highly deleterious somatic mutations, because the alteration of their function is positively selected by tumor development. Therefore, as a result they will exhibit high FI averages and will have a higher likelihood to be FM biased. On the contrary, genes that are altered as a byproduct of tumorigenesis will receive mutations across all the FI score spectrum, thus resulting in rather low FI averages.
Note that our approach is not based on the recurrence of mutations in genes; genes with few mutated samples may show high FI averages if they are all highly deleterious. The opposite is also true: genes that accumulate mutations that do not affect their functions significantly will have as a rule, low FI averages. This phenomenon is illustrated in Figure 1 B. Although the fourth gene in the figure harbors mutations in only three samples, these are deleterious enough (red-shifted in the central heatmap) to raise the average FI of this gene above that of the fifth gene, which contains mild mutations in nine samples.
The same general rationale applies to the detection of significantly FM-biased pathways, or any other gene modules ( Figure 1 C).
Implementation of the method
We have tested an implementation of Oncodrive-fm using three well-known methods that assess the FI of nsSNVs and whose scores may be obtained in a high-throughput manner to evaluate hundreds of nsSNVs in a few minutes. These methods are SIFT ( 15 , 16 ), PolyPhen2 (PPH2) ( 17 ) and MutationAssessor (MA) ( 18 ). We use this implementation to explain Oncodrive-fm throughout this article. Nevertheless, we have prepared the Oncodrive-fm scripts in such a manner, that the user can define any number of FI score methods to compute the FM bias (see Discussion section).
The three aforementioned methods only assess the FI of non-synonymous somatic mutations. However, other protein-affecting mutations, such as stop SNVs (stSNVs) and small indels that cause frameshift (fsindels) can also alter driver genes in the path to tumorigenesis. (Traditional recurrence-based analyses also include them in equality to non-synonymous variants.) Since, we do not posses a clear way of assessing their impact on protein function, we have scored them using a very simple rule of thumb. The highest SIFT and PPH2 scores for nsSNVs (0 and 1, respectively) are assigned to stSNVs and fsindels under the assumption that variants that truncate a protein or produce one with an aberrant sequence are at least as functional as the most deleterious nsSNV. Following an analogous reasoning, stSNVs and fsindels receive the MA score that separates the 'medium' and 'high' FI categories (3.5) defined by the MA team ( 18 ). The actual impact of a stSNV or a fsindel should be modulated by their position within the aminoacid sequence. Nevertheless, we believe that our approach does not introduce any appreciable perturbations to the FM bias.
Furthermore, because we want to detect genes whose alteration is subject to positive selection, sSNVs should also be considered within the FM bias analysis. Genes that receive a higher proportion of synonymous mutations will see their average FI decrease, and thus their FM bias reduced. To illustrate this issue further, consider again the fifth gene in Figure 1 B. It's two most blue-shifted mutations could be sSNVs. If they were not taken into account, the gene might appear falsely FM biased.
We have attributed the lowest SIFT and PPH2 scores (1 and 0, respectively) to sSNVs following the rationale that since sSNVs do not affect protein sequence they are at most as deleterious as the least deleterious nsSNVs. Finally, sSNVs receive the minimum MA score (−2) observed in approximately half a million nsSNVs mapped by the 1000 genomes project ( 30 ).
Let us take again for illustrative purposes the fourth gene represented in Figure 1 B. It appears mutated in three samples. Therefore, to assess the statistical significance of its average FI with respect to the internal null distribution we ask how likely it is to find arrays of three mutations in this tumor with an average FI equal to or greater than its observed average FI. To answer, we randomly sample with replacement one million groups of three mutations from the list of variants found in all sequenced samples and compute the corresponding one million random average FIs. The fraction of these that result equal to or greater than the observed average FI of the gene is taken as its empirical P -value. An analogous process is followed with the external null distribution. In this example, we would sample 100 000 random groups from the list of nsSNVs observed in genes within the same slimGO as the fourth gene in Figure 1 B across more than 1000 individuals ( 27 ). Finally, the P -values are corrected for multiple testing using either FDR (internal null distribution) or Bonferroni's approach (external null distribution).
Because germline SNVs have been subjected to purifying selection their FI scores tend to be lower than those of somatic mutations. This implies that the external null distribution will have a lower mean than the internal null distribution. Therefore, when the average FI of a gene is compared with the external null distributions the empirical P -value will always be higher than when compared with the internal null distribution. This effect is illustrated in Supplementary Figure S1 through the examples of two clearly FM-biased genes and one non-FM-biased gene in cll.
Beyond these differences between external and internal P -values, we believe that the most important output of Oncodrive-fm is the ranking of the FM bias of genes. Top ranking genes will exhibit the largest deviations in their average FI from the background, thus making the best driver candidates. The actual cutoff—it is important to bear in mind that the usual 0.05 after FDR or Bonferroni's also entails numerous arbitrary decisions—to select the candidate driver genes are to be set by the oncogenomics researcher in full knowledge of the tumor type they are analyzing and their data.
Since our implementation of Component 2 of Oncodrive-fm inputs three FI scores matrices (see above), for each gene we compute three empirical P -values of its FM bias. The final step of Component 2, therefore, consists in integrating these three P -values into a unified measurement of significance. We do this through Fisher's combined probability test ( 28 ).
Note that the step of SNVs random sampling aimed at computing the FM bias of genes does not correct for gene length. Such a correction is not necessary because Oncodrive-fm evaluates the accumulation of FI rather than the number of mutations. In other words, Oncodrive-fm does not assess how likely it is that a gene has a particular number of mutations, but instead given the number of mutations it has how biased they are to high FI. Longer genes, which are more prone to bear somatic mutations by chance, should possess low average FI scores, because their mutations—if not implicated in tumorigenesis—will hit any segment of the FI score range. This is an important methodological difference between Oncodrive-fm and recurrence-based methods such as MutSig.
We have also implemented Component 2 for the detection of significantly FM-biased pathways using the definition of canonical pathways from MsigDB ( 29 ). In this case, instead of randomly sampling one million groups, we compute Zscores for the average FI of pathways with respect to the null distribution of random average FIs obtained as described above for genes. This is possible because pathways bear more mutations than individual genes—we compute the FM bias of pathways with at least 10 mutations, thus assuring through the Central Limit Theorem that the sampled null distributions of random average FIs are very close to normality. ( Supplementary Figure S2 illustrates the normality of sampled null distributions for gbm pathways with different numbers of mutations.) As before, three Zscores are obtained for each pathway, one for the average FI of each FI scoring method. The combination is then done at the level of Zscores using Stouffer's method ( 30 ). Finally, the FM bias P -value is obtained from the combined Zscore.
Application of Oncodrive-fm to three datasets of cancer somatic mutations
We have applied the Oncodrive-fm approach to three datasets of genes with SNVs and fsindels in samples of different tumor types: glioblastoma multiforme ( 6 ) (gbm), ovarian serous carcinoma ( 7 ) (osc) and chronic lymphocytic leukemia ( 24 ) (cll). We computed the FM bias of all genes with at least 2-mutated samples (3 in the osc dataset) and pathways with at least 10-mutated samples.
The gbm dataset with only a limited number of genes sequenced was evaluated using the external null distribution, whereas the second and the latter, produced by whole-exome sequencing were assessed using the internal null distribution. We computed the FM bias P -value of each gene across 135 gbm samples as explained above using the external null distribution—hence external FM P -value—and compared them with the results of the recurrence analysis using MutSig ( 10 ). It is highly remarkable that almost all genes found to be recurrently mutated also show high ranking FM bias ( q -value < 0.001, i.e. TP53, PTEN, NF1, PIK3R1, ERBB2, EGFR, RB1, PIK3CA), indicating that not only are they frequently mutated but the mutations selected in the tumor cells are biased toward those having high FI on the protein. We mark these genes as Recurrent and FM biased (RFM; green at the left of Figure 2 A heatmap). We regard this observation as a proof of concept of our method. Three recurrently mutated genes (PSMD13, CHECK2 and GSTM5) on the other hand exhibit low or no FM bias, which implies that the SNVs they bear possess low FI scores. This contradiction raises the possibility that at least some of them may not be true drivers, whereas others could be false negatives of Oncodrive-fm. Hence, we classify them as Recurrent but not-FM biased or RnFM (dark red).
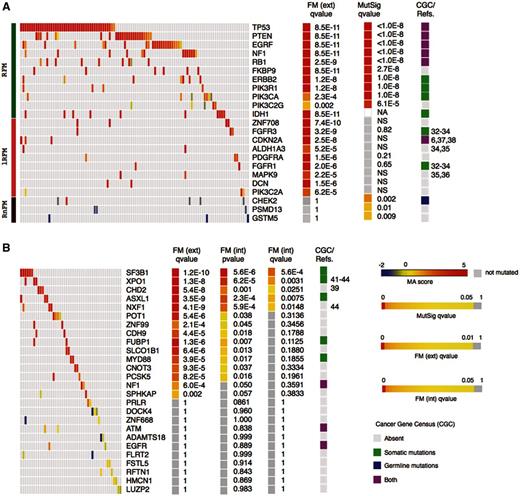
Examples of high and low ranking FM-biased genes and gene modules identified by Oncodrive-fm in the gbm and cll datasets. (Main heatmaps in ( A ) and ( B ) show samples in columns and genes in rows and the color illustrates the MA scores of somatic mutations.) (A) Gbm genes analyzed by Oncodrive FM can be found RFM (green bar at the extreme left of the panel), lRFM (pink) or RnFM (dark red). (B) Top 15 and bottom 11 ranking genes (in terms of FM corrected external P -value) of the cll dataset. FM ext. qv , corrected P -values of the FM bias analysis using the external null distribution. MutSig qv , corrected P -values of the mutation recurrence analysis (implemented by MutSig). FM int. pv , P -values of the FM bias analysis using the internal null distribution. FM int. qv , corrected P -values of the FM bias analysis using the internal null distribution. CGC/Refs , Annotations from the Cancer Gene Census or general literature (numbers correspond to references in the text) linking genes to tumor development. All heatmaps were built using Gitools ( 47 ) and include only genes with at least two mutated samples. NA, not included in the MutSig analysis; NS, not significant.
Finally, Oncodrive-fm detects other 32 genes with high FM bias which are overlooked by the recurrence analysis, hence termed lowly RFM, lRFM. Nine examples are shown in Figure 2 A (pink), and the whole list appears in Supplementary Figure S3 . We think these deserve closer examination as some of them have indeed been found to be involved in tumorigenesis, as ALDH1A3, FGFR1, FGFR3 or MAPK9 (details in the Discussion section).
As remarked above, Oncodrive-fm may thus be appreciated as a tool to rank genes following their likelihood of being drivers, hence aiding to guide new, better-focused studies to search for true drivers. It is important to bear this in mind, especially in the cases where the external null distribution is used to compute the FM-bias. Top-ranking FM-biased genes are likely to be involved in tumorigenesis, but it must always be the specialized oncogenomics researcher who draws the line of actual significance based on their accumulated knowledge.
Next, we used Oncodrive-fm to detect F- biased genes in a dataset of somatic mutations in 77 gbm samples produced by the Johns Hopkins University (gbm JHU) to assess the reproducibility of its results in this independent smaller dataset ( 25 ). In summary (see Supplementary Figure S4 ), we found eight genes that are FM biased in both gbm datasets. Other nine significantly FM-biased genes in the gbm TCGA dataset are overlooked by Oncodrive-fm in the gbm JHU dataset; eight of them, because they appear mutated in only one sample and were thus not analyzed. Finally, six FM-biased genes in gbm JHU were not sequenced in gbm TCGA. There is, therefore, a high degree of agreement in the results of Oncodrive-fm in these datasets. Nevertheless, the comparison suggests that probably new lowly recurrent FM-biased genes will be revealed as more tumor samples are sequenced. The differences found in the results of both datasets also reveal that the heterogeneity of the tumor type may lead to the appearance of different arrays of lowly recurrent driver genes in independently selected groups of patients.
Furthermore, in an effort to understand the contribution to the FM P -value of the three FI scoring methods employed, we ran Oncodrive-fm with the FI scores of each method separately (SIFT, PPH2 and MA) on the gbm dataset ( Supplementary Figure S3 , fourth, fifth and sixth one-column heatmaps). We noticed that the MA score provides the greater contribution to the detection of FM-biased genes; it detects 33 of the 43 FM-biased gbm genes. Nevertheless, Oncodrive-fm fails to detect PIK3CA and PIK3C2G as FM biased when using only the MA FI score. These two known driver genes are detected only by the SIFT FI score. Based on these results, we recommend—whenever possible—to employ a combination of complementary FI scores to assess the FM bias of genes.
We also investigated the actual contribution of sSNVs, stSNVs and fsindels to the FM bias of gbm genes by computing their average FI including only nsSNVs ( Supplementary Figure S3 , third one-column heatmap). We found that while most highly recurrent genes continue to appear as FM bias, some particular known drivers are no longer FM biased, either because their average FI decreases as a consequence of the removal of stSNVs and fsindels, or because they are left with no (or only one) sample mutated, thus being filtered out from the Oncodrive-fm analysis. This is the case for RB1, CDKN2A and PIK3C2A.
In the analysis of the cll dataset, Oncodrive-fm is able to detect the gene SF3B1 as the highest ranking FM-biased gene ( Figure 2 B) in coincidence with a recent report on its importance in the development of this disease ( 24 ). In total, the FM bias analysis of cll samples produces 15 candidate driver genes ( q -value < 0.001) if the FM P -value is computed using the external null distribution. This list is reduced to only 5 when the internal null distribution is employed to compute the FM P -value ( q -value < 0.05), which is possible in the case of cll, where whole-exome sequencing was performed. Once again, the top ranking among these, such as XPO1 and CHD2 are worth exploring further.
Most recurrently mutated genes in osc according to MutSig are detected by Oncodrive-fm as significantly FM biased ( q -value < 0.01). This is the case, for example of TP53, BRCA1 and BRCA2 ( Supplementary Figure S5 ). Only two genes, ZNF614 and B4GALNT4 are missed by Oncodrive-fm because they have less than 3 samples with mutations in the dataset. On the other hand, 43 genes fall in the lRFM category. Once again, several among these, such as CDK12 and MLL are known drivers, whereas others, such as PYGM, GART and GNAS could represent novel driver genes.
Oncodrive-fm also reveals several pathways with high FM bias in gbm, cll and osc patients ( Figure 3 ), such as the MAPK and mTOR pathways in gbm and the mRNA splicing pathway in cll. The malfunctioning caused to the latter pathway by the alteration of gene SF3B1 has been experimentally demonstrated ( 24 ); nevertheless, the U2AF2 gene is affected by variants in samples where SF3B1 is not mutated. The same behavior is apparent in the cases of EGFR and NF1 in the MAPK pathway ( Figure 3 A), and PTEN and PIK3R1 in the mTOR pathway ( Figure 3 B) in gbm samples, in agreement with the notion that driver genes tend to be mutated within pathways in a mutually exclusive manner ( 21 ).
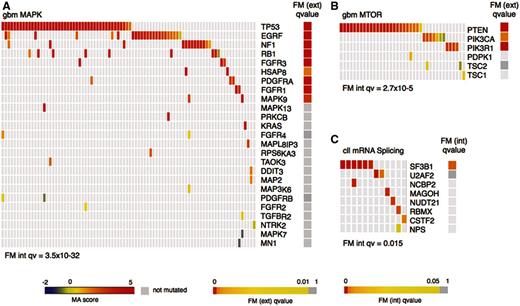
Examples of significantly FM-biased pathways in gbm and cll. ( A ) and ( B ) Genes with somatic mutations in gbm tumors in the MAPK (KEGG) and mTOR (BIOCARTA) pathways, respectively. ( C ) Genes with variants in cll tumors in the mRNA SPLICING (REACTOME) pathway. FM ext. qv , corrected P -values of the FM bias analysis using the external null distribution. FM int. qv , corrected P -values of the FM bias analysis using the internal null distribution. All heatmaps include only samples with variants.
DISCUSSION
It is an established notion that genes implicated in tumorigenesis are supposed to bear functional mutations, and the score of FI of somatic variants observed in this group of genes has been used before to link them to cancer development ( 18 ). Nevertheless, the idea that cancer drivers are biased toward the accumulation of functional variants across cancer samples had never been previously exploited to develop a method to systematically prioritize candidate cancer. Oncodrive-fm constitutes a first step in that direction.
Lowly recurrent FM-biased genes contain known drivers
The analysis of gbm samples using the external null distribution produced a list of 43 genes with significant FM bias ( q -value < 0.001). Ten of them are detected also as recurrently mutated by MutSig ( q -value < 0.05)—hence qualified as Recurrently mutated and with significant FM bias, RFM. Actually, despite being based on different principles, Oncodrive-fm and MutSig show a strikingly high level of coincidence in their lists of likely driver genes ( Figure 2 A and Supplementary Figure S2 ). This corroborates that likely driver genes do not simply tend to accumulate somatic variants, but these variants are biased to those having high FI.
A quick glance at the lRFM genes reveals that at least some of them have been recognized as important for the tumorigenesis in different cell types. The ALDH1A3 gene, which encodes one of the isoforms that contribute to the aldehyde dehydrogenase activity in the cell is one of the lRFM genes in gbm ( Figure 2 A and Supplementary Figure S3 ). In the past years, several studies have discovered alterations in this enzyme as well as other isoforms in cancer stem cells and in several human and murine tumors ( 30 , 31 ).
The FGFR1 gene, also a lRFM in gbm is a member of the fibroblast growth factor receptor family, which belongs to the superfamily of tyrosine kinase receptors. Members of the fibroblast growth factor receptor family are involved in the regulation of a wide range of processes in normal cells, including proliferation, apoptosis and cell migration. They are altered in a number of human cancers from hematopoietic malignancies to solid tumors. Germline mutations in the FGFR1 gene and other fibroblast growth factor receptors are known to play a part in various human skeletal dysplasias, whereas somatic mutations, amplifications and deletions in several of them are involved in the genesis of several tumors. These alterations generally confer them oncogenic properties, although under some conditions the proteins of this family may also act similarly to tumor suppressors ( 32–34 ).
The product of another lRFM gbm gene, the MAPK9 (also known as JNK2) is one of the serine-threonine kinases that act as transducers in the non-canonical Wnt signaling pathway. These proteins phosphorylate a wide range of substrates, including transcription factors such as p53. Their involvement in tumorigenesis has been documented in several cell types ( 35 , 36 )
The cyclin-dependent kinase inhibitor A encoded by the CDKN2A gene is a key regulator of the cell cycle, where it participates in maintaining the correct levels of active p53 by negatively regulating MDM2. It also inhibits CDK4 thus promoting the G1/S progression, and its involvement in cancer development as a tumor suppressor in different malignancies is well established. It is significantly homozygously deleted across TCGA gbm samples and germline mutations that affect it have been linked to increased susceptibility to develop gliomas. Oncodrive-fm found the CDKN2A gene to be highly FM biased whereas it was not detected as recurrently mutated by MutSig ( Figure 2 A) ( 6 , 37 , 38 ).
From the results of the analysis of the ICGC cll dataset we highlight four genes that were not identified among those recurrently mutated in the original study. The ASLX1 gene is annotated in the CGC because it has been found mutated in myelodysplastic syndrome ( 2 ). On the other hand, the CHD2 gene encodes a chromodomain helicase DNA-binding protein, which is involved in chromatin remodeling and histone-deacetylation. This specific member of the family appears to be a key player in hematopoiesis ( 39 ).
The gene XPO1 codes for the exportin-1 protein, a member of the beta-karyopherin family involved in ribosome biogenesis. Exportin-1 specifically deals with the translocation of newly assembled ribosome subunits out of the nucleus. A recent study ( 40 ) has found it to be regulated by c-Myc and p53, which through it tightly control the intracellular transport of ribosome building blocks at different stages of completion. Although this study cites a previous report that found importin-7—another member of the beta-karyopherin family—overexpressed in colorectar cancer ( 41 ) it clarifies that very little is still known about the probable involvement of the ribosome biogenesis machinery in cancer development. Nevertheless, apart from the ICGC study ( 24 ) whose data we used to validate the Oncodrive-fm approach, at least two independent sequencing studies of cll genes have found somatic SNVs in XPO1 ( 42 , 43 ). None of these three, however, have found XPO1 to be recurrently mutated, suggesting that its role in promoting tumorigenesis would be limited to few patients. It would act, in other words as a lowly recurrent driver gene. Another gene that participates in mRNA export pathways, NXF1 ( 44 ) is also significantly FM biased in CLL. Interestingly, because this gene bears two stSNVs along with a nsSNV, it would not have been detected if the former had been excluded from the FM bias analysis.
Different pathways are FM biased in the three tumor types
Significantly FM-biased pathways differ in gbm, osc and cll. This conclusion becomes apparent from Supplementary Figure S6 . Although cell-cycle and DNA repair-associated pathways dominate the FM bias landscape of gbm and osc, cll exhibits a different pattern where transcription and mRNA processing pathways are frequently significant targets of functional variants. These opposite behaviors are probably the reflection of different routes to tumorigenesis. Our finding that cll mRNA processing pathways tend to accumulate functional variants has recurrently appeared in the past couple of years as a feature apparently common to several leukemias and lymphomas ( 45 , 46 ).
Using Oncodrive-fm
A PERL implementation of the Oncodrive-fm approach is available for download at http://bg.upf.edu/oncodrive . We have prepared this as a general implementation to assess the FM bias. The user can compute the FM bias of genes and pathways in their own dataset of somatic mutations in a cohort of samples employing any FI score. (If they choose to run Oncodrive-fm with a single-FI score the system skips the combination step.) Exemplary files for the gbm and cll datasets used in this article are provided along with the scripts. Running the pipeline is very straightforward; all necessary parameters are defined in a configuration file, of which the corresponding examples for gbm and cll are also available.
When analyzing the output of Oncodrive-fm—or any other method that attempts to uncover significantly mutated genes across a cohort of tumors—the researcher must take into account for instance the tissue type that corresponds to the tumor under analysis, to correct for gene expression. They should also acknowledge that mutations are not the only cancer-causing alterations: copy number variations and changes in the methylation status are also part of this landscape. Also, when preparing the file to compute the FM bias of genes and pathways it may be important to exclude from the analysis tumor samples that present an excessive mutational burden which could arise from factors such as treatment with chemotherapeutic agents or heterogeneity in grade, stage or patients' age.
In summary, in this work we have shown that the FM bias is useful to uncover driver genes, including lowly recurrent driver genes, and gene modules. Moreover, it possesses an attractive advantage over recurrence-based approaches: FM-biased genes may be detected even if only few cancer samples have been sequenced. This might allow oncogenomics researchers to design exploratory whole-exome or whole-genome sequencing assays including a relatively small number of samples and identify interesting candidates for deep re-sequencing. Because recurrence is also an essential piece of information when it comes to detect significantly mutated genes, if somatic variants from a large cohort of patients are available we recommend computing the FM bias in conjunction with the analysis of recurrence to reliably identify likely driver genes and pathways.
FUNDING
Spanish Ministry of Science and Technology [SAF2009-06954]; Spanish National Institute of Bioinformatics (INB). Funding for open access charge: Spanish Ministry of Science and Technology [SAF2009-06954].
Conflict of interest statement . None declared.
ACKNOWLEDGEMENTS
We acknowledge funding from the Spanish Ministry of Science and Technology and the Spanish National Institute of Bioinformatics (INB).

Comments