


Abstract
The transcription factor forkhead box P2 (FOXP2) is believed to be important in the evolution of human speech. A mutation in its DNA-binding domain causes severe speech impairment. Humans have acquired two coding changes relative to the conserved mammalian sequence. Despite intense interest in FOXP2, it has remained an open question whether the human protein’s DNA-binding specificity and chromatin localization are conserved. Previous in vitro and ChIP-chip studies have provided conflicting consensus sequences for the FOXP2-binding site. Using MITOMI 2.0 microfluidic affinity assays, we describe the binding site of FOXP2 and its affinity profile in base-specific detail for all substitutions of the strongest binding site. We find that human and chimp FOXP2 have similar binding sites that are distinct from previously suggested consensus binding sites. Additionally, through analysis of FOXP2 ChIP-seq data from cultured neurons, we find strong overrepresentation of a motif that matches our in vitro results and identifies a set of genes with FOXP2 binding sites. The FOXP2-binding sites tend to be conserved, yet we identified 38 instances of evolutionarily novel sites in humans. Combined, these data present a comprehensive portrait of FOXP2’s-binding properties and imply that although its sequence specificity has been conserved, some of its genomic binding sites are newly evolved.
INTRODUCTION
FOXP2 is a transcription factor of interest in the development and evolution of language in humans (1). Broad interest in FOXP2 began with the discovery of its linkage to autosomal dominant transmission of developmental verbal dyspraxia, a deficit of speech articulation, in the large KE family pedigree (2). The trait was linked to a locus on chromosome 7 and eventually to a single nucleotide (residue 553) residing in the DNA-binding domain of FOXP2, a member of the forkhead box family of sequence-specific DNA-binding proteins (2–6). Several unrelated cases having similar phenotypes were also identified and typically involved truncation events of the 3′-end of the FOXP2 open reading frame (ORF) (2,7). Affected individuals have normal intelligence and hearing but have jerky, dysfluent and disordered speech (8). FOXP2, therefore, offers an entry point into understanding the molecular underpinnings of the development of patterned syntactic speech.
Shortly after the KE phenotype was mapped to FOXP2, analysis of the gene’s sequence conservation revealed an interesting evolutionary history, adding another dimension to its importance in human speech. The mammalian sequence is well conserved except for two mutations in the human lineage (T303N and N325S), both N-terminal to the Zn-finger domain (Figure 1). Conservation analysis revealed an enhanced non-synonymous substitution rate in the hominid lineage, consistent with recent selection (9). In support of this idea, researchers found that FOXP2 locus sequences from a diverse panel of human individuals contain an excess of high-frequency derived alleles and rare intronic alleles indicative of a selective sweep in human ancestors (10,11). Animal models expressing either mutant FOXP2 or lower levels of wild-type protein have borne out the involvement of FOXP2 in vocalization in mice and in zebra finches (12–14). These results suggest that in addition to its developmental role in speech, FOXP2 may have had an evolutionary role in speech and language.
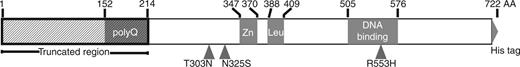
Schematic of FOXP2 domains and truncated construct used in MITOMI experiments showing C2H2 zinc-finger domain, leucine zipper domain, forkhead box DNA-binding domain and histidine repeat epitope tag (6xHis). Human lineage substitutions are at positions 303 and 325. The R553H mutation linked to verbal dyspraxia lies within the DNA-binding domain. A polyglutamine (polyQ) stretch was removed by truncation of the shaded region. We 6xHis-tagged the C-terminus for recruitment and retention on chip.
Although there exist several possible paths for the molecular evolution of FOXP2 function between ancestral primates and humans, here we investigate the simple possibilities that the selected protein mutations in the human lineage could have altered FOXP2’s-binding activity, driving novel targeting and functions; and/or that the genomic binding sites in humans could have changed, causing modulation of targeting strength and gain and loss of FOXP2-binding targets.
Evaluation of these possibilities would be aided by a thorough understanding of the FOXP2 affinity profile, yet there is surprisingly poor agreement over the identity of the FOXP2 DNA-binding motif (Table1). This poor agreement may be due to either the use of different experimental techniques or reliance on previous candidate motifs identified through studies of related proteins (e.g. FOXP1 and FOXP3) (15–17). The lack of a consistent binding site model makes it difficult to predict targets by sequence analysis, which in turn complicates the task of defining evolutionarily novel target repertoires.
Previously reported models of the FOXP2-binding site
| Publication | Data type | System | Motif |
|---|---|---|---|
| Vernes et al. (2007) | ChIP-chip | SH-SY5Y cells overexpressing FOXP2 | TCTTCGT |
| Vernes et al. (2008) | EMSA | In vitro binding to CNTAP2 sequence | AATTTG |
| Enard et al. (2009) | Gene expression | Humanized mice | TATTTAT |
| Vernes et al. (2011) | ChIP-chip | Wild-type embryonic mice | ARKTAMYT |
Here, we clarify FOXP2’s target motif using recently developed microfluidic methods that measure binding affinity of proteins to a library of different DNA sequences (18,19). The resulting detailed binding site model reveals essentially identical affinity profiles for the chimp and human FOXP2 orthologs, suggesting that evolutionary differences between lineages did not involve distinct binding preferences. The derived FOXP2 motif is corroborated by an unbiased search for overrepresented motifs within FOXP2-bound ChIP-seq peaks. We find that most motif sites are conserved, and they tend to be near other transcription factor genes. However, we also find instances of evolutionarily novel FOXP2 target binding sites, including genes involved in synaptic plasticity and neural development, suggesting that changes in cis regulation may underlie novel functions of FOXP2 in human language.
MATERIALS AND METHODS
Cloning, mutagenesis and expression
Full-length FOXP2 coding sequence was initially amplified from HeLa cDNA (primers designed to isoform 1 Ensembl record CCDS5760, included in Supplementary Information) and placed into a PCR2.1-topo vector. Point mutations in the derived clone were corrected by site-directed mutagenesis (20). The sequence was confirmed by Sanger sequencing and assembly with phred/phrap. Chimp and human mutant R553H FOXP2 coding versions were constructed by site-directed mutagenesis on this wild-type human plasmid. We removed the first 213 codons by PCR and added flanking promoter, polyA, and His tag sequences necessary for in vitro transcription/translation and MITOMI (see Supplementary Information). The truncation removed the long polyglutamine stretch at the beginning of the protein for improved expression and solubility (Figure 1). A similar truncation was previously used for electromobility shift assay (EMSA) studies (21), as polyglutamine stretches of >40 residues are associated with misfolding and aggregation (22,23). The PCR products were purified by Promega Wizard gel purification and concentrated via vacuum centrifugation to ∼140 ng/μl. TnT® T7 coupled reticulocyte lysate kit from Promega with the addition of 10 μM ZnCl2 was used to produce the protein of interest. We included 3 μl of Fluorotect Green BODIPY charged lysine tRNA in each 75 μl translation reaction for detection of the protein by fluorescence.
MITOMI mold and device fabrication
MITOMI devices were made as described previously (18,19). Briefly, molds for devices were fabricated on 4-inch silicon wafers by mask photolithography. Masks were based on previously published designs (18). The two layers of the device were made from RTV615 PDMS casts from the silicon molds. After partial curing, the two layers were aligned and baked. The two-layer device was then aligned and bonded to an epoxy-silane glass substrate (CEL associates) with a printed array of the DNA library. Finished devices were run as described previously (18,19,24).
DNA library design, synthesis and printing
The full 740 oligonucleotide pseudorandom library was designed with software from Eisen and Mintseris (25) to include all possible 65 536 8-bp DNA sequences in a relatively compact sequence space. This minimal string was then divided into 52mer oligonucleotides. We ordered these single-stranded oligonucleotides with a 3′ 14-base adapter sequence to enable synthesis of the complementary strand (IDT Coralville, IA, USA, Supplementary Table S1). A common labeled primer complementary to the common adapter (Alexa647-GTCATACCGCCGGA) was also ordered from IDT (Coralville, IA, USA). The second strand was synthesized with Klenow exo− enzyme. For the targeted systematic mutation libraries, double-stranded oligonucleotides were synthesized by the same process and then serially diluted to final working concentrations of 0.001–2 μM DNA. Printing was carried out with silicon tips on a contact printer. Libraries were resuspended to a final concentration of 3× saline–sodium citrate buffer, with 0.125% polyethylene glycol-6000 (Fluka) and 12.5 mg/ml of d-(+)-trehalose dihydrate (Fluka).
MITOMI data analysis
In general, we followed the analysis protocol described previously (19). An array of DNA chambers holding the library of double-stranded oligonucleotides was situated next to an array of ‘button valves’ that trap the interaction between each oligonucleotide sample and the protein of interest. At the end of each experiment, devices were scanned to measure fluorescence intensities using an arrayWoRx scanner with arrayWoRx 3.0.3 software suite release 1. Fluorescence data for bound DNA and protein at the button valve and free DNA in the DNA chamber were extracted from the scanned devices with Genepix 6.1.
To identify initial IUPAC motifs preferred by FOXP2, we used fREDUCE software to screen all degenerate Nmers in the sequence library for their Pearson correlation to associated binding scores (26). Using ratios of bound DNA signal to protein signal at the button valve, fREDUCE was run to identify preferred 6mers through 9mers with up to three degenerate positions. The bound DNA/protein ratio data were normalized to the highest observed ratio (displayed as “rNN”) in all analyses except for comparison of binding strengths between wild-type and mutant constructs. The top scoring IUPAC sequences by correlation and P-value with respect to the whole data set were then used as input ‘seeds’ for MatrixREDUCE. Given a seed sequence, MatrixREDUCE searches for a local optimum position-specific affinity matrix (PSAM) that best fits the measured binding data (27). MatrixREDUCE was also run on all the random library-binding data without any initial seed sequence, to remove any potential for bias introduced by the constraints of the IUPAC motif representation. MatrixREDUCE results were then scored against the whole data set by Pearson’s correlation between the observed and expected occupancies. PSAM motif logos were made with AffinityLogo software (27).
Binding curves were fit to a hyperbolic saturation curve with global non-linear regression in Graphpad Prism 4.00. A dilution series of the fluorescently labeled primer was used as a standard curve to calibrate the relationship between fluorescence intensity and free DNA concentration on the devices.
Chromatin IP data
Processed ChIP-seq data from the Myers laboratory at Hudson Alpha were downloaded from the ENCODE portal of the UCSC Genome Browser (http://genome.ucsc.edu/cgi-bin/hgFileUi?db=hg18&g=wgEncodeHaibTfbs). The data were derived from chromatin immunoprecipitation libraries from PFSK-1 and SK-N-MC cells using an antibody that recognizes the C-terminal 127 amino acids of FOXP2 (28). Cross-linked and sheared chromatin samples were sequenced and compared with libraries prepared without any immunoprecipitation. We used the peaks called by the Myers laboratory using QuEST, which collapses ChIP-seq signal from both strands of DNA and then calculates a fold enrichment of the peaks over the no immunoprecipitation control (29). There were two biological replicates from each cell line. We used the function findOverlappingPeaks in the R Bioconductor ChIPpeakAnno package (http://www.bioconductor.org/packages/release/bioc/html/ChIPpeakAnno.html) to first merge the replicate peaks within data from each cell line to form a set of 1483 peaks. For convenience, we will refer to the overlapping peak set of 1483 as ‘replicate peaks’. We merged these replicate peaks to form a set of 71 high-confidence peak sequences that gave strong signals across all samples from both cell lines. The peaks’ positions relative to the nearest genes, regardless of gene orientation, were annotated using the annotatePeakInBatch function of ChIPpeakAnno for genome build NCBI36. We determined GO term enrichment using the getEnrichedGO function of ChIPpeakAnno with maximum P-value of 0.05 after adjusting for multiple testing (30).
Motif searching in ChIP-seq peaks
For the set of 1483 replicate peaks and the set of 71 high-confidence peaks, we extracted the genomic sequences plus 50 or 200 extra nucleotides on each end of the full peak sequence. These sequences were passed to MEME version 4.3.0, which output PWMs ranked by their E-values for representation in the set of positive sequences (31). The input parameters specified a minimum motif width of 8 bp, a maximum motif width of 50 bp, a minimum of two sites and an E-value threshold of 1 E-50.
We also used the MITOMI-derived 7mer PSAM to score motifs within the 71 high-confidence peaks. For this analysis, we calculated the predicted occupancy ratio relative to the strongest sequence for 7mer windows across the entire oligonucleotide sequence (27) and then compared the score for the highest scoring window with the distribution of scores for all 7mers. We identified candidate target sites of interest by using a score threshold of 0.06, which returns the top 0.1% of 7mer scores.
Conservation analysis
We hypothesized that FOXP2 motifs inside the ChIP-seq high-confidence peaks would exhibit elevated conservation relative to the surrounding sequence. Using the best PWM from our MEME analysis, we searched replicate peak regions for FOXP2-binding sites using TAMO v1.0 (32) to identify predicted binding sites. We selected a threshold of 90% of the maximum bit score to yield approximately one FOXP2 motif per ChIP-seq peak. The same approach was taken for the 71 high-confidence peaks and the larger list of 1483 replicate peaks. From 1483 peaks, we identified 472 that contained at least one instance of a FOXP2 motif within our 90% of maximum score threshold as scored by TAMO. We then determined conservation scores for windows extending 100-bp upstream and downstream of each predicted binding site using the UCSC phastCons44WayPrimate alignment score file (http://hgdownload.cse.ucsc.edu/goldenpath/hg18/phastCons44way/primates/). We used these to compute both an ensemble average of conservation and the principal components of conservation (using the R prcomp package) in the region centered on each predicted transcription factor-binding site (TFBS).
To find novel FOXP2-binding targets among the human ChIP-seq peaks, we searched the merged replicate peaks that had strong binding sites. Of these, 38 contained sites with a substantial reduction in predicted FOXP2 affinity (50% or less of maximum bit score) between human and chimp sequences. By analyzing the UCSC multiz44way alignment (http://hgdownload.cse.ucsc.edu/goldenPath/hg18/multiz44way/) of these 38 sites across human, chimp, gorilla, rhesus, marmoset, tarsier, mouse lemur and bushbaby, we identified 22 sites for which the changes are unique to the human lineage.
RESULTS
Human R553H mutant shows no binding activity
Previous EMSA studies did not detect binding of the R553H mutant to SV40 DNA sequence (21). These results are consistent with two possibilities: the mutant could lack DNA-binding activity, or the mutant could have altered target site specificity. To distinguish between these possibilities, we used a microfluidic-binding assay (MITOMI 2.0) to search for binding interactions between the mutant protein and a DNA library containing all possible 8-bp sequences. In brief, MITOMI 2.0 experiments measure affinities between a single BODIPY-labeled transcription factor and many Alexa-647 or Cy5-labeled DNA sequences in parallel; the measured DNA signal intensity normalized by the protein signal intensity provides a measure of the fractional protein occupancy at a given DNA concentration. Truncated human R553H protein gives essentially zero protein occupancy signal for all assayed sequences (Figure 2A). Our data, therefore, suggest that R553H has lost all DNA-binding activity and not just the ability to bind its normal motif.
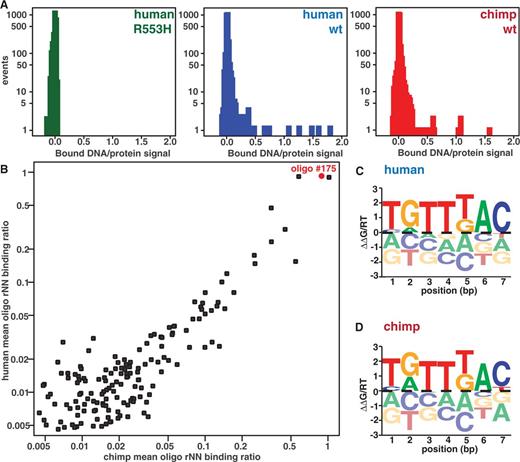
Results from FOXP2 MITOMI 2.0 binding assays against a pseudorandom 8mer library. (A) Histograms of MITOMI data showing the ratios of DNA signal intensities to protein signal intensities for human R553H mutant, human WT and chimpanzee alleles. R553H shows no binding to any sequence in the library, whereas chimp and human FOXP2 produces strong binding to a subset of oligonucleotides. (B) Comparison of chimp and human binding ratios (rNN) for all oligonucleotides in the DNA library. Oligonucleotide #175 (used for later targeted analysis) is labeled in red. (C) Top scoring human MatrixREDUCE 7mer affinity logo generated using AffinityLogo (27). The height of each letter depicts the predicted energetic cost or benefit (ΔΔG/RT) of a particular nucleotide at that position in the motif. The centerline indicates zero energetic change. (D) Top scoring chimp MatrixREDUCE 7mer affinity logo.
Chimp and human proteins produce similar patterns of binding
In contrast to the R553H mutant, the protein occupancy signal distribution for truncated chimp and human FOXP2 proteins contains a tail indicative of strong binding to a subset of DNA sequences (Figure 2A). Comparing the binding pattern of chimp and human truncated FOXP2 protein, it is clear that some probes are repeatedly bound, e.g. oligonucleotide #175, whereas most oligonucleotides exhibit low binding (Figure 2A and B). The binding patterns for the two proteins are similar (Pearson’s r2 of 0.85, Figure 2B).
Chimp and human orthologs bind similar motifs
Identifying the preferred motif that correlates with binding to the library of DNA sequences requires analysis because each 52-bp oligonucleotide contains many potential binding sites (19). To identify these target sites, we first used fREDUCE, which identifies preferred motifs based on the correlation between measured binding intensity and the presence of subsequences within each oligonucleotide and searched for preferred motifs between six and nine nucleotides in length (26). fREDUCE returns lists of degenerate consensus sequences ranked by their correlation to the observed pattern of binding to the DNA library. To determine the effects of nucleotide substitutions at each position within these target sites, we subsequently used MatrixREDUCE, which fits a local optimum PSAM to the observed pattern of binding (27). Supplementary Table S2 lists preferred sequences obtained from analysis of four aggregated experiments for each protein (Supplementary Table S3 lists predictions from individual experiments). As expected, the similar binding patterns observed for the chimp and human proteins produce similar enriched motifs (Figure 2C and D and Supplementary Table S2) (Supplementary Figure S1 shows similar results obtained through MatrixREDUCE queries without an initial IUPAC seed sequence). The top motifs of different lengths are essentially nested versions of the same motif for the human and chimp protein, each containing a core TGTTKAC sequence. In summary, the chimp and human FOXP2 bind similar DNA oligonucleotides in our library and seem to prefer similar motifs.
Systematic mutation of the binding motif provides base-specific affinity information
To experimentally confirm our prediction that chimp and human FOXP2-binding preferences are the same at the single-nucleotide level, and to explore the effects of flanking nucleotides on affinity, we measured affinities for FOXP2 constructs interacting with a series of oligonucleotides containing single-nucleotide substitutions. For this targeted binding curve library, we chose to use the 13 bp containing a candidate high-affinity binding site within a strongly bound oligonucleotide (#175) as a reference sequence. We then designed 39 DNA sequences with all possible point mutations of this 13bp sequence within the context of the larger unchanged oligonucleotide (full DNA sequences in Supplementary Table S4). We programmed the MITOMI device with a dilution series of each oligonucleotide and measured FOXP2 binding over the series. These experiments allowed us to calculate apparent Kas by non-linear regression of the binding curves for all oligonucleotides (18).
Figure 3A plots the fold change in the Kas for each motif variant for both truncated chimp and human versions of FOXP2 derived from analysis of individual binding curves (example curves for all oligonucleotides are shown in Supplementary Figures S2 and Supplementary Data). The bulk of the sequence specificity lies in a 7-bp core motif, with relatively minor contributions outside of that core. Although a number of point variants (e.g. TATTTAC and TGTTTAT) are permissive for binding, with Kas only 3-fold lower than the strongest sequence, other point variants (e.g. TGTTAAC) are clearly disfavored, with Kas >100-fold lower than the strongest sequence. Taking these measurements together, we constructed an improved position-specific affinity matrix (PSAM) that reflects the experimentally observed effects of each point mutation at each position (Figure 3B and C) (PSAM matrices are displayed in Supplementary Table S5).
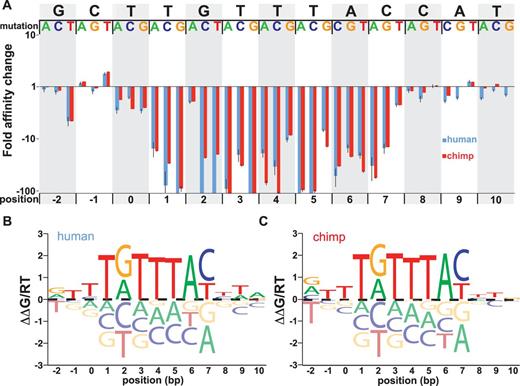
Affinity measurements for systematic mutations of the binding site and flanking sequences. (A) Fold change in affinity (mutated Ka/unmutated Ka) shown in log-scale. At every position, three values are shown for substitutions with each alternate base relative to the starting sequence. Error bars represent the standard error of the mean. Chimp and human data are displayed in red and blue, respectively. (B) PSAM affinity logo based on the affinities displayed in part A for the human allele. As in Figure 2, the height of each of four base letters depicts the measured energetic cost or benefit (ΔΔG/RT) of adding that base at that position in the motif. The centerline indicates zero energetic change. (C) PSAM affinity logo based on the affinities displayed in part A for the chimp allele.
In agreement with the pseudorandom library measurements, we find that the pattern of affinity is similar across the two proteins (Student’s t-test on the mean and standard deviation of the separate experiments, P > 0.05), confirming that there is essentially no difference in binding preferences between species. In addition, these derived motifs are in agreement with the motifs obtained via pseudorandom library measurements, except for slightly less G/T degeneracy at the fifth position in the 7mer. These motifs represent the most detailed in vitro description of the specificities of the FOXP2-binding sites to date and are distinct from all previously reported FOXP2-binding motifs (Table 1).
MITOMI results match an independently derived FOXP2 motif from ChIP-seq data
In parallel with our MITOMI efforts, we analyzed in vivo FOXP2 DNA-binding data from human neuronal cell lines from the Myers laboratory released to the public as part of the ENCODE consortium (28,33). To study only the most reproducible ChIP-seq signal enrichment peaks, we first identified overlapping ChIP-seq signal peaks within the biological replicates for each cell line, yielding 1238 overlapping peaks (of 5111 peaks) for the PFSK1 cells, and 316 overlapping peaks (of 615 peaks) for the SK-N-MC cells. As noted in the ‘Materials and Methods’ section, we will refer to this overlapping peak set as ‘replicate peaks’. Next, we narrowed this set to consider only those peaks that were shared between cell lines, yielding 71 high-confidence peaks.
To these 71 high-confidence ChIP-seq peaks, we added 50 bp of the flanking genomic sequence and searched for enriched sequence motifs using MEME (31). The resulting top position weight matrix [E-value = 4.5E-82, relative entropy 13.7 bits (34)] is similar to the motif found using our MITOMI device (motif matrix logo Figure 4A, compare with Figure 3B). Extending our search set to all replicate peaks within each cell line generated similar results (Supplementary Figure S4). When including a wider sequence window of 200 bp around each peak, MEME returned 73 instances of a similar motif (E-value = 2.6E-51), but also identified 55 instances of a long putative homopolymer G/C stretch (E-value = 2.4E-56, Supplementary Figure S5). Among all high-confidence peaks, 47/71 (63%) contained at least one instance of our strongest predicted motif string, and 65/71 (92%) peaks contained a local PSAM motif score within the top 0.1% of all possible 7mers (Table 2 and Supplementary Table S6).
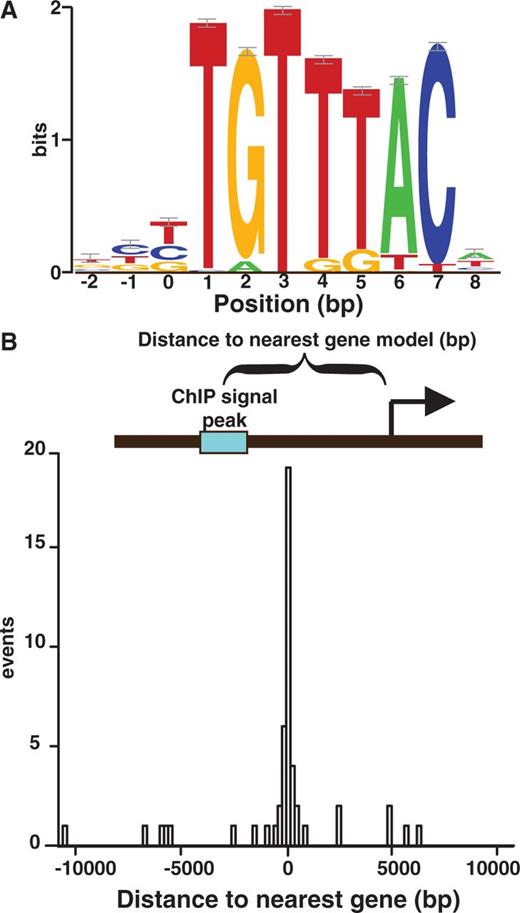
FOXP2 target-binding motif as revealed by ChIP-seq analysis. (A) Motif derived from MEME analysis of 71 ChIP-seq peak sequences with 50 bp of flanking sequence included. Motifs are displayed with small sample correction error bars. (B) Histogram of the relative positioning of the 71 FOXP2 ChIP-seq sites relative to the start of the nearest neighboring gene.
Consistent ChIP-seq peaks near genes
| Peak | Max PSAM score | Top 0.1% | ‘TGTTTAC’ | Nearest gene | Description | RefSeq# | Distance to TSS | Intronic? |
|---|---|---|---|---|---|---|---|---|
| 1 | 0.45 | Yes | No | NFIA | Nuclear factor I/A | NM_001145512 | 93 | |
| 2 | 1.00 | Yes | Yes | TPRG1L | Tumor protein p63-regulated gene 1-like protein | NM_182752 | 199 | |
| 3 | 1.00 | Yes | Yes | BROX | BRO1 domain and CAAX motif containing | NM_144695 | 802 | Intronic |
| 4 | 1.00 | Yes | Yes | RBM17 | RNA-binding motif protein 17 | NM_001145547 | 2444 | |
| 6 | 1.00 | Yes | Yes | PSMA1 | Proteasome subunit α type-1 | NM_148976 | 64 934 | Intronic |
| 7 | 0.05 | No | No | ZBTB16 | Zinc-finger and BTB domain containing 16 | NM_006006 | 102 327 | Intronic |
| 9 | 0.10 | Yes | No | NAB2 | NGFI-A-binding protein 2 (EGR1-binding protein 2) | NM_005967 | 273 | |
| 10 | 0.22 | Yes | No | TPCN1 | Two pore segment channel 1 | NM_001143819 | 1534 | Intronic |
| 11 | 1.00 | Yes | Yes | BTG1 | B-cell translocation gene 1, anti-proliferative | NM_001731 | 50 | |
| 13 | 1.00 | Yes | Yes | KLHDC2 | Kelch domain containing 2 | NM_014315 | 46 | |
| 14 | 0.14 | Yes | No | KIAA0586 | Uncharacterized protein | NM_001244189 | 120 | Intronic |
| 15 | 1.00 | Yes | Yes | BAHCC1 | Bromo adjacent homology domain and coiled-coil containing 1 | NM_001080519 | 5616 | |
| 16 | 1.00 | Yes | Yes | DHX8 | DEAH (Asp-Glu-Ala-His) box polypeptide 8 | NM_004941 | 47 | |
| 17 | 1.00 | Yes | Yes | DHX40 | DEAH (Asp-Glu-Ala-His) box polypeptide 40 | NM_024612 | 49 | |
| 18 | 0.04 | No | No | SPOP | Speckle-type POZ protein (SPOP) | NM_001007226 | 99 | |
| 19 | 1.00 | Yes | Yes | PHLPP1 | PH domain leucine-rich repeat-containing protein phosphatase 1 | NM_194449 | 216 | |
| 20 | 1.00 | Yes | Yes | LTBP4 | Latent-transforming growth factor β-binding protein 4 | NM_001042544 | 2595 | Intronic |
| 21 | 1.00 | Yes | Yes | JUNB | Jun B proto-oncogene | NM_002229 | 149 | |
| 22 | 0.14 | Yes | No | FBXO46 | F-box protein 46 | NM_001080469 | 5927 | Intronic |
| 23 | 1.00 | Yes | Yes | BBC3 | BCL2-binding component 3 | NM_001127240 | 517 | Intronic |
| 24 | 1.00 | Yes | Yes | FUZ | Fuzzy homolog (Drosophila) | NM_025129 | 363 | |
| 25 | 0.14 | Yes | No | SPAST | Spastin | NM_014946 | 115 | |
| 27 | 0.07 | Yes | No | ARHGAP25 | Rho GTPase-activating protein 25 | NM_001007231 | 3084 | |
| 29 | 1.00 | Yes | Yes | PCMTD2 | Protein-l-isoaspartate O-methyltransferase domain-containing protein | NM_018257 | 5581 | Intronic |
| 32 | 1.00 | Yes | Yes | HSF2BP | Heat shock transcription factor 2-binding protein | NM_007031 | 48 420 | Intronic |
| 33 | 1.00 | Yes | Yes | PIGP | Phosphatidylinositol N-acetylglucosaminyltransferase subunit P | NM_153682 | 12 250 | |
| 34 | 1.00 | Yes | Yes | C21orf77 | C21orf77 | NM_144659 | 6138 | |
| 35 | 1.00 | Yes | Yes | CBX7 | Chromobox protein homolog 7 | NM_175709 | 6758 | Intronic |
| 36 | 1.00 | Yes | Yes | CECR3 | Cat eye syndrome chromosome region, candidate 3 (non-protein coding) | NR_038398 | 173 | |
| 38 | 1.00 | Yes | Yes | FOXP1 | Forkhead box P1 | NM_032682 | 100 | |
| 39 | 1.00 | Yes | Yes | MAML3 | Mastermind-like protein 3 | NM_018717 | 131 | |
| 40 | 1.00 | Yes | Yes | YTHDC1 | YTH domain-containing protein 1 | NM_001031732 | 19 | |
| 41 | 0.14 | Yes | No | UBE2B | Ubiquitin-conjugating enzyme E2B | NM_003337 | 74 | |
| 42 | 1.00 | Yes | Yes | POLK | DNA-directed DNA polymerase κ | NM_016218 | 10 564 | Intronic |
| 43 | 1.00 | Yes | Yes | NR3C1 | Nuclear receptor subfamily 3, group C, member 1 (glucocorticoid receptor) | NM_000176 | 47 709 | Intronic |
| 44 | 0.01 | No | No | GPANK1 | G patch domain and ankyrin repeats 1 | NM_001199237 | 346 | |
| 46 | 1.00 | Yes | Yes | CCDC28A | Coiled-coil domain containing 28A | NM_015439 | 236 | |
| 47 | 0.14 | Yes | No | FAM8A1 | Family with sequence similarity 8, member A1 | NM_016255 | 6 | |
| 48 | 0.45 | Yes | No | DTNBP1 | Dystrobrevin-binding protein 1 | NM_032122 | 110 549 | Intronic |
| 49 | 1.00 | Yes | Yes | RUNX2 | Runt-related transcription factor 2 | NM_004348 | 23 847 | Intronic |
| 50 | 1.00 | Yes | Yes | CITED2 | Cbp/p300-interacting transactivator, with Glu/Asp-rich carboxy-terminal domain, 2 | NM_006079 | 869 | |
| 51 | 0.00 | No | No | PRKRIP1 | PRKR interacting protein 1 (IL11 inducible) | NM_024653 | 157 | |
| 52 | 1.00 | Yes | Yes | ELN | Elastin | NM_000501 | 15 646 | Intronic |
| 53 | 1.00 | Yes | Yes | CBLL1 | Cas-Br-M (murine) ecotropic retroviral transforming sequence-like 1 | NM_024814 | 205 | |
| 54 & 55 | 1.00 | Yes | Yes | FOXP2 | Forkhead box P2 | NR_033766.1 | 84 | |
| 56 | 1.00 | Yes | Yes | FOXK1 | Forkhead box K1 | NM_001037165 | 62 596 | Intronic |
| 57 | 1.00 | Yes | Yes | HIBADH | 3-hydroxyisobutyrate dehydrogenase | NM_152740 | 140 | |
| 58 | 1.00 | Yes | Yes | THSD7A | Thrombospondin type-1 domain-containing protein 7A | NM_015204 | 291 190 | Intronic |
| 59 | 1.00 | Yes | Yes | TNRC18 | Trinucleotide repeat-containing gene 18 protein | NM_001080495 | 459 | |
| 61 | 1.00 | Yes | Yes | PVT1 | Pvt1 oncogene (non-protein coding) | NR_003367 | 57 522 | Intronic |
| 62 | 1.00 | Yes | Yes | ZNF395 | Zinc-finger protein 395 | NM_018660 | 15 465 | |
| 63 | 0.05 | No | No | FNTA | Farnesyltransferase, CAAX box, α | NM_002027 | 37 | |
| 64 | 1.00 | Yes | Yes | OSR2 | Protein odd-skipped-related 2 | NM_001142462 | 77 | |
| 65 | 0.22 | Yes | No | TNFRSF10B | Tumor necrosis factor (ligand) superfamily, member 10 | NM_003810 | 34 | |
| 66 | 0.45 | Yes | No | FBXO32 | F-box protein 32 | NM_058229 | 79 | |
| 67 | 0.14 | Yes | No | ASAP1 | ArfGAP with SH3 domain, ankyrin repeat and PH domain 1 | NM_018482 | 5653 | Intronic |
| 69 | 1.00 | Yes | Yes | BRD3 | Bromodomain containing 3 | NM_007371 | 32 | |
| 70 | 0.50 | Yes | No | TBL1X | Transducin (β)-like 1X-linked | NM_005647 | 159 |
Peaks within 5 kb of either end of a gene model are shown along with PSAM motif scores. Max PSAM score refers to the maximum local alignment score. If the PSAM score is in the top 0.1% of score for random 7mers then it is noted in the ‘Top 0.1%’ column. The ‘TGTTTAC’ column notes whether the peak contains the consensus TGTTTAC. Nearest Gene, description and RefSeq# characterize the gene model nearest each peak. The nucleotide distance to TSS is sometimes >5 kb because some peaks are downstream of the gene model, and some are within large introns, as noted in the last column (intergenic peaks are described in Supplementary Table S6).
FOXP2 ChIP-seq peaks have a stereotyped position and flanking sequence bias
To better understand the regulatory relevance of these candidate FOXP2 sites, we investigated their location relative to nearby genes. The FOXP2 sites tend to cluster near the start of the closest gene model, with over half of the ChIP peaks occurring within 1 kb of a transcriptional start site (TSS) (Figure 4B and Supplementary Figure S6). Additionally, nucleotide bias calculations across the regions flanking the FOXP2-binding site revealed a G/C bias on both sides of the FOXP2 motif instance (Supplementary Figure S7). This might explain the low information content G/C biased sequences identified in our MEME searches over the region surrounding ChIP-seq peaks (Supplementary Figure S5).
Characterization of predicted FOXP2 target genes
To functionally characterize these sites, we mapped nearby genes. Fifty-eight genes are within 5 kb of the 71 high-confidence ChIP sites, and 1049 annotated genes are within 5 kb of the replicate ChIP sites (Table 2 and Supplementary Table S7). Bioconductor GO term querying of these nearby genes returned several terms relating to other transcriptional regulators with strong P-values, suggesting that FOXP2 tends to target other transcription factor genes (Tables 3 and Supplementary Table S6). Genes near FOXP2 sites in the list that fit this description are ZBTB16, NFIA, TBL1X, ZNF395, CITED2, JUNB, CBX7, FOXP1, FOXK1, NR3C1 (glucocorticoid receptor) and FOXP2 itself. A binding site near the FOXP2 gene is nearest to the start of the non-coding FOXP2 transcript NR_033766.1, annotated as a candidate for nonsense-mediated decay. The enrichment of transcription factors in FOXP2’s putative target repertoire suggests that FOXP2 could act as a master regulator during development.
Gene ontology term analysis of consistent peaks from the ENCODE ChIP-seq data, with number of genes in each category noted
| Cell line | GO # | GO term | P-value | No. of genes |
|---|---|---|---|---|
| PFSK-1 | 0008134 | Transcription factor binding | 0.0016 | 54 |
| PFSK-1 | 0030528 | Transcription regulator activity | 0.0016 | 83 |
| SK-N-MC | 0003690 | Double-stranded DNA binding | 0.0558 | 6 |
| SK-N-MC | 0003700 | Sequence-specific DNA-binding transcription factor activity | 0.0470 | 23 |
| SK-N-MC | 0016563 | Transcription activator activity | 0.0558 | 13 |
| SK-N-MC | 0016564 | Transcription repressor activity | 0.0189 | 13 |
Beyond our unbiased target search sets, we searched for FOXP2 ChIP-seq peaks upstream of candidate targets, including previously suggested binding partners that we did not detect in our higher stringency list. Potential interacting forkhead box proteins FOXP4 and FOXJ2 are the closest annotated genes to two intergenic peaks 13–14 kb upstream with conserved strong matches to our motif (35). In addition, HDAC2, encoding a histone deacetylase that interacts with FOXP2 (35), has two upstream peaks. We find two strong FOXP2 localization peaks within intronic sequence of the gene that encodes CTBP1, which complexes with FOXP2 in yeast two-hybrid and co-immunoprecipitation assays (36). However, the genes for NFATC2, GATAD2B, SFTPC, CC10 and IL6 (35,37) encoding other annotated targets or binding partners have no strong FOXP2 ChIP-seq peaks. Overall, these data suggest that FOXP2 may engage in feedback regulation of several of its annotated binding partners.
Sequence conservation at FOXP2 localization peaks
We expected a high degree of conservation for functionally important elements within ChIP-seq peak regions. Using the NCBI36 UCSC phyloP scores for site-specific conservation of multiple aligned sequences (38), we observe that 51 of our 71 high-confidence peaks overlap well-conserved loci. Likewise, the average of aligned phastCons scores (39) reveals an increase in conservation centered on the predicted FOXP2-binding sites, as does the first principle component of the phastCons scores (Figure 5). This pattern holds true if we extend our analysis to the 472 replicate peaks that contain a motif scoring within 90% of the top motif PWM score (Supplementary Figure S8). Such elevated conservation further suggests the motif we identified is evolutionarily salient and suggests that there is a set of conserved target sites for FOXP2 throughout vertebrates.
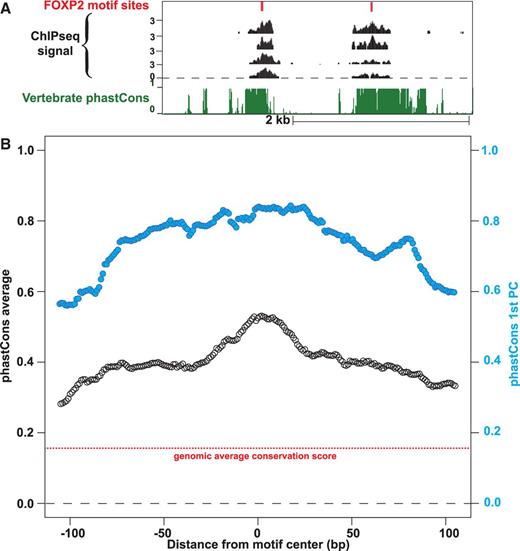
Conservation of sequences within ChIP-seq peaks containing instances of the FOXP2 motif. (A) Example of two FOXP2 ChIP-seq peaks aligned with elements of strong conservation upstream of BACCH1 on Chr17: 79 366 750–79 370 250 (hg18 / NCBI36). Alignments are shown for two high-confidence peak regions with high scoring instances of our MEME motif, and the vertebrate conservation score for the underlying sequence. (B) The mean of the phastcons conservation score over the FOXP2 peak regions is displayed relative to the position of the strong FOXP2-binding motif, with the genomic background average conservation score in red. The first principal component of the phastcons conservation is plotted in blue on the same scale, noted on the right-hand axis.
Human-specific exceptions to this generally strong conservation at the binding site could provide insight into FOXP2’s function in human-specific phenotypes. Therefore, we sought to identify particular FOXP2-binding targets with poorly conserved binding sites among the 71 high-confidence target loci. The sites near HSF2BP and PCMTD2 localization peaks contain instances of our strongest binding sequence that are unique to the human lineage. HSF2BP (heat shock factor 2-binding protein) is known to bind the developmental transcription factor HSF2, which is required for normal brain development (40,41). A single base change in humans was responsible for creating a new strong binding site in the seventh intron of HSF2BP. PCMTD2 (protein-l-isoaspartate O-methyltransferase domain containing 2) is an aspartate and asparganine repair enzyme, and mice lacking this enzyme have increased brain size, abnormal arborization of pyramidal neuron dendrites and die early of progressive epilepsy (42,43). In the second intron of PCMTD2, an 18-bp deletion created a new strong FOXP2-binding site. These examples sparked our interest in the cis evolution of FOXP2-binding sites.
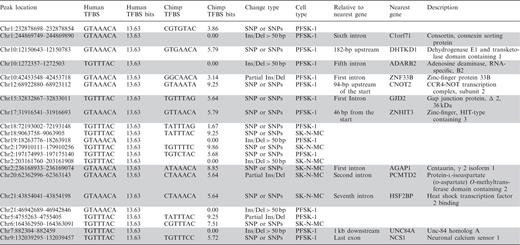
To conduct a broader survey of strong FOXP2 cis-regulatory binding sites that may be evolutionarily novel, we investigated ChIP-seq peaks that were consistently identified within either the PFSK-1 or SK-N-MC cell lines and contained perfect matches to the strongest binding sequence. We found 38 instances of changes in sequence between chimp and human resulting in strong binding sites within replicate ChIP-seq sites. Of these, we discarded 16 sites in which the chimp sequence alone seemed to have acquired mutations relative to the mammalian consensus, leaving 22 sites of interest (Table 4). Roughly half of these events involve an insertion or deletion and the rest involve one or more point mutations. In all, 63% (10/16) of the nearby genes have brain-specific functions (annotated in gray in Table 4) and several may have direct roles in neuronal function.
FOXP2-binding sites within ChIP-seq peaks where the human sequence is novel relative to chimps and other primates
 |
|
Coordinates listed are relative to Hg18/NCBI36 draft of the human genome. Nearest gene models within 5 kb of these peaks are noted, with the blank spaces signifying that there is no gene model within 5 kb of the peak. The motif values are given in bits for alignment of the site in question to the 7mer human MEME matrix; only those sites with the highest possible 7mer motif value (13.63 bits) are displayed. Gray shading denotes a gene with brain-specific function.
FOXP2-binding sites within ChIP-seq peaks where the human sequence is novel relative to chimps and other primates
|
|
Coordinates listed are relative to Hg18/NCBI36 draft of the human genome. Nearest gene models within 5 kb of these peaks are noted, with the blank spaces signifying that there is no gene model within 5 kb of the peak. The motif values are given in bits for alignment of the site in question to the 7mer human MEME matrix; only those sites with the highest possible 7mer motif value (13.63 bits) are displayed. Gray shading denotes a gene with brain-specific function.
For example, we find sites near the genes encoding gap junction protein delta 2 (GJD2), consortin (C1orf71) and neuronal calcium sensor 1 (NCS1), both of which are involved in neuronal signal transduction. GJD2 forms a class of electrical synapses that modulate the firing pattern of neurons during development (44,45), and gap junction assembly requires consortin (46). At chemical synapses, NCS1 modifies synaptic activity in response to calcium current, with broader roles in plasticity and spatial memory tasks in mice (47,48). These candidate novel target genes could have been important to the evolution of the FOXP2 regulon in humans.
DISCUSSION
An accurate and precise binding site model provides a useful tool to study FOXP2’s evolution and molecular involvement in the development of language. Despite intense interest, the true binding preferences of FOXP2 have remained a mystery, with different experimental techniques yielding different candidate consensus sites (Table 1). To clarify FOXP2’s binding site preference, we produced detailed models of the binding site from independent microfluidic affinity cell free assays (Figure 3) and neuronal cell-based ChIP-seq data sets (Figure 4). We find that the human and chimp FOXP2 in vitro binding profiles are virtually identical, featuring the same degeneracies at the same positions. The in vitro MITOMI data provide additional information about the penalties of a given substitution, whereas the ChIP-seq data provide clues to genomic targets in a more physiological setting. Using our in vitro derived motif to identify candidate FOXP2-binding sites, we find 18 ChIP-seq peaks with binding sites that would have been missed by a strict ‘TGTTTAC’ consensus sequence search. We identify several human-specific FOXP2-binding sites that may contribute to the evolutionarily novel role of FOXP2 in language.
In addition to the strong similarity between our independently derived motifs, other observations suggest that we have identified a relevant FOXP2-binding motif. First, our motif is consistent with the accepted RYMAAYA non-FOXP Forkhead box family theme (49,50). Second, conservation scores within ChIP-seq peak regions tend to peak at the exact location of our predicted binding sites. Together, these independent lines of evidence suggest that we have resolved the functional FOXP2-binding motif, modeled both in terms of positional affinity effects and positional frequencies among bound sites.
Additional analysis demonstrates that the motif derived here improves consistency with previous FOXP2 ChIP-chip data (17). Our core motif, modeled as a 5mer TGTKK for the sake of comparison, is overrepresented in the most significant ChIP probes, whereas the previously suggested ATTTG motif is present at the level of expectation (Supplementary Figure S9). Nucleotide biases can complicate motif search algorithms and may explain some of the previous controversy surrounding the binding site. There is a G/C bias in the most highly enriched ChIP-chip probes, perhaps because of a tendency for FOXP2 to bind sites near TSSs within CpG islands (51).
Encouragingly, orthologs of the genes we identify as likely binding targets of FOXP2 also have altered patterns of expression and Foxp2 ChIP-chip signal as shown in previous experiments. Vernes et al. (52) profiled expression in wild-type and Foxp2 321X mutant mice and returned a list of 19 genes that had both ChIP-chip signal and significant expression changes. We found that 17 of these 19 genes have a peak within 5 kb in at least one sample in the human ENCODE ChIP-seq data; ALCAM, CCK, CSDE1, EBF2, GNAL, GNAS, MAPK8IP3, MAST1, NEGR1, NRN1, PLAG1, PSME4, SFXN4, TCF12, TGFBI, CITED2 and COL24A1. An especially interesting target candidate from this list is CITED2 (Cbp/p300-interacting transactivator, with Glu/Asp-rich carboxy-terminal domain, 2), which modulates recruitment of the p300 histone acetyltransferase to promoters resulting in remodeling of the chromatin locus (53) and modification of FOXO proteins (54). CITED2 and these other genes seem to be reproducible FOXP2 targets as observed by independent researchers, with both activating and repressing outcomes (52).
From the ENCODE ChIP-seq data, we produced lists of consistent localization targets in neuronal cell lines and found that FOXP2 binds near genes encoding DNA-binding proteins, such as glucocorticoid receptor and other forkhead box proteins. The set of putative targets includes an alternative transcript of FOXP2 itself and the gene encoding its annotated binding partner FOXP1. The ChIP-seq association with FOXP1 is interesting because disruptions of these genes produce phenotypes with similar characteristics (55) and can cooperatively regulate reporter constructs (36,56). We speculate that autoregulation of the FOXP2 circuit may prove important to FOXP2’s developmental function. In support of this hypothesis, FOXP2 is thought to be part of a co-expressed network of genes having a higher degree of connectivity in humans than in chimp and macaque (57). These themes are consistent with the idea of FOXP2 as a regulator of transcriptional regulators.
Regarding the question of FOXP2’s functional evolution, our data suggest that some of the genomic binding sites have evolved, while the DNA-binding specificity of FOXP2 has been conserved. The FOXP2 PSAM motif and binding sites show a high degree of conservation in both biochemical affinity measurements and sequence alignment at ChIP-seq peaks. This pattern of broad target site conservation suggests that there is a core set of FOXP2 targets in vertebrates, with a limited but interesting set of changed targets in humans. We have observed 22 potential examples of such cis evolution. These may represent newly acquired regulatory targets for human FOXP2 (Table 4, e.g. NCS1 a synaptic calcium sensor involved in synaptic plasticity). Importantly, the FOXP2 bound genes listed here should not be considered an authoritative list. Rather, they were primarily used to analyze the binding site, and candidate binding sites were investigated for potential instances of evolution in humans. However, with a comprehensive binding site model, we can now improve our lists of direct FOXP2 targets and better understand how its regulon may have changed over evolution. Future work of interest may include investigation of the differential protein–protein interactions of the chimp and human FOXP2, and generation of chimp FOXP2 ChIP-seq data for comparison with the existing mouse and human data sets.
FUNDING
Howard Hughes Medical Institute (to C.N., A.G., J.D.R. and P.F.); QB3 California Institute for Quantitative Biosciences (to C.N., J.D.R. and P.F.); Helen Hay Whitney Foundation (to P.F.). Funding for open access charge: Howard Hughes Medical Institute. H.L. and C.F. are funded by NIH-NIGMS [5R01GM070808-08].
Conflict of interest statement. None declared.
ACKNOWLEDGEMENTS
The authors would like to acknowledge Simone Marticke, the Myers Laboratory and ENCODE for public deposition of the ChIP-seq peak data; the Biomolecular Nanotechnology Center at UC Berkeley; and the QB3 Nanofab and Center for Advanced Technology (CAT) at UCSF for equipment support.

Comments