


Abstract
CATH version 3.5 (Class, Architecture, Topology, Homology, available at http://www.cathdb.info/) contains 173 536 domains, 2626 homologous superfamilies and 1313 fold groups. When focusing on structural genomics (SG) structures, we observe that the number of new folds for CATH v3.5 is slightly less than for previous releases, and this observation suggests that we may now know the majority of folds that are easily accessible to structure determination. We have improved the accuracy of our functional family (FunFams) sub-classification method and the CATH sequence domain search facility has been extended to provide FunFam annotations for each domain. The CATH website has been redesigned. We have improved the display of functional data and of conserved sequence features associated with FunFams within each CATH superfamily.
DESCRIPTION OF CATH HIERARCHY AND CURRENT POPULATION OF DATABASE
The CATH database is a hierarchical classification of protein domain structures, using manual curation aided by a variety of classification and prediction algorithms; for example, structural comparison (1) and hidden-Markov model (HMM)-based methods (2). Each protein structure is checked to ensure it meets the selection criteria before it is split into its constituent chains. These chains are, in turn, split into one or more individual domains and then classified into homologous superfamilies according to structure and function.
At the top of the hierarchy is the Class, or C-level, where the domains are classified on the basis of their secondary structure content—i.e. whether they are mostly alpha-helical (Class 1), mostly beta-sheet (Class 2), contain a significant amount of both alpha-helical and beta-sheet secondary structure elements (Class 3) or have very little secondary structure (Class 4).
Within their class, each domain is then classified according to their Architecture (A-level)—i.e. similarities in the arrangement of secondary structures in 3D space. Each architecture is sub-divided into one or more topology, or fold groups (T-level), where the connectivity between these secondary structures is taken into account. Finally, the domains are classified into their respective Homologous superfamilies (H-level), according to similarities in structure, sequence and/or function. Sequence clustering at the H-level produces sequence families at <35% sequence identity (S-level), <60% (O-level), <95% (L-level) and 100% (I level).
For our latest release, CATH v3.5, we have classified 80 new folds, 240 new superfamilies and over 44 000 new domains compared with the release reported in our last NAR update article (CATH v3.3). This is a nearly 50% increase in the size of the resource since CATH v3.3 (see Tables 1 and 2).
This shows the current population of different levels in the CATH hierarchy
| Class | Architectures | Topology | Homologous superfamily | S35 family |
|---|---|---|---|---|
| 1 | 5 | 386 | 875 | 2917 |
| 2 | 20 | 229 | 520 | 2618 |
| 3 | 14 | 594 | 1113 | 6183 |
| 4 | 1 | 104 | 118 | 208 |
| Total | 40 | 1313 | 2626 | 11 926 |
| Class | Architectures | Topology | Homologous superfamily | S35 family |
|---|---|---|---|---|
| 1 | 5 | 386 | 875 | 2917 |
| 2 | 20 | 229 | 520 | 2618 |
| 3 | 14 | 594 | 1113 | 6183 |
| 4 | 1 | 104 | 118 | 208 |
| Total | 40 | 1313 | 2626 | 11 926 |
This shows the increase in new folds and total number of domains in recent releases of CATH
| CATH version | v3.2 | v3.3 | v3.4 | v3.5 |
|---|---|---|---|---|
| Number of new folds (%) | 26 (2.3) | 123 (10) | 49 (4.2) | 31 (2.4) |
| Number of new domains (%) | 20 330 (18) | 14 473 (11) | 24 232 (16) | 20 616 (12) |
COMPARISONS BETWEEN CATH AND SCOP
CATH and Structural Classifications of Proteins (SCOP) (3) are the two most comprehensive protein structure classification resources. Both are in active development. The latest release of SCOP (v1.75) classifies 110 800 domains (38,221 PDB entries) compared with over 173 000 (51,334 PDB entries) for CATH. Currently, CATH has 1313 folds classified compared with 1195 for SCOP, but comparisons at this level are problematic, as more subjective criteria are used in fold classification.
Recent analysis has shown that, if one applies relatively conservative thresholds to identify equivalent superfamilies between the two resources (i.e. a 60% overlap between matching domains identified in the same PDB chain and 60% of these matching domains grouped into equivalent superfamilies), ∼800 superfamilies correspond between SCOP and CATH. A new initiative, Genome3D, is enabling collaboration between the SCOP and CATH groups to refine the identification of equivalent superfamilies and to present information on philosophical differences between the resources that lead to alternative ways of grouping relatives. There is much less agreement at the fold level, again because of the subjective manner in which fold is defined.
FOCUS ON STRUCTURAL GENOMICS STRUCTURES TO DISCOVER NOVEL FOLDS
From CATH v3.3 onwards (4), we concentrated our efforts on classifying more novel SG structures. Recent figures show that, although there was an initial jump in the number of new folds classified in CATH v3.3 (128), this number has decreased steadily since and, at 31 new folds in our latest release, we are now discovering roughly the same number of new folds that we had pre CATH v3.3 (see Table 2 below).
Similarly, Andreeva and Murzin (5) have recently reported that the increase in the numbers of new folds has been lower than expected; although a few new architectures and folds have been discovered, a significant portion of SG structures have been found to have structures similar to already known folds. Past analysis of CATH domain annotations in Gene3D has shown that a significant proportion of domain sequences (up to 70–80% of domain sequences) in completely sequenced genomes can be assigned to a structural family in CATH if highly sensitive methods are used [e.g. HMM-HMM (6)]. This proportion has not changed significantly since expansion of CATH over the past 2 years. This suggests that much of the remaining domain sequences in organisms are largely membrane associated or contain a high proportion of disordered regions. Transmembrane proteins are still under-represented in the PDB.
IMPROVED FUNCTIONAL FAMILY CLASSIFICATION
As we have expanded the CATH superfamilies, we have also been able to use increasing functional information from public resources [e.g. Gene Ontology (GO) (7), Enzyme Commission (EC)(8)] to develop our knowledge of functional divergence within them. We have aimed to use this expanding knowledge to provide functional sub-classification of relatives, which can help biologists understand the structural mechanisms by which functions evolve.
SCOP sub-classifies superfamilies into functionally coherent families through manual analysis using information available in the literature and functional annotation databases [e.g. SwissProt (9), GO, EC, etc]. However, recent analyses by Gough et al. suggest that these groupings correspond more closely to taxonomic groups rather than functional groups (10).
A functional family (FunFam) layer within all CATH superfamilies was first introduced in CATH-Gene3D v10 (11). Predicted domain sequences for CATH superfamilies from Gene3D are now explicitly included in CATH. Domain sequences identified in Uniprot (12) and Ensembl (13) currently expand CATH from 173 536 domain structure entries to 16 297 076 known and predicted domain structure entries. CATH sequence data within each superfamily are sub-classified into FunFams to group together relatives likely to have similar structures and functions.
The original protocol to establish these functional families used a profile-based sequence clustering algorithm together with a fixed generic granularity threshold (14). This corresponds to vertically ‘cutting’ the domain sequence similarity tree of a superfamily at a fixed level to derive a set of FunFams, an ‘unsupervised’ protocol.
A modified version of the FunFam protocol that exploits available GO annotation data to determine the right ‘cut’ of the sequence tree, instead of using a fixed threshold, was used to generate domain families for protein function prediction in Critical Assessment of Protein Function Annotation (CAFA) 2010 (BMC Bioinformatics submitted). This has been extended by a mechanism to detect and account for instances of functional ‘chaining’ in the clustering dendrogram, that is, cases of incongruence between domain sequence similarity and overall protein function similarity. As a whole, this is dubbed the ‘supervised’ protocol.
When dealing with families of (domain) sequences, it quickly becomes apparent that different use cases often suggest and require entirely different levels of family granularity. For example, in the large superfamily that represents the PDZ domain (CATH 2.30.42.10), a promiscuous peptide-binding module, two entirely different sets of families can be identified depending on the ‘point of view’. On the one hand, all domain sequences could be put into a single family, given that the domain always fulfils the same partial function within a diverse set of parent proteins and their different overall functions. On the other hand, the PDZ domains appearing in parent proteins of the same type (e.g. an orthologous group of proteins) will commonly be more similar to each other than to all other domains in the superfamily. These observations lead to two possible sets of families for the same superfamily, one ‘coarse’ and one ‘fine’.
Coarse FunFams in the above-described sense primarily lend themselves to broad evolutionary studies, for example, to track instances of domain shuffling (15). They are also the most intuitive kind of families in the context of a domain-based resource such as CATH-Gene3D, as they clearly focus on domain function, not whole-protein function. At the same time, applications like the detailed study of conserved residues (e.g. in active and binding sites) may require the use of finer FunFams. Eventually, the choice is highly user dependent, and this realization is what governed our strategy.
As a pragmatic attempt to account for the above-described dichotomy, the current Gene3D FunFam protocol uses a hybrid approach: FunFams are first identified in a given superfamily using the latest supervised protocol, including the detection of chaining. As the latter feature is still somewhat experimental, and as finer families may sometimes be required regardless of whether domain function is conserved (see above), a second set of families (‘FineFams’) is then identified, using the original unsupervised protocol. For this, a generic threshold setting of 1e−10 E-value (16) was determined in benchmarking EC4 conservation on over 400 enzyme-domain containing superfamilies in Gene3D (data not shown), underlining the focus on whole-protein function at this level. Whenever no high-quality GO annotation data are available for a superfamily, only the FineFam layer is generated.
PROVIDING MANAGEABLE MULTIPLE SEQUENCE ALIGNMENTS
Some FunFams are highly populous, with many sequences and structures. We are able to generate multiple sequence alignments (MSA) that have all of the domain sequences and structures classified in the superfamily. These large MSAs, however, are difficult to visualize or use for post-processing, such as for phylogentic analysis. Therefore, we have developed a protocol for providing MSAs, which represent sequence, structural, taxonomic and functional diversity, but kept within a manageable size. The FunFam MSAs generated are first filtered to remove all fragment sequences. Then an iterative process of removing sequences that share the same taxonomic, multiple domain architecture, sequence similarity (defined by commonality of UniProtKB identifier) and functional annotation to a parsimoniously chosen representative sequence is applied. The illustrative sequence is selected as the first unique occurrence of taxonomic, multiple domain architecture, sequence similarity and functional annotation. This filtering continues changing the level of taxonomic definition until the number of remaining sequences in the MSA is below 500 sequences. It is important to note that sequences where a structure is classified by CATH are preferentially retained over sequences where no structural data are available.
FUNFAM ANNOTATION SERVICE
To support user enquiries, the CATH sequence domain search facility has been extended to now provide FunFam annotations for each recognized domain. The service currently accepts single sequences in FASTA representation. Domains are identified using the in-house HMMER 3/DomainFinder protocol described in (17,18), and then submitted to a new service to determine their FunFam membership (if any). As an extra HMM search is required for each recognized domain, the service is slightly slower for a larger protein. However provided there is not a long job queue it should complete within a few seconds.
The service on the CATH front page provides a simple table of results with the domain location, superfamily code and functional family name, the last two of which are also links to the respective CATH pages. The underlying web service is hosted at http://gene3d.biochem.ucl.ac.uk/Gene3DScanSvc/FunFamScan. Search modes are provided for searching a single domain against a FunFam library, and for searching the complete protein. Currently, the complete protein service provides a ‘text/csv’ (plain text CSV file) response, whereas the domain searches can provide Javascript Object Notation (JSON) and Extensible Markup Language (XML) as well. The services are implemented using a simple RESTful interface and as such can be easily accessed programmatically or from the *Nix command line using tools like wget or curl.
INTRODUCING NEW HOMOLOGOUS SUPERFAMILY PAGES
The CATH website has undergone a significant redesign since the last release. We have continued to concentrate on the development of a single web-based portal for CATH and Gene3D, and on the development of improved web pages displaying the functional data and conserved sequence features associated with FunFams in each superfamily.
The new superfamily pages give a wealth of structural and functional information about the family in an easily accessible format. Some pages will be presented below for a highly populated and functionally diverse superfamily in CATH—the class 1 aldolase superfamily (CATH code 3.20.20.70) - members of which adopt a TIM barrel alpha/beta structure.
Figure 1 shows a snapshot of the re-designed superfamily page for this superfamily. Statistics for the superfamily are given on the right hand side of the page and section (a) confirms that it is highly populated, with 119 sequence families (clustered at <35% sequence identity) and a total of 2559 domains. An indication of structural diversity in the aldolase superfamily is shown in section (b); the user is given the option of scrolling though the smallest, largest and representative structure (according to the number of residues) within the aldolase superfamily. There is considerable functional diversity across the superfamily with a total of 445 unique GO terms and 233 unique EC terms [see section (c) and (d) on the superfamily homepage]. Species diversity is shown in section (e) revealing that this superfamily is found in all kingdoms of life.
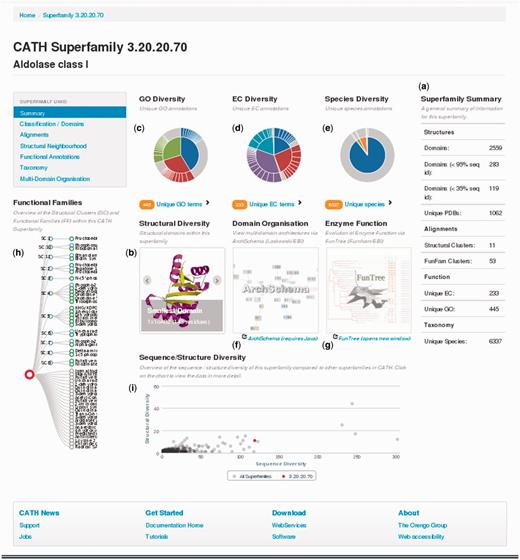
Screenshot of the CATH superfamily page for the aldolase superfamily. Sections displaying different types of data are labelled (a)–(i).
Sequence diversity across a superfamily correlates with structural diversity of relatives and also functional diversity (see Figure 2). If we examine CATH enzyme superfamilies, Figure 2 shows that the majority of superfamilies in CATH (∼90%) have <10 sequence subfamilies (at 30% sequence identity) and 10 enzyme functions, whereas some of the remaining superfamilies (<5%, corresponding to <100 superfamilies) can diverge significantly in sequence, structure and function. The new superfamily pages have been designed to improve the presentation of information on this diversity, particularly by capturing more informative data for functional families within each superfamily.
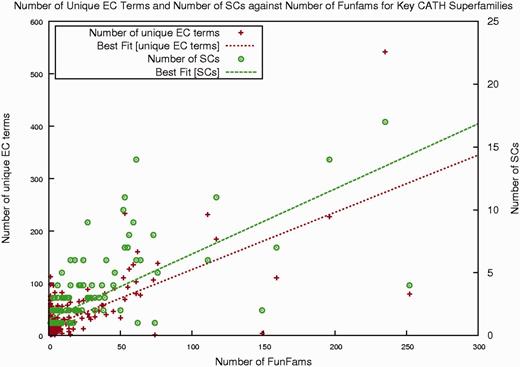
Plot showing, for each enzyme superfamily in CATH, the number of unique EC terms, FunFams and SCs.
Clicking on the EC link on the superfamily home page [see section (d), Figure 1] gives a listing of enzyme functions exhibited by different relatives in this superfamily. About 35% of enzymes with the aldolase class I superfamily are lyases. Other enzyme types include transferases (∼26%), isomerases (19%), and oxidoreductases (∼19%). Fructose-bisphosphate aldolase (EC number 4.1.2.13) is the most prevalent enzyme with 5.2% of all enzymes in this superfamily. Fructose-bisphosphate aldolase catalyses the reversible reaction that splits fructose 1,6-bisphosphate into dihydroxyacetone phosphate and glyceraldehyde 3-phosphate. This is observed in Glycolysis, Gluconeogenesis and the Calvin cycle (20). Another prevalent enzyme is Orotidine 5′-phosphate decarboxylase (EC number 4.1.1.23), an enzyme that catalyses the last step in the de novo biosynthesis of pyrimidines (19).
Section (h) on the superfamily home page (see Figure 1) lists all the FunFams that are identified for this superfamily using the FunFam classification method described above. By mousing over each node, it is possible to see a functional description of the FunFam. As the names describing each functional family can be long, we provide abbreviated FunFam names, which are simply the first eight characters of the GO annotation associated with the majority of relatives in the FunFam.
FunFams are also grouped into structural clusters if their structures can be superimposed within an Root Mean Squared Deviation (RMSD) threshold of 9 Å. Again section (h) shows the nodes associated with structural clusters in the superfamily. Mousing over these nodes shows a summary of information. A multiple structural alignment is also viewable together with a 2DSEC plot (21) showing common secondary structure features and a JMol superposition of the representatives from each FunFam (see Figure 3).
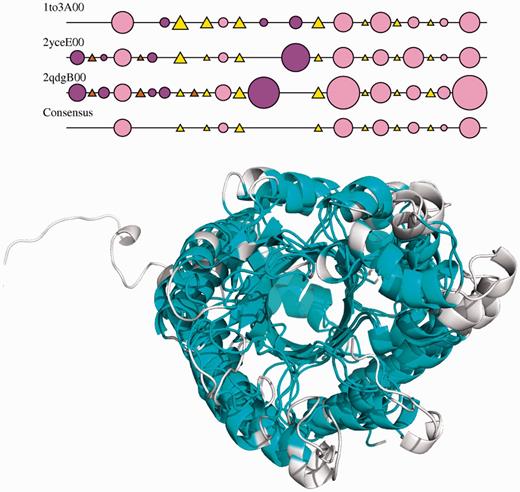
2DSEC plot and structural superpositions of the structural representatives of a structural cluster in the aldolase superfamily. Structural features common to all the domains in the SC are shown in light blue on the superposition.
Other sections on the superfamily home page provide links to resources established at the European Bioinformatics Institute (EBI) (section f) that display information on the different multi-domain contexts in which this domain superfamily is observed [archschema section (f), Figure 1]. Section (g), Figure 1 provides a link to the FunTree (22) resource displaying phylogenetic information for enzyme superfamilies in CATH. FunTree is the product of a collaboration between the Thornton and Orengo groups and was developed and is managed by Dr Nicholas Furnham at the EBI. It links phylogenetic trees, displaying the evolution of relatives within structural clusters in a CATH superfamily, with comprehensive information on function and chemistry extracted from several resources in the Thornton Group; e.g. CSA (23) and MACIE (24).
There are 14 different structural clusters for the aldolase superfamily. Mousing over the structural cluster nodes for this superfamily shows the structural variations observed between different clusters. These are mainly different helical decorations to the eight-stranded beta barrel that forms the core of the structures in this superfamily.
USING THE CATH WEB PAGES TO EXPLORE DIFFERENCES BETWEEN FUNFAMS IN A SUPERFAMILY
To illustrate the information available through the new FunFam pages, we can compare two different FunFams within the aldolase superfamily.
FunFam ‘Delta-am’ comprises relatives that function as 5-aminolaevulinic acid dehydratases (ALAD) (EC 4.2.1.24) involved in the biosynthesis of tetrapyrroles (25). These enzymes catalyse the condensation of two 5-aminolaevulinic acid molecules to form pyrrole porphobilinogen. By contrast, FunFam ‘Tryptoph’ contains dihydroorotate dehydrogenases (DHODH) (EC 1.3.5.2) involved in the biosynthesis of pyrimidines (26).
By viewing the representatives from these FunFams, it can be seen in Figure 4 that there is a large common core between shared by structures from the two FunFams. There are some embellishments to this core in both FunFams and these lie close to the active site (see Figure 4 below).
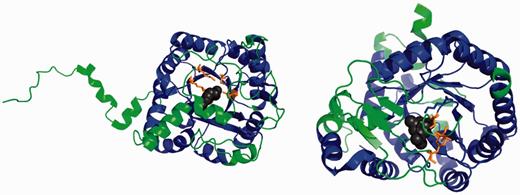
Figures showing the protein domains 1h7oA00 (ALAD, left) and 1d3gA00 (DHODH) with common structural features coloured blue, embellishments green, substrates black and catalytic residues orange.
The functional family–specific pages can be used to view differences between FunFams and known functional residues. By clicking on the FunFam node, the user is taken to a FunFam summary page displaying some similar options to the superfamily homepage [i.e. summary statistics on the number of relatives, listing of functions (GO, EC terms), species distribution]. In addition, there is a link to view a MSA for the FunFam. Alignments are generated by the FunFam classification algorithm described above. These pages also display a JMol image of a representative structure from the FunFam. There is an option to colour the residue positions in the multiple alignment and JMol image with highly conserved residues and known catalytic site residues (Figure 5). You can choose to see the 3D structure of the domain in relation to the whole protein, its chain, or on its own.
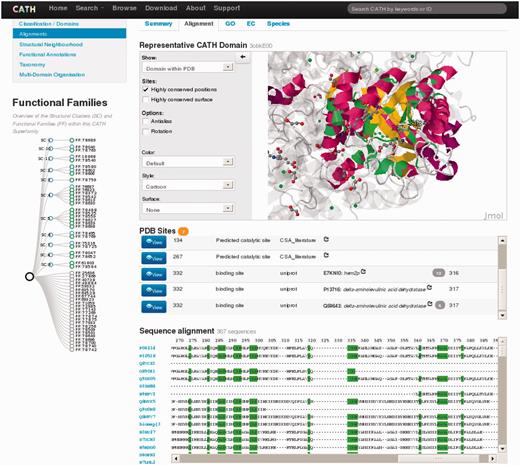
Screenshot of the FunFam page associated with ALAD.
By comparing the FunFam alignment pages for the two FunFams (‘Delta-am’ and ‘Tryptoph’) side by side on the screen, it is possible to determine if there are differences in the nature or location of catalytic residues in the active site.
To obtain a direct structural comparison between the FunFams, it is possible to submit representative structures from each FunFam to the Sequential Structure Alignment Program (SSAP) (27) server accessible through the CATH home page.
The SSAP server can be accessed at http://www.cathdb.info/cgi-bin/SsapServer.pl.
In this example, a structural alignment of the representative domains 1h7oA00 (from FunFam ‘Delta-am’) and 1d3gA00 (from FunFam ‘Tryptoph’) reveals that, although the two proteins are globally structurally similar (pairwise SSAP score of 70 of 100), their catalytic residues are in different locations within the active site pocket and have different properties (see Figure 6).
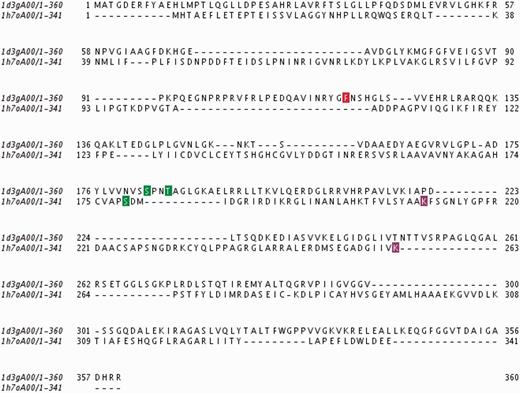
Structural alignment of the two protein domains 1h7oA00 and 1d3gA00. The catalytic residues are highlighted according to their properties (aromatic residues are in red, polar residues in green and those with a positive charge are in purple).
DETERMINING WHETHER A SUPERFAMILY IS STRUCTURALLY VARIABLE
Finally, section (i) of the superfamily home page (Figure 1) can be used to see whether a particular superfamily is highly structurally diverse. Section (i) shows a plot of sequence diversity (i.e. number of sequence clusters at 30% sequence identity) versus structural diversity (number of structural clusters) to give an indication of how diverse this superfamily is compared with others in CATH. Using the aldolase superfamily example again, the red dot highlights the position of the aldolase superfamily in the plot and mouse-overs of other points on the plot will reveal the CATH codes of other superfamilies. The aldolase superfamily is more diverse than most in CATH, but is not as diverse as some of the most highly populated superfamilies adopting Rossmann and immunoglobulin folds.
SUMMARY
In summary, CATH has increased in size by nearly 50% since publication of our last NAR update article. It now includes 1313 folds and 2626 superfamilies. Our FunFam protocol has been improved and the CATH sequence domain search facility extended to return FunFam annotations. The CATH website has been redesigned and now displays additional functional data and conserved sequence features data associated with the FunFams in each superfamily. The functionally diverse aldolase superfamily (3.20.20.70) has been used to demonstrate the functionality of the new CATH superfamily pages. A new tutorial taking the user through the new web pages can be accessed at http://www.cathdb.info/wiki.
FUNDING
BBSRC (to A.L.C., T.E.L.); MRC (to N.L.D.); Wellcome Trust (to I.S., N.F.); IMI (to J.G.L.); SNSF (to R.A.S.); NIH (to D.L., C.Y.). Funding for open access charge: Wellcome Trust.
Conflict of interest statement. None declared.
ACKNOWLEDGEMENTS
This project has been funded in whole or in part with Federal funds from the National Institute of Allergy and Infectious Diseases, National Institutes of Health, Department of Health and Human Services, under Contract No. HHSN272201200026C. RAS acknowledges funding from the Fondation du 450ème anniversaire de l’Université de Lausanne and Swiss National Science Foundation [132476 and 136477].
REFERENCES
Author notes
The authors wish it to be known that, in their opinion, the first two authors should be regarded as joint First Authors.

Comments