


Abstract
The Nucleic acid—Protein Interaction DataBase (http://npidb.belozersky.msu.ru/) contains information derived from structures of DNA–protein and RNA–protein complexes extracted from the Protein Data Bank (3846 complexes in October 2012). It provides a web interface and a set of tools for extracting biologically meaningful characteristics of nucleoprotein complexes. The content of the database is updated weekly. The current version of the Nucleic acid—Protein Interaction DataBase is an upgrade of the version published in 2007. The improvements include a new web interface, new tools for calculation of intermolecular interactions, a classification of SCOP families that contains DNA–binding protein domains and data on conserved water molecules on the DNA–protein interface.
INTRODUCTION
The Nucleic acid–Protein Interaction DataBase (NPIDB) provides an access to information about all available structures of DNA–protein and RNA–protein complexes. Almost 4000 structures of such complexes are now available in the Protein Data Bank [PDB, (1)]. The NPIDB automatically extracts data from the PDB, then the data are presented through a user-friendly interface. A number of tools for the analysis of interactions between protein and nucleic acid molecules are offered. Among the tools are the original program CluD for analysis of hydrophobic clusters on interfaces (2,3), the program hb-angles for detecting potential hydrogen bonds and water bridges and visualization of structures with Jmol (4). Both original PDB entries and biological units are available for analysis. The database includes a classification of nucleoprotein complexes based on protein domain families according to Pfam (5) and Structural Classification of Proteins [SCOP (6)].
There are a number of online databases providing information on DNA–protein or RNA–protein complexes. The 3D-Footprint (7), http://floresta.eead.csic.es/3dfootprint, contains information on DNA–protein complexes. Its functionality partially overlaps the functionality of the NPIDB. Among the differences, we would like to mention the following. Inter-molecular interactions in the 3D-Footprint are visualized as a number of schematic pictures, while the NPIDB provides visualization of interactions with Jmol. Parts of biological units that are not presented explicitly in a PDB entry and should therefore be reconstructed by symmetry are not taken into account in the 3D-Footprint. On the other hand, the 3D-Footprint contains comparative information on DNA–protein interfaces, providing, for example, a dendrogram of similar interfaces, position weight matrices illustrating the binding specificities and other tools. It also allows searching the DNA sequence motifs recognized by DNA-binding proteins.
The Protein-DNA Interface Database [PDIdb (8)], http://melolab.org/pdidb/web/content/home, contains descriptions of DNA–protein interfaces for 922 X-ray DNA–protein complexes with resolution better than 2.5 Å (the NPIDB contains 1193 such complexes). These complexes are partitioned into several classes according to function of proteins, the classes are further divided into types. For each complex, information on different types of contacts can be visualized or downloaded as a text table. The PDIdb does not contain information on protein domains.
The Protein-RNA Interface Database [PRIDB (9)], http://bindr.gdcb.iastate.edu/PRIDB, contains structural information on RNA–protein complexes.
Biological Interaction Database for Protein-Nucleic Acid [BIPA (10)], http://mordred.bioc.cam.ac.uk/bipa/, contains both DNA–protein and RNA–protein complexes. There is information on SCOP domains and different types of contacts. At the moment, the total number of complexes in the BIPA is 2570 (the NPIDB contains 3846 complexes). Biological units are not presented. Information on inter-molecular contacts is presented in graphical mode only, not in a parsable format.
Web Server of Protein-DNA Complex Structure Analyzer [WebPDA (11)], http://bioinfozen.uncc.edu/webpda/, contains data on contacts between DNA and protein molecules in DNA–protein complexes. Contacts are presented both via an online Jmol applet and in a parsable text format. Biological units are taken into account.
The Protein-DNA Recognition Database (http://gibk26.bio.kyutech.ac.jp/jouhou/3dinsight/recognition.html) consists of three main parts: the Protein-Nucleic Acid Complex Database (ProNuC), the Database of Base-Amino Acid Interactions (BAInt) and the Thermodynamic Database for Protein-Nucleic Acid Interactions [ProNIT, (12)]. The ProNuC allows searching over protein–DNA complexes by PDB code, name of protein, type of DNA-recognizing motif and some other features. The BAInt allows finding information on interaction of amino acids of a certain type (e.g. lysine) with DNA nucleotides of a certain type. The ProNIT contains information on experimentally obtained thermodynamic parameters of DNA–protein complexes.
The Nucleic Acid Database [NDB (13)], http://ndbserver.rutgers.edu/, is focused on structure of nucleic acid molecules, not on their interaction with proteins.
The first description of the NPIDB was published in 2007 (14). The database was used in several studies (e.g. 15–17). Since 2007, the web interface was significantly improved. The updating system was entirely renewed. A number of new features were added, among them: (i) a new search engine; (ii) improved storage and visualization of different kinds of nucleic acid–protein interactions; (iii) detection of Pfam domains in new entries with HMM profiles; (iv) classification of DNA–protein interaction modes; and (v) information on conserved water molecules at protein–nucleic acid interfaces.
DATABASE CONTENT
Structures of protein–nucleic acid complexes are extracted from the PDB as files in PDB format representing both PDB entries (asymmetric units) and biological units. For each biological unit of X-ray files and for first models of nuclear magnetic resonance files, interactions between the protein and DNA or RNA are computed and stored. The interactions of three kinds are considered, namely, hydrogen bonds, hydrophobic interactions and water bridges (water molecules that form hydrogen bonds both with protein and DNA).
For each protein chain, its secondary structure is detected by Stride (18) and stored in the database. Each protein chain of each structure is analysed to identify Pfam and SCOP domains (5,6). Pfam domains are determined by means of hidden Markov model (HMM) profiles of the Pfam database. The profiles are downloaded from the Pfam ftp site (ftp://ftp.sanger.ac.uk/pub/databases/Pfam/current_release). To search Pfam domains in the sequences, HMMER (19) software downloaded from the web site (http://hmmer.janelia.org/) and the PfamScan script (ftp://ftp.sanger.ac.uk/pub/databases/Pfam/Tools/PfamScan.tar.gz) are used, according to the PfamScan protocol (see ftp://ftp.sanger.ac.uk/pub/databases/Pfam/Tools/README). The E-value threshold is set to 0.001.
Information on SCOP domains is extracted by Perl scripts from SCOP parsable files (http://scop.mrc-lmb.cam.ac.uk/scop/parse/index.html), release 1.75.
For each (Pfam or SCOP) domain, a structure file in PDB format is created. This file contains description of the domain itself and of segments of nucleic acid chains that are in contact with the domain. Sets of representatives of Pfam and SCOP families (one complex for each family containing at least one domain with a known X-ray structure) are created and stored. These representatives are chosen from the complexes with best resolution among all complexes representing each particular family.
The NPIDB database contains comparative structural information on some SCOP families. Namely, there are 1847 SCOP domains in contact with double-stranded DNA with at least 10 complementary base pairs. Those 1847 domains represent 110 SCOP families. For each of these 110 families, all their representatives were extracted from the PDB, including those that were solved in the absence of DNA.
All structures of each family are spatially superimposed. For the superposition, the service PDBeFold [Protein structure comparison service Fold at European Bioinformatics Institute, http://www.ebi.ac.uk/msd-srv/ssm, (20)] was used. In a number of cases, the result of superposition was regarded as unsatisfactory. Finally, the database now contains superpositions for 73 families. Some families were divided into subfamilies; this was done if it was impossible to superimpose the entire family with an appropriate quality. For each superimposed set of protein chains, the sequence alignment generated by PDBeFold is stored.
The superimposed families are partitioned into interaction classes according to the modes of their DNA–protein interaction. The definition of each interaction class takes into account, first, the part of DNA involved into the interaction and specificity of contacts, namely, specific contacts through major groove, specific contacts through minor groove or non-specific contacts, and, second, the contacting elements of protein secondary structure, namely, alpha helices, beta strands and other chain segments called ‘loops’. To determine the interaction class of a family, we determine, first, the main DNA groove (major or minor) involved in specific interaction, and, second, the secondary structure elements involved in specific interaction with the main groove. At this step, a human judgement is essential in a number of cases because family representatives may vary in minor additional interactions. Thus, we have the following groups of families: (i) the main groove is the major one, and the elements are helices only; (ii) the main groove is the major one, and the elements are helices and loops and so on. There are two grooves and seven possible combinations of three secondary structure elements; hence, there are 14 possible groups. At the moment, each of these 14 groups is divided into two classes, depending on presence or absence of small specific interaction via the other, not the main one, DNA groove. Additionally, there are two more interaction classes: one, with almost equal role of both grooves in specific interaction, and, second, with non-specific contacts only. Altogether, there are 30 possible classes, but only 20 classes are really represented by DNA-recognizing protein domains. Among these 20 classes, three classes contain >10 families. A total of 13 families belong to the class ‘main specific contacts via the DNA major groove, some specific contacts via the DNA minor groove, contacting protein elements: helices and loops’, 12 families belong to the class ‘main specific contacts via the DNA major groove, some specific contacts via the DNA minor groove, contacting protein elements: helices’, 11 families belong to the class ‘specific contacts via the DNA major groove only, contacting protein elements: helices’. Some classes contain only one family each, for example, the class ‘specific contacts via the DNA major groove and the DNA minor groove in almost equal level’ contains only the family ‘T-box’, with two structures. Ten classes are not presented at all, among them are eight classes where beta strands, but not loops, are involved, and also the classes where specific contacts are with the DNA minor groove only and among the contacting elements are helices and loops together. The list of interaction classes is available on the NPIDB web site. For each interaction class, a set of representatives of families of the type (the subset of best resolution representatives of all SCOP families) is available.
For the 73 superimposed families of DNA-binding protein domains, information on conserved positions of water molecules at DNA–protein interface is computed with the wLake program (21) and stored in the NPIDB. Water-mediated contacts play an essential role in recognition of DNA by proteins. Information about water molecules in PDB files is usually less precise and less confident than analogous information about atoms of protein or DNA. However, if a water molecule is presented in several structures of a same complex or a number of closely related complexes in approximately same place, then this molecule can be considered as confident and important. That is why we revealed so-called ‘conserved water bridges’ that are water molecules at DNA–protein interfaces in similar complexes that approximately coincide after superposition of macromolecules. A detailed description of the procedure that reveals conserved water bridges is given in (21). In brief, the procedure is as follows. As an input, the procedure uses a set of superimposed structures of protein domains from the given family. Thus, a set of similar structures placed in a common coordinate space is analysed. A conserved water bridge is a set of water molecules from different structures such that: (i) the distance between any two water oxygen atoms in the common space is <1.5 Å; (ii) each water molecule is closer than 5 Å to a DNA atom from the same or other structure; and (iii) each water molecule is closer than 5 Å to a protein atom from the same or other structure. Lists of conserved water bridges and their visualization are available at pages of correspondent SCOP families.
For a number of Pfam families (‘Hom_end’, ‘Homeobox’, ‘Ets’ and some other), a manually created description of their interaction with DNA is available.
All structural files of the NPIDB are downloadable, as well as tables of structures, domain families and interactions. Update of the content is performed weekly by a special program module.
SOFTWARE
A Perl script identifies chains of DNA, RNA and protein directly in the coordinate (‘ATOM’ and ‘HETATM’) section of a PDB file. If a PDB file contains at least one protein chain and at least one nucleic acid chain, then it is selected for incorporating into the NPIDB.
The search engine allows searching entries according to the following criteria: PDB ID, year of deposition in PDB, keywords (‘HEADER’, ‘TITLE’ and ‘ORGANISM’ fields of the PDB), experimental method, resolution and type of the nucleic acid (DNA, RNA or hybrid).
For storing derived data, a relational database under MySQL is used. The data include headers, titles and creation dates of PDB entries, types of chains, secondary structure of protein chains, data on protein–nucleic interaction and coordinates (start–end) of SCOP and Pfam domains in protein chains. The main part of information is stored as files in PDB format. Also, the database contains sequence files in fasta format and output files of Stride and the programs computing interactions. Perl and Python scripts are used for regular update of the content of the relational database and collection of data files. Other scripts generate dynamic web pages using data both from the relational database and from the data files.
Hydrogen bonds and water bridges calculations are based on a statistical potential derived from analysis of all available 3D structures of macromolecules. The potential for a hydrogen bond is the product of three factors: the first factor depends on the distance between the centres of the donor and acceptor atoms; the second factor depends on the angle formed by the donor, the acceptor and the covalently bound neighbour of the donor; the third factor analogously depends on the angle formed by the donor, the acceptor and the covalently bound neighbour of the acceptor. The exact formulas are available on the web site. A hydrogen bond is detected if the potential is >0.1, and the distance between the centres of the donor and acceptor atoms is <3.7 Å. A water bridge is detected if there exists a water molecule that forms hydrogen bonds both with the protein molecule and the nucleic acid molecule. The program hb-angles performing the computations is written in C.
For interactive visualization of individual hydrogen bonds and water bridges, JavaScript is used.
The program CluD (2,3) for detecting hydrophobic clusters in macromolecular structures is integrated into the NPIDB. The main principle of the program is obtaining clusters of hydrophobic atomic groups (such as methyl groups of thymine or threonine) that fill some volume and thus displace the solvent. Thus, CluD outputs hydrophobic clusters rather than pairwise residue-to-residue hydrophobic interactions. The clusters may include atoms not only from entirely hydrophobic residues (e.g. leucine) but also from hydrophobic parts of side chains of lysine, glutamine and so on. The main optional parameter of CluD is the threshold for the distance between centres of hydrophobic groups (that are carbon and sulphur atoms); at the moment, the threshold is set to 5.4 Å, which is the theoretically maximal distance allowing two non-polar groups to displace a water molecule (it is the sum of two van der Waals radii of methyl groups and the diameter of a water molecule).
WEB INTERFACE DESIGN
There are four entry points to the content, namely, the list of all complexes, the list of Pfam families, the list of SCOP families and the list of interaction classes of DNA-recognizing SCOP domains.
The list of complexes is designed as a table with the columns: ‘PDB ID’, ‘Date’ (the date of deposition to the PDB), ‘PDB header’, ‘Experimental method’, ‘Resolution’ and ‘Kind’ (type of the nucleic acid: DNA, RNA or hybrid). The table can be sorted according to any column with a click on the column header. Each table row is a hyperlink to the page of the corresponding entry.
The page of each entry contains the following sections (Figure 1): For each biological unit, there are pages with information on interaction between molecules of the nucleic acid and the protein. Three types of interaction are presented, namely, hydrogen bonds (Figure 2), water bridges and hydrophobic interactions. The information is presented as interactive Jmol visualization and as downloadable text tables.
General information (PDB ID, Title, PDB header, Date, Experimental method, Resolution, Type of nucleic acid and Organism);
Quick links to other databases;
Composition of the PDB entry and biounits: chains of the protein and the nucleic acid and models;
Lists of Pfam and SCOP domains presented in the entry;
Sequences of the chains with additional information: secondary structure and contacts with the nucleic acid for the protein chains and contacts with the protein for the nucleic acid chains.
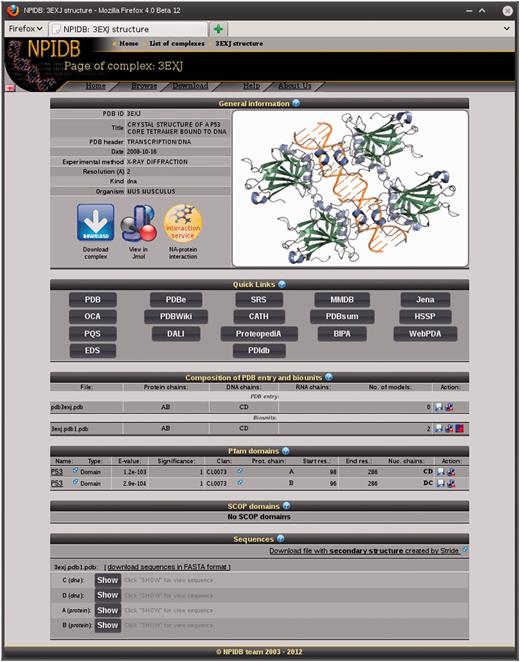
A screenshot of the page of the complex 3EXJ.
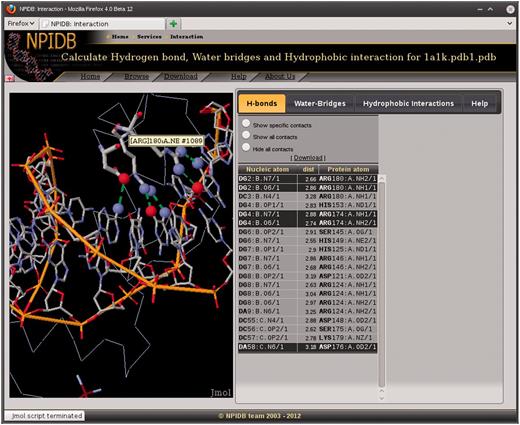
A screenshot of the page that shows hydrogen bonds in the complex 1A1K.
The list of Pfam families is a table with the columns: ‘Pfam ID’, ‘Domain’ (short description of the family from Pfam), ‘number of entries’ (number of complexes with representatives of the family), ‘number of domains’ (number of domains from the family in all complexes), ‘number of bound domains’ (number of domains bound to DNA or RNA). Each row is a hyperlink to the page of the family. The page of each family contains the list of entries (with hyperlinks to entries’ pages). For a number of families (for example, for ‘Ets’), hyperlinks to detailed descriptions are available.
The list of SCOP families is designed as a tree of SCOP classes, folds, superfamilies and families. A hyperlink from each family name leads to a page containing a table analogous to a table of a Pfam family, and, for a number of families of DNA-recognizing domains contacting with a long (>10 bp) double-stranded DNA, a description of the family. The description includes a structural superposition of all representatives of the family in the PDB, the corresponding multiple amino acid sequence alignment and an information on conserved water bridges on the protein–DNA interface.
The list of interaction classes of DNA-recognizing SCOP domains contains hyperlinks to lists of SCOP families whose representatives demonstrate the certain mode of DNA–protein interaction.
FUNDING
Russian Foundation of Basic Research [grant 10-07-00685-a and joint grant with German Research Foundation 11-04-91340]; Ministry of Education and Science of the Russian Federation [State Contract No. 07.514.11.4006]. Funding for open access charge: Lomonosov Moscow State University.
Conflict of interest statement. None declared.
ACKNOWLEDGEMENTS
The authors thank Alexey Salnikov for participation in creating the new version of the program CluD, which is used for calculation of hydrophobic interactions between macromolecules, Elena Denisenko for participation in creating the program hb-angles, which is used for determining hydrogen bonds and water bridges and Mikhail Roytberg and Alexander Grishin for help in preparing the manuscript.

Comments