


Abstract
Left ventricular hypertrophy is causally implicated in the high risk of death and heart failure (HF) in chronic kidney disease (CKD) patients. Whether the left ventricular mass index (LVMI) adds meaningful predictive power for mortality and de novo HF to simple risk models has not been tested in the CKD population.
We investigated this problem in 1352 CKD patients enrolled in the Chronic Renal Insufficiency Cohort (CRIC). LVMI was measured by echocardiography and the risks for death and HF were estimated by the Study of Heart and Renal Protection (SHARP) score, a well-validated risk score in CKD patients.
During a median follow-up of 7.7 years, 326 patients died and 208 had de novo HF. The LVMI and the SHARP score and a cross-validated model for HF (CRIC model) were all significantly (P < 0.001) related to the risk of death and HF. LVMI showed a discriminatory power for death (Harrell’s C index 66%) inferior to that of the SHARP score (71%) and the same was true for the risk of HF both in the test (LVMI 72%, CRIC model 79%) and in the validation cohort (LVMI 71%, CRIC model 74%). LVMI increased very little the discriminatory (2–3%) and the risk reclassification power (3.0–4.8%) by the SHARP score and the CRIC model for HF for the same outcomes.
In CKD, measurement of LVMI solely for the stratification of risk of death and perhaps for the risk of HF does not provide evident prognostic values in this condition.
INTRODUCTION
Alterations in left ventricular (LV) mass and structure are a hallmark in animal models of mild [1] and advanced [2] chronic kidney disease (CKD). In living kidney donors, LV mass shows a mild increase 1 year after kidney donation [3, 4], at the time when the glomerular filtration rate (GFR) measured by chromium-51-labeled ethylenediaminetetraacetic acid clearance [3] or estimated by the Chronic Kidney Disease Epidemiology Collaboration (CKD-EPI) creatinine equation [4] is ∼30% lower than prior to donation. In CKD patients without heart failure (HF), the prevalence of LV hypertrophy (LVH) is increasingly greater comparing Stage G2–Stage G5 CKD, further supporting the importance of renal dysfunction in the development of LVH [5]. LVH in CKD also predicts incident HF and death even after adjustment for major cardiovascular risk factors and cardiac biomarkers such as brain natriuretic peptide and troponin T [6].
Current guidelines recommend considering echocardiography to refine cardiovascular (CV) risk assessment in hypertensive patients [7]. However, there are few studies in hypertensive patients examining the added value of echocardiography in addition to established risk scores based on classical risk factors like the Framingham score or SCORE [8]. Similarly, the presence of LVH is held as a useful measurement for risk stratification in CKD patients, and some investigators have suggested that the measurement of LV mass index (LVMI) should be periodically performed in these patients [9]. Although the causal role of LVH for the risk of HF and cardiovascular disease (CVD) in pre-dialysis CKD patients is beyond question, the prognostic value of this biomarker in the CKD population remains undefined because there is still no study investigating the prognostic value of LVM by applying risk discrimination [10] and re-classification analyses [11] and calibration [12]. A recent study in two European cohorts of end-stage kidney failure patients on haemodialysis [13] demonstrated that the measurement of LVMI fails to add predictive power to statistical models based on simple, easily available clinical parameters in this population. Since observational studies are population specific, the question of whether the measurement of LV mass may be useful for predicting clinical outcomes in the pre-dialysis CKD population needs to be specifically tested in the same population.
To be adopted in every day clinical practice, a given candidate prognostic biomarker, such as LVMI, should provide prognostic information beyond and above that provided by well-validated and simple risk prediction rules [14]. The Study of Heart and Renal Protection (SHARP) CKD-CVD risk calculator (available at http://dismod.ndph.ox.ac.uk/kidneymodel/app/) was developed in 9270 patients with moderate–severe CKD and validated in three external CKD cohorts [15], which provides reliable estimates of the death probability within 5 and 10 years by using simple and easily available risk factors.
In this study we investigated whether LVMI adds prognostic information to the risk estimates made by the SHARP risk calculator for predicting all-cause mortality and to a simple risk model for HF built within the Chronic Renal Insufficiency Cohort (CRIC) database, an ongoing multicentre cohort study including a large number of CKD patients with various degrees of renal dysfunction, who were enrolled between June 2003 and August 2008 from seven clinical centres in the USA [16].
MATERIALS AND METHODS
The study protocol of the CRIC study was approved by the institutional review boards at participating institutions and the research was conducted in accordance with the ethical principles of the Declaration of Helsinki.
Patients
The CRIC study was designed as a prospective cohort of approximately 3600 patients with mild–moderate CKD who were enrolled through seven clinical centres in the USA [16, 17]. Eligibility and exclusion criteria of the CRIC study are given in Supplementary data, Table S1.
Echocardiography
Echocardiograms were performed at 1 year after enrolment using standard techniques to acquire optimal views of cardiac function. Images were transferred to the core echocardiography laboratory (University of Pennsylvania), where they were read by a registered diagnostic cardiac sonographer according to the guidelines of the American Society of Echocardiography [18]. Readers were blinded to participants’ baseline estimated GFR (eGFR). LVMI was derived by the area length method and indexed to height2.7. According to the scope of this study, only CRIC patients of with available echocardiographic data were retained in the analysis (see Figure 1). In a sensitivity analysis, we also considered the additional prognostic value of LV ejection fraction and the E/A ratio as indicators of LV systolic and diastolic function, respectively.
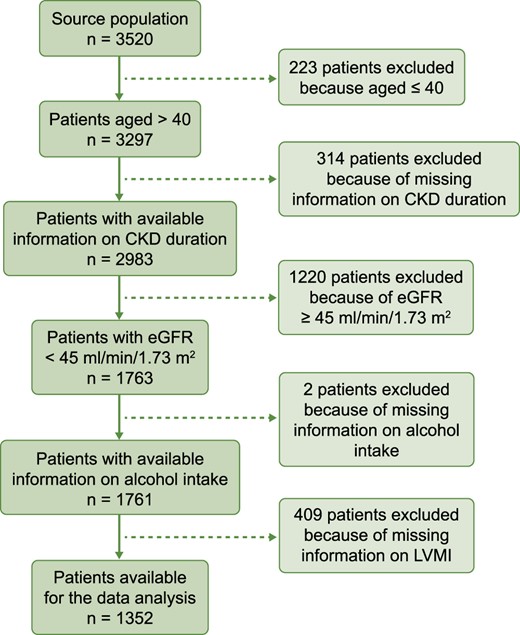
Flow of patients across the study.
Laboratory and blood pressure (BP) data
Samples for cystatin C were processed using a Siemens BNII nephelometer at the CRIC Central Laboratory, with an intra-assay coefficient of variation of 4.9%. eGFR was calculated from serum cystatin and creatinine using the CRIC study equation [19]. Biomarker assays for lipids, haemoglobin, phosphate, calcium, glucose, high sensitivity CRP and serum albumin were performed at the CRIC Central Laboratory at the University of Pennsylvania. BP was averaged over three measurements performed in a standardized fashion in a seated position at rest using a calibrated sphygmomanometer.
SHARP risk score calculator
The SHARP risk calculator permits the calculation of 5- and 10-year estimated death probability in Stages 3b–5 CKD patients >40 years of age [15]. The SHARP risk estimates are calculated conditional on age, gender, ethnicity, education, adult dependence, smoking, alcohol intake, body mass index (BMI), BP, high-density lipoprotein cholesterol, albumin, haemoglobin, phosphate, urinary albumin:creatinine ratio, background CV comorbidities, diabetes, CKD stage, CKD duration and type of nephropathy. For the purpose of this study, patients with missing values for at least one of these variables were excluded from the analysis (see Figure 1).
Follow-up study
The primary outcome was overall mortality, which was assessed over a median of 7.7 years of follow-up [interquartile range (IQR) 6.5–8.7 months]. HF (i.e. the secondary study outcome) was identified by asking study participants every 6 months if they were hospitalized, and selected hospitals or healthcare systems were queried for qualifying encounters. The first 30 discharge codes were identified for all hospitalizations, and codes relevant to HF resulted in the retrieval of medical records by study personnel for centralized adjudicated review. At least two study physicians reviewed all possible HF events using medical records and guidelines on clinical symptoms, radiographic evidence of pulmonary congestion, physical examination of the heart and lungs and, when available, central venous haemodynamic monitoring data and echocardiographic imaging. HF was confirmed when both reviewers agreed based on modified clinical Framingham criteria [20]. The follow-up time in the survival analysis started from the date of the echocardiographic assessment. Patients’ follow‐up was ended at the time of HF (for incident HF only), death, withdrawal, loss to follow‐up or the end of the follow‐up period, whichever occurred first. For both all-cause mortality and HF, withdrawal, loss to follow-up and the end of the follow-up period were censoring events. For HF, death prior to the occurrence of HF was a competing event.
Statistical analysis
Normally distributed continuous variables were expressed as mean ± SD, non-normally distributed continuous variables as median and IQR and binary variables as absolute frequency and percentage. The interrelationship between the SHARP risk scores (at 5 and 10 years) and LVMI was investigated by Spearman’s correlation coefficient (ρ), and the P-value and shared variance between these two variables was assessed by calculating R2.
To examine the additional prognostic values of LVMI for all-cause mortality and for HF, we randomly split the study cohort into a testing cohort and a validation cohort with a ratio of 1:1. The independent relationship between the incidence rate of all-cause mortality with the SHARP risk scores (i.e. 5-year and 10-year estimated death probabilities) and LVMI was investigated by univariable and multivariable Cox proportional hazards models in the testing cohort. In the Cox models, associations were expressed as hazard ratios (HRs) along with their 95% confidence intervals (CIs) and P-values.
The additional prognostic value of LVMI for all-cause mortality over that provided by the SHARP risk scores was investigated by discrimination [Harrell’s C (HC) index] [10], calibration [12] and risk reclassification [integrated discrimination improvement (IDI)] [11] metrics.
Because no specific risk calculator is available to predict the risk for HF in CKD patients, to estimate the additional prognostic value of LVMI to predict such an outcome, we developed a mechanistic model of HF within the CRIC in the testing cohort and evaluated the additional prognostic value of LVMI in the validation cohort. Because of the presence of the competitive risk of death prior to HF, the subdistribution hazards models (i.e. Fine and Gray’s models) were adopted [21]. We built a mechanistic model based on variables (listed in Table 1) related to the study outcome with P < 0.05 in univariate sub-distribution hazards models in the testing cohort; i.e. age, BMI, diabetes, systolic BP, haemoglobin, albumin, triglycerides, phosphate, eGFR, CV comorbidities and history of atrial fibrillation, and referred to this model as the CRIC model. Associations were expressed as subdistribution HRs (SHRs) along with their 95% CIs and P-values. We examined whether LVMI holds additional prognostic value for predicting HF using the CRIC model in the validation cohort. All the analyses were performed using Stata/IC 13.1 for Windows (StataCorp, College Station, TX, USA).
Patients’ demographic, clinical and biochemical characteristics at the beginning of the follow-up
| Variables | Whole cohort | Test cohort | Validation cohort |
|---|---|---|---|
| (n = 1352) | (n = 676) | (n = 676) | |
| Age (years) | 61 ± 9 | 61 ± 9 | 62 ± 9 |
| Male gender, % | 51 | 51 | 51 |
| Diabetic, % | 55 | 53 | 57 |
| Ex-smokers, % | 44 | 43 | 46 |
| Current smokers, % | 16 | 17 | 14 |
| Alcohol drinkers, % | 53 | 52 | 54 |
| BMI (kg/m2) | 32 ± 8 | 32 ± 8 | 32 ± 8 |
| CKD duration (years) | 3 ± 2 | 3 ± 2 | 3 ± 2 |
| Systolic BP (mmHg) | 128 ± 22 | 129 ± 22 | 128 ± 21 |
| Diastolic BP (mmHg) | 69 ± 12 | 69 ± 13 | 68 ± 12 |
| On antihypertensive treatment, % | 97 | 97 | 97 |
| On statins, % | 66 | 67 | 65 |
| Haemoglobin (g/dL) | 12.3 ± 1.7 | 12.4 ± 1.7 | 12.2 ± 1.7 |
| Albumin (g/dL) | 4.0 ± 0.4 | 4.0 ± 0.4 | 4.0 ± 0.5 |
| Total cholesterol (mg/dL) | 179 ± 44 | 179 ± 43 | 179 ± 45 |
| High-density lipoprotein cholesterol (mg/dL) | 48 ± 15 | 48 ± 15 | 48 ± 16 |
| Triglycerides (mg/dL) | 157 ± 103 | 155 ± 99 | 161 ± 108 |
| Phosphate (mg/dL) | 3.8 ± 0.7 | 3.8 ± 0.7 | 3.8 ± 0.7 |
| Calcium (mg/dL) | 9.3 ± 0.6 | 9.3 ± 0.6 | 9.3 ± 0.5 |
| Glucose (mg/dL) | 118 ± 54 | 116 ± 52 | 120 ± 56 |
| eGFR (mL/min/1.73 m2) | 31.6 ± 8.3 | 31.5 ± 8.4 | 31.7 ± 8.3 |
| Urine albumin:creatinine ratio (mg/g), median (IQR) | 132 (17–679) | 147 (19–690) | 120 (16–673) |
| LVMI (g/m2.7) | 68.4 ± 24.6 | 68.6 ± 25.7 | 68.2 ± 23.5 |
| CRP (mg/L), median (IQR) | 2.7 (1.1–6.4) | 2.8 (1.1–6.3) | 2.5 (1.1–6.6) |
| Diabetic nephropathy, % | 32 | 30 | 34 |
| Background CV comorbidities | |||
| Myocardial infarction/revascularization, % | 27 | 26 | 29 |
| Peripheral vascular disease, % | 10 | 11 | 9 |
| Congestive HF, % | 13 | 14 | 12 |
| Stroke, % | 13 | 14 | 12 |
| Atrial fibrillation/arrhythmia, % | 22 | 22 | 22 |
Data are expressed as mean ± SD unless stated otherwise.
RESULTS
The source population of the CRIC study included 3520 patients (Figure 1). Among these, 223 patients were excluded because they were ≤40 years of age (i.e. they were outside the age range contemplated in the SHARP risk model), 314 patients because of a lack of information on CKD duration, 1220 because of non-applicability of the SHARP risk calculator (eGFR ≥45 mL/min/1.73 m2), 2 because of missing information on alcohol intake and 409 patients because they did not undergo echocardiography to measure LVMI. Thus 1352 patients were available for data analysis (Figure 1). The main demographic, clinical and biochemical data of the whole study population as well as of patients in the test and validation cohort (for the data analysis pertaining to HF) are given in Table 1. Their mean age was 61 years, 51% were males, 55% were diabetic, 60% were smokers and 53% were alcohol drinkers. The large majority of patients were on antihypertensive treatment (97%) and 66% were on statins. BMI was 32 kg/m2 on average and BP was 128/69 mmHg. The remaining biochemical and clinical data, including background CV comorbidities, are given in Table 1. A total of 1069 patients (79.1%) had LVH by echocardiography. As shown in Supplementary data, Figure S1, the LVMI had a positively skewed distribution with a median of 64 g/m2.7 (IQR 51–81).
The 5-year death probability estimated by the SHARP risk calculator had a positively skewed distribution, with a median value of 16.6% (IQR 10.5–27.5), while the distribution of the 10-year estimated death probability was quite normal, with a median value of 41.1% (IQR 26.1–57.7) (Supplementary data, Figure S2, upper panels). The distribution of the probability for HF by the CRIC model in both the test and the validation cohort was positively skewed (Supplementary data, Figure S2, lower panel).
LVMI was directly related to both 5- and 10-year death probabilities (both ρ = 0.31, P < 0.001) and to the risk for HF as estimated by the CRIC model in both the test (ρ = 0.45, P < 0.001) and the validation cohort (ρ = 0.42, P < 0.001) (Supplementary data, Figure S3).
Prognostic score, LVMI and all-cause mortality
During follow-up [median 7.7 years (IQR 6.5–8.7)], 327 patients died [3.4 deaths/100 persons-year (95% CI 3.0–3.7)]. On univariate Cox regression analyses (Table 2), both the SHARP scores [5-year HR (1% increase in the score) 1.044 (95% CI 1.038–1.050), P < 0.001; 10-year HR (1% increase in the score) 1.035 (95% CI 1.030–1.040), P < 0.001] and LVMI [HR (1 g/m2.7 increase) 1.019 (95% CI 1.015–1.023), P < 0.001] significantly related with the incidence rate of all-cause mortality. However, the strength of the association between the SHARP risk scores and mortality did not change when the LVMI was combined with the same scores (Table 2).
Univariable and multivariable Cox proportional hazards models of all-cause mortality in the study population
| Variables (units on increase) | HR (95% CI) | P-value |
|---|---|---|
| Univariable Cox proportional hazards models | ||
| 5-year estimated death probability (1%) | 1.044 (1.038–1.050) crude | <0.001 |
| 10-year estimated death probability (1%) | 1.035 (1.030–1.040) | <0.001 |
| LVMI (1 g/m2.7) | 1.019 (1.015–1.023) | <0.001 |
| Multivariable Cox proportional hazards models | ||
| 5-year estimated death probability (1%) | 1.038 (1.032–1.045) adjusted | <0.001 |
| LVMI (1 g/m2.7) | 1.014 (1.010–1.018) | <0.001 |
| Multivariable Cox proportional hazards models | ||
| 10-year estimated death probability (1%) | 1.030 (1.025–1.035) adjusted | <0.001 |
| LVMI (1 g/m2.7) | 1.014 (1.010–1.018) | <0.001 |
The discriminatory powers of the 5- and 10-year SHARP risk scores for mortality (HC index) were identical, 71% and 71%, respectively, and higher than that provided by LVMI (66%) alone (Figure 2). The introduction of LVMI into the two Cox analyses including these two risk scores only provided a very modest increase (2%) in the discriminatory power of the same models (Figure 2).
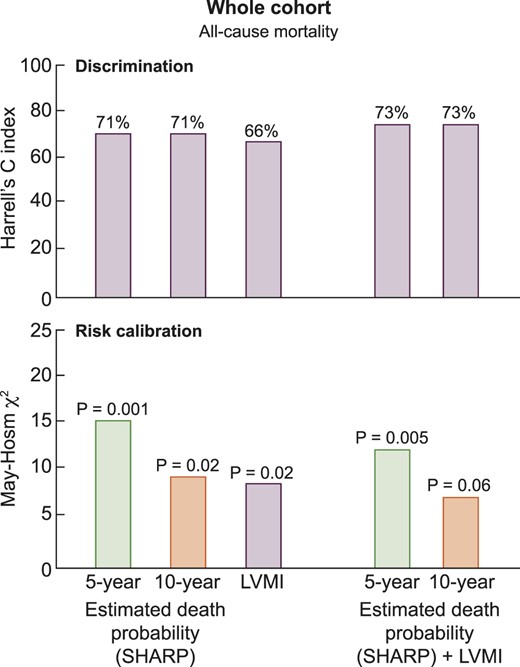
Discrimination and risk calibration abilities of prognostic estimates for death derived from the SHARP calculator, LVMI and both.
Of note, by simultaneously including LVMI, LV ejection fraction and E/A ratio into the same prognostic model, this expanded model provided an HC (67.6%) for mortality that was quite similar to that of the model based on LVMI alone (66.0%), indicating that the inclusion of LV functional parameters does not improve the prognostic value of LVMI. Similarly, the inclusion of LV systolic and diastolic function in the LVMI-based model for predicting HF produced a modest increase in the discriminatory power both in the test (HC, from 72% to 75%) and in the validation cohort (HC, from 71% to 73%), i.e. figures not superior to those provided by the SHARP risk calculator.
The additional prognostic value of LVMI as assessed by the IDI confirmed that this biomarker provides just a modest increase in prognostic accuracy over the two SHARP risk scores (model based on 5-year estimated probability of death: IDI +3.1%, P < 0.001; model based on 10-year estimated probability of death: IDI +3.0%, P < 0.001).
In calibration analyses, the unadjusted Cox models based on 5- or 10-year estimated death probability (χ2 = 15.8, P = 0.001 and χ2 = 10.3, P = 0.02, respectively) or LVMI (χ2 = 9.5, P = 0.02) produced prognostic estimates for all-cause mortality that significantly differed from the observed probabilities of the same outcome denoting poor calibration (Figure 2) and the inclusion of LVMI into the two Cox analyses based on the two risk scores did not materially improve the calibration of the same models, which remained rather unsatisfactory (Figure 2).
LVMI and the risk for HF
During the follow-up period, 208 incident cases of HF were collected: 100 cases occurred in the test cohort and 108 cases in the validation cohort. The number of deaths was 107 in the test cohort and 122 in the validation cohort. On Cox regression analyses, taking into account the competitive risk of mortality (Fine and Gray approach), LVMI was significantly related to the incidence rate of HF both in the test and in the validation cohort (Tables 3 and 4). The predictive model developed in the test cohort (Table 3) and implemented in the validation cohort (Table 4) included age, diabetes, BMI, systolic BP, haemoglobin, albumin, triglycerides, phosphate, eGFR, CV comorbidities and history of atrial fibrillation (i.e. the variables that were significantly related with the risk of HF at univariate Cox regression analyses—CRIC model). Such a model provided a discriminatory power for predicting HF of 79% in the test cohort and of 74% in the validation cohort, figures higher than those provided by LVMI alone in the two cohorts (72 and 71%) (Figure 3). The addition of LVMI to the CRIC model provided just a modest increase in the discriminatory power of the same model both in the test (from 79% to 81%, +2%) and in the validation cohort (from 74% to 77%, +3%) (Figure 3). The additional prognostic value of LVMI as assessed by the IDI confirmed a modest increase in prognostic accuracy by this biomarker over the CRIC model in the test (+4.2%, P < 0.001) and in the validation cohort (+4.8%, P < 0.001). In the test cohort, the CRIC and the LVMI-based models and even more so the CRIC model + LVMI provided prognostic estimates that substantially differed (P ranging from 0.006 to 0.09) from the observed risk, indicating poor calibration. However, in the validation cohort, the three models were all calibrated fairly well (Figure 3).
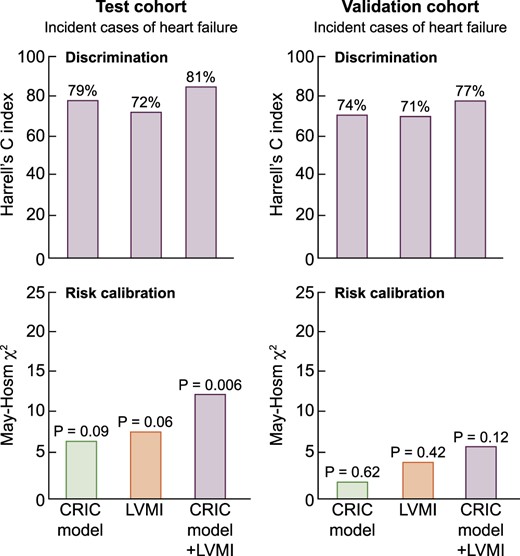
Discrimination and risk calibration abilities of prognostic estimates for HF derived from the CRIC model, LVMI and both.
Subdistribution hazards models of incident HF (n = 100) in the test cohort (n = 676)
| Variables (units of increase) | SHR (95% CI); P-value | SHR (95% CI); P-value | SHR (95% CI); P-value |
|---|---|---|---|
| LVMI (1 g/m2.7) | … | 1.020 (1.015–1.026); < 0.001 | 1.018 (1.010–1.026); < 0.001 |
| Age (1 year) | 1.02 (0.99–1.05); 0.07 | … | 1.03 (1.01–1.05); 0.04 |
| Diabetes (0 = no, 1 = yes) | 2.32(1.30–4.16); 0.004 | … | 2.43 (1.33–4.44); 0.004 |
| BMI (1 kg/m2) | 1.00 (0.98–1.03); 0.70 | … | 0.98 (0.95–1.01); 0.27 |
| Systolic BP (1 mmHg) | 1.01 (1.00–1.02); 0.05 | … | 1.01 (0.99–1.02); 0.24 |
| Haemoglobin (1 g/dL) | 0.90 (0.78–1.04); 0.17 | … | 0.93 (0.80–1.08); 0.33 |
| Albumin (1 g/dL) | 1.05 (0.63–1.77); 0.84 | … | 1.12 (0.69–1.83); 0.65 |
| Triglycerides (1 mg/dL) | 1.00 (0.99–1.01); 0.12 | … | 1.00 (0.99–1.01); 0.10 |
| Phosphate (1 mg/dL) | 1.12 (0.89–1.40); 0.35 | … | 1.15 (0.89–1.49); 0.30 |
| eGFR (1 mL/min/1.73 m2) | 0.97 (0.94–0.99); 0.01 | … | 0.97 (0.95–0.99); 0.04 |
| CV comorbidities (0 = no, 1 = yes) | 2.31 (1.48–3.60); 0.001 | … | 2.08 (1.33–3.25); 0.001 |
| Atrial fibrillation (0 = no, 1 = yes) | 1.71 (1.09–2.67); 0.02 | … | 1.60 (1.01–2.52); 0.04 |
Second column: multiple Cox model including all univariate correlates of HF but LVMI; third column: univariate Cox model including LVMI; fourth column: multiple Cox model including all univariate correlates of HF and LVMI.
Subdistribution hazards models of incident HF (n = 108) in the validation cohort (n = 676)
| Variables (units of increase) | SHR (95% CI); P-value | SHR (95% CI); P-value | SHR (95% CI); P-value |
|---|---|---|---|
| LVMI (1 g/m2.7) | … | 1.024 (1.017–1.031); < 0.001 | 1.023 (1.014–1.032); < 0.001 |
| Age (1 year) | 1.02 (0.99–1.04); 0.17 | … | 1.01 (0.99–1.04); 0.34 |
| Diabetes (0 = no, 1 = yes) | 1.84 (1.12–3.03); 0.02 | … | 1.75 (1.05–2.91); 0.03 |
| BMI (1 kg/m2) | 1.00 (0.98–1.04); 0.57 | … | 0.98 (0.95–1.01); 0.17 |
| Systolic BP (1 mmHg) | 1.00 (0.99–1.01); 0.70 | … | 0.99 (0.98–1.00); 0.13 |
| Haemoglobin (1 g/dL) | 1.04 (0.90–1.21); 0.61 | … | 1.00 (0.87–1.17); 0.95 |
| Albumin (1 g/dL) | 0.76 (0.44–1.30); 0.31 | … | 0.76 (0.44–1.29); 0.30 |
| Triglycerides (1 mg/dL) | 0.99 (0.98–0.99); 0.008 | … | 0.99 (0.98–0.99); 0.006 |
| Phosphate (1 mg/dL) | 1.11 (0.83–1.48); 0.47 | … | 1.13 (0.84–1.52); 0.43 |
| eGFR (1 mL/min/1.73 m2) | 0.96 (0.93–0.98); 0.001 | … | 0.96 (0.94–0.99); 0.006 |
| CV comorbidities (0 = no, 1 = yes) | 1.94 (1.29–2.92); 0.001 | … | 1.72 (1.14–2.58); 0.01 |
| Atrial fibrillation (0 = no, 1 = yes) | 1.99 (1.30–3.07); 0.002 | … | 1.75 (1.13–2.72); 0.01 |
Second column: multiple Cox model including all univariate correlates of HF but LVMI; third column: univariate Cox model including LVMI; fourth column: multiple Cox model including all univariate correlates of HF and LVMI.
DISCUSSION
In this study, in a large population of Stages G3b–G5 CKD patients of the CRIC, LVMI was independently associated with all-cause mortality and de novo HF but did not meaningfully improve risk prediction for these two conditions when added to clinical models. These findings suggest that measurement of LVMI by echocardiography provides a prognostic power for all-cause mortality inferior to that by a risk score based on easily available clinical information like the SHARP study risk calculator. When combined with the SHARP study score, LVMI only to a very modest degree improved the prediction of mortality by various prognostic tests, including calibration, risk reclassification and the integrated discrimination index. Overall, our analyses in the CRIC suggest that the measurement of LVMI by echocardiography solely for risk stratification in pre-dialysis CKD patients fails to provide meaningful additional prognostic value to the SHARP study risk score.
LVH is a common alteration in CKD and up to 79% of patients in the CRIC exhibited such an alteration. Previous studies in this cohort confirmed that LVMI is a powerful risk factor for all-cause mortality and progression to HF in CKD [6], supporting a causal role of LVH in the high CV risk in this population. Due to the causal role of LVH in the high risk for HF and other adverse CV outcomes, the value of LVMI for prognosis and risk stratification has long been taken for granted in studies in the general population where the analysis was based on Cox regression analysis only. These include the classic, time-honoured community study based on the Framingham cohort [22], studies in hypertensive patients [23–25], patients with coronary heart disease [26] or in the elderly population [27] and studies focusing on sudden death [28, 29]. Similarly, clinical studies focusing on LVMI in the pre-dialysis CKD population investigated the prognostic power of this parameter solely by Cox regression analysis [30, 31]. However, established causal risk factors like LVH or other major risk factors like hypercholesterolaemia are not necessarily valid prognostic factors. At the individual patient level, the prognostic power of hypercholesterolaemia (top quintile) for CV death is weak because only 15% of those who would later die of ischaemic heart disease would be identified on the basis of serum cholesterol levels [32]. By the same token, confirming previous analyses in the CRIC database [6], we found that LVMI is a highly significant predictor of all-cause death and incident HF by Cox regression analysis. However, we also found that LVMI holds very modest additional discriminant power for the identification of patients who die or develop HF during follow-up. Thus established risk factors for death and HF in the CKD population may have just weak or no predictive power for the same outcomes at the patient level. Studies aimed at establishing the value of prognostic biomarkers ought to be based on discriminant analysis and other prognostic analyses centred on patients rather than at a population level. In this study in a large CKD cohort, LVMI per se had a discriminatory power (HC index) for all-cause mortality and HF inferior to that provided by the SHARP risk score and the CRIC model and did not add clinically relevant discriminant power to that by the same risk models. Furthermore, LVMI failed to ameliorate the calibration of models for the risk of mortality and HF. Thus, in keeping with studies in the end-stage kidney disease population [13], LVMI conveys quite limited prognostic information in pre-dialysis CKD patients as well.
The low prognostic power of LVMI notwithstanding, it is important to stress that findings in this study are immaterial to the established value of echocardiographic studies in the CKD population. In the current guidelines, the presence of LVH and/or other alterations in LV mass and function represent a fundamental element for the management of patients with suspected HF [33]. However, as far as risk stratification is concerned, LVMI is outperformed by simple clinical risk scores for the risk of death like the SHARP study score and by the CRIC model for HF. Therefore nephrologists may better define the risk of death and HF by these scores rather than by measuring LVMI.
The main limitation of this study is the fact that more than half of the CRIC patients did not qualify for inclusion in the analysis and that we adopted a prognostic model for HF that we can only cross-validate within the CRIC. This model had no external validation. Thus the issue of whether LVMI adds prognostic model to the CRIC model for HF demands further testing in cohorts different from the CRIC. LVH in CKD has complex pathophysiology and needs to be interpreted in the functional scenario of the CV system rather than per se [34].
In conclusion, LVMI is inferior to well-validated clinical risk scores for the prediction of mortality in CKD. When combined with the SHARP score, LVMI improves the risk discrimination ability of this score quite modestly and fails to meaningfully improve risk calibration and reclassification. Thus it appears unlikely that the measurement of LVMI will improve stratification by risk models based on easily available clinical variables in CKD patients.
SUPPLEMENTARY DATA
Supplementary data are available at ndt online.
ACKNOWLEDGEMENTS
This study is part of the research activity of the European Cardiovascular and Renal Medicine (EURECA-m) working group of the ERA-EDTA.
CONFLICT OF INTEREST STATEMENT
None declared.


Comments