


Abstract
Slow gait speed is associated with hospitalization and death. We examined whether predialysis fluid overload contributes to gait speed impairment.
We measured predialysis gait speed at baseline and 12 and 24 months among 298 patients recruited in the A Cohort Study to Investigate the Value of Exercise in ESRD/Analyses Designed to Investigate the Paradox of Obesity and Survival in ESRD. We used multivariable linear mixed modeling to examine associations between patient data and gait speed. We then added either bioimpedance-estimated volume of predialysis fluid overload or volume of delivered ultrafiltration to ascertain whether fluid excess was associated with gait speed and its trajectory. We also tested whether fluid overload change with time was predictive of gait speeds.
The mean baseline gait speed was 1.01 m/s and it declined by an average of 0.08 m/s/year. Older age, nonwhite race, Hispanic ethnicity, diabetes, recent fall, recent hospitalization, tobacco use and lower serum albumin were associated with slower gait speed. Each liter of predialysis fluid overload was associated with a 0.02 m/s slower gait speed [95% confidence interval (CI) 0.01–0.04, P = 0.008] and 0.05 m/s additional slowing per year (95% CI 0.03–0.06, P < 0.0001). Higher ultrafiltration volumes were associated with 0.07 m/s slower gait speed per 3% body weight removed (0.002–0.14, P = 0.045) but not with gait speed trajectory (P = 0.08). Patients who increased fluid overload walked 0.08 m/s slower compared with those who decreased fluid overload (95% CI 0.003–0.15, P = 0.04).
Predialysis fluid overload was associated with slower gait speed and gait speed decline over time. Interventions that limit fluid overload may lead to improvements in physical performance.
INTRODUCTION
Patients with chronic kidney disease walk at a slower pace compared with the general population on average [1, 2]. Slow gait speed is a marker of frailty and impaired cardiorespiratory fitness and is associated with a higher risk of falls, hospitalizations and mortality [3–5]. Despite calls from patient advocacy groups for more studies into the risk factors that contribute to limitations in physical functioning among patients on maintenance dialysis [6], few studies have addressed this issue.
Cross-sectional studies have shown that lower predialysis blood pressure is associated with worse physical performance and that intradialytic hypotension is associated with a decrease in gait speed after dialysis [7, 8]. These results suggest that the maintenance of adequate systemic perfusion may be important for optimal physical performance and might support limiting intradialytic ultrafiltration to avoid hypotension. Indeed, the US Centers for Medicare and Medicaid Services is considering the inclusion of an ultrafiltration metric that tracks the number of patients in each dialysis facility receiving an ultrafiltration rate >13 mL/kg/h as part of its federal pay-for-performance end-stage renal disease (ESRD) quality improvement program [9]. However, it is also important to consider that fluid overload may impair the physical performance, and if so, strategies to avoid excessive ultrafiltration may need to be accompanied by measures to prevent volume overload.
The major goals of this study were to identify correlates of gait speed among patients on dialysis and to examine whether excess extracellular fluid before dialysis is associated with slow gait speed and with a decline in gait speed over time. Determining whether fluid-related aspects of ESRD treatment are associated with how patients function on dialysis will help clarify our future treatment goals and quality improvement strategies.
MATERIALS AND METHODS
Study design and population
We conducted a secondary longitudinal repeated measure analysis of participants recruited into A Cohort Study to Investigate the Value of Exercise in ESRD/Analyses Designed to Investigate the Paradox of Obesity and Survival in ESRD (ACTIVE/ADIPOSE) from seven dialysis facilities in the San Francisco Bay Area [10]. Adults >18 years of age were eligible if they spoke English or Spanish, had been on hemodialysis at least 3 months and were able to give informed consent. Participants were excluded if they had missing bioimpedance data or gait speed data or if they were nonambulatory at the time of the baseline visit. Patients were recruited between 2009 and 2011 and observed for two subsequent annual visits.
Demographic and clinical covariates
Demographic variables (age, sex, race, Hispanic ethnicity and years on dialysis) and social history (tobacco use, recent hospitalization and recent falls) were collected using patient reports. Vital signs, laboratory data (hemoglobin and albumin concentrations) and medical comorbidities (diabetes, heart failure and coronary artery disease) were abstracted from medical records and from the US Renal Data System Medical Evidence standard analysis files. Body mass index (BMI) was categorized as <20, 20–<25, 25–<30, 30–<35 and ≥35 kg/m2. Hemoglobin was categorized as <8, 8–<9, 9–<10, 10–<11, 11–<12 and ≥12 g/dL.
Predialysis gait speed
Our primary outcome variable was gait speed. Prior to a hemodialysis session, participants were asked to complete a timed 15-foot walk at a comfortable pace starting from a standstill. Time from starting to the finish line was recorded to the nearest 0.1 s using a stopwatch and gait speed was calculated in meters per second.
Fluid overload and ultrafiltration rate predictor variables
Study coordinators collected details about participants’ hemodialysis prescriptions and predialysis vital signs from participants’ medical charts at each annual visit. Predialysis systolic blood pressure was divided into categories of <110, 110–129 and ≥130 mmHg.
Patients were weighed before and after three consecutive hemodialysis treatments. Delivered ultrafiltration volume was calculated as the difference between a patient’s average pre- and postsession weights divided by the average postsession weight.
Statistical analyses
Patient characteristics were described using mean [standard deviation (SD)] for continuous variables and number (percentage) for categorical variables. We used a univariate linear mixed model with random patient-level effects to estimate baseline gait speed and annual rate of change in gait speed. We then added covariates including demographic characteristics, medical and social history and laboratory data to assess correlates of gait speed. BMI and laboratory data were updated at each time point.
To test our primary hypothesis, we added predialysis fluid overload as a time-updated variable to examine whether the volume of excess ECW was associated with slower gait speed. We also adjusted for predialysis blood pressure as a potential confounder associated with the degree of fluid overload and with physical performance. An interaction term that measured the change in fluid overload over time was included in our models to assess whether fluid overload was associated with a change in gait speed over time (e.g. gait speed trajectory). In secondary analyses we substituted delivered ultrafiltration volume normalized to body weight (BW) as a less rigorous but more clinically available measure of the degree of predialysis fluid overload. Lastly, we performed an alternative analysis to examine whether changes in predialysis fluid status over time were clinically meaningful. We calculated the change in excess fluid volume as the difference between baseline and follow-up volume of fluid overload. We divided the cohort into three groups at each time point: increased fluid overload (gain of >0.5 L), stable fluid overload (change between −0.5 L and +0.5 L) and decreased fluid overload (loss of >0.5 L). Starting the analysis at 12 months, we included baseline fluid overload plus an ordinal variable defined by the change in fluid status (e.g. increase, stable and decrease) from baseline to the model to test for an association with gait speed. A two-tailed P-value < 0.05 was considered statistically significant. All analyses were completed using SAS version 9.4 (SAS Institute, Cary, NC, USA).
RESULTS
Patient characteristics
ACTIVE/ADIPOSE reported that 85% of eligible patients were enrolled in the study [12]. A total of 373 patients were enrolled from San Francisco Bay Area dialysis facilities. Of these participants, 298 were ambulatory at baseline, had body composition measured and were included in this analysis (Figure 1). Table 1 shows the characteristics of the cohort at their baseline visit. The mean age of participants was 58.6 years and 66% were men. The majority of participants were nonwhite [n = 158 (53.0%)] and the median dialysis vintage was 2.5 years (25–75th percentile 1.3–4.5). Half of the patients had diabetes [n = 149 (50.0%)]; less than half had heart failure [n = 95 (31.9%)] or coronary artery disease [n = 89 (29.9%)]. Based on predialysis bioelectrical impedance measurements, participants had 2.8 L (SD 2.5) of excess fluid on average. Participants completed dialysis after having 3.3% (SD 1.6%) of their BW removed via ultrafiltration.
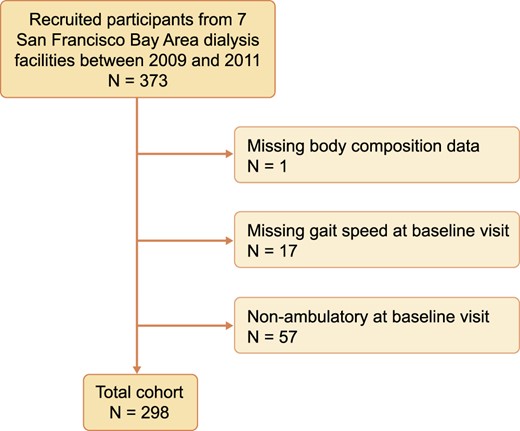
Study flow chart.
Baseline cohort characteristics (n = 298)
| Characteristics | Values |
|---|---|
| Age (years), mean ± SD | 58.6 ± 14.9 |
| Female | 101 (33.9) |
| Nonwhite race | 158 (53.0) |
| Hispanic ethnicity | 80 (26.8) |
| BMI (kg/m2) | |
| <20 | 22 (7.4) |
| 20–<25 | 102 (34.2) |
| 25–<30 | 90 (30.2) |
| 30–<35 | 54 (18.1) |
| >35 | 30 (10.1) |
| Diabetes | 149 (50.0) |
| Coronary disease | 89 (29.9) |
| Heart failure | 95 (31.9) |
| Vintage (years), mean ± SD | 3.7 ± 3.8 |
| Serum albumin (g/dL), mean ± SD | 4.0 ± 0.3 |
| Serum hemoglobin (g/dL), mean ± SD | 11.4 ± 1.2 |
| Missed dialysis session | 22 (7.4) |
| Recent fall | 94 (31.5) |
| Recent hospitalization | 130 (43.6) |
| Current tobacco use | 44 (14.8) |
Values are presented as n (%) unless stated otherwise.
Association of patient characteristics with gait speed
Among included participants, 224 had gait speed measured at 12 months (75.2%) and 183 had gait speed measured at 24 months (61.4%). Participants’ mean gait speed was 1.01 m/s (SD 0.28) at the baseline visit and gait speed declined by an average of 0.08 m/s/year (95% CI 0.06–0.10, P < 0.0001) in univariate analysis. We examined predictors of gait speed using linear mixed models (Table 2). Older age, nonwhite race, Hispanic ethnicity, diabetes, recent fall, recent hospitalization and lower serum albumin were significant correlates of slower gait speed. Ongoing tobacco use was a strong correlate of slow gait speed, as smokers walked 0.11 m/s slower than nonsmokers (95% CI 0.04–0.18, P = 0.003). After adjustment for these variables, participants had an average annual decline in gait speed of 0.07 m/s (95% CI 0.05–0.09, P < 0.0001).
Correlates of gait speed
| Predictor variables | Difference in gait speed (95% CI), m/s | P-value |
|---|---|---|
| Age, per 5 years | −0.04 (−0.03 to −0.05) | <0.0001 |
| Female | −0.05 (−0.11–0.01) | 0.08 |
| Nonwhite race | −0.08 (−0.01 to −0.15) | 0.02 |
| Hispanic ethnicity | −0.10 (−0.02 to −0.17) | 0.02 |
| BMI (kg/m2) | ||
| <20 | −0.01 (−0.12–0.10) | 0.82 |
| 20–<25 | Reference | – |
| 25–<30 | 0.01 (−0.06–0.08) | 0.83 |
| 30–<35 | −0.08 (−0.001 to −0.16) | 0.05 |
| ≥35 | −0.08 (−0.18–0.02) | 0.14 |
| Diabetes | −0.08 (−0.02 to −0.14) | 0.01 |
| Coronary disease | −0.01 (−0.07–0.06) | 0.87 |
| Heart failure | −0.01 (−0.07–0.05) | 0.74 |
| Dialysis vintage, per 5 years | −0.02 (−0.05–0.02) | 0.37 |
| Serum albumin, per g/dL | 0.06 (0.001–0.12) | 0.04 |
| Hemoglobin (g/dL) | ||
| <8 | −0.03 (−0.29–0.23) | 0.84 |
| 8–<9 | 0.03 (−0.07–0.12) | 0.55 |
| 9–<10 | −0.03 (−0.09–0.03) | 0.29 |
| 10–<11 | Reference | – |
| 11–<12 | 0.01 (−0.04–0.05) | 0.70 |
| ≥12 | −0.01 (−0.06–0.05) | 0.82 |
| Recent fall | −0.05 (−0.01 to −0.10) | 0.01 |
| Recent hospitalization | −0.06 (−0.03 to −0.10) | 0.001 |
| Current tobacco use | −0.11 (−0.04 to −0.18) | 0.003 |
BMI, serum albumin and hemoglobin were time-updated at each visit.
Association of predialysis fluid overload with gait speed
We tested the association between predialysis fluid overload and gait speed using linear mixed models that adjusted for patient characteristics and comorbid conditions. Each liter of predialysis fluid overload was associated with a 0.02 m/s slower gait speed at each time point (95% CI 0.01–0.04, P = 0.008). Higher predialysis fluid overload was also associated with slowing of gait speed over time [0.05 m/s/year for every additional liter of fluid overload (95% CI 0.03–0.06), P < 0.0001] (Table 3).
Fluid-related predictors of gait speeds
| Predictor variables | Difference in gait speed (95% CI), m/s | P-value | Change per year (95% CI), m/s | P-value |
|---|---|---|---|---|
| Predialysis fluid overload, per L | −0.02 (−0.01 to −0.04) | 0.008 | −0.05 (−0.03 to −0.06) | <.0001 |
| Ultrafiltration, per % BW | −0.02 (−0.001 to −0.05) | 0.045 | −0.02 (−0.04–0.002) | 0.08 |
| Change in fluid overload from baseline | ||||
| Increase (>0.5 L) | Reference | – | – | – |
| Stable (>−0.5–≤0.5 L) | 0.05 (−0.02–0.11) | 0.14 | – | – |
| Decrease (≤−0.5 L) | 0.07 (0.003–0.15) | 0.04 | – | – |
Adjusted for age, sex, race, ethnicity, BMI, coronary artery disease, diabetes, heart failure, vintage, albumin, hemoglobin, recent fall, recent hospitalization, tobacco use and systolic blood pressure. These predictor variables were time-updated at each visit. BW was averaged after three dialysis sessions.
We used delivered ultrafiltration volume per kilogram of BW as a secondary indicator of fluid overload in similar models. Higher ultrafiltration volume was also associated with statistically significant slower gait speed. Each percent BW removed through ultrafiltration was associated with a 0.02 m/s slower gait speed (95% CI 0–0.05, P = 0.045) (Table 3). The interaction term of time and ultrafiltration volume was not statistically significant, indicating that intradialytic ultrafiltration volume was not associated with gait speed trajectory.
In our alternative model that explicitly examined the association of changes in extracellular fluid status over time with gait speed, we found that patients whose fluid overload volume increased walked 0.08 m/s slower compared with those whose fluid overload decreased (95% CI 0.003–0.15, P = 0.04), suggesting that those with worsening control of extracellular fluid volume were at higher risk of gait speed impairment.
DISCUSSION
In this longitudinal repeated measures study of physical performance, predialysis fluid overload and increases in fluid overload volume over time were associated with slower gait speed. We tested our hypothesis by first using two predictors: direct estimation of excess extracellular fluid volume using bioelectric impedance spectroscopy and indirect estimation using average delivered ultrafiltration volume standardized to postdialysis BW over the three prior dialysis sessions. Excess extracellular fluid by both metrics was associated with slower gait speed, and bioimpedance estimated fluid overload was a statistically significant predictor of a decline in gait speed over time. We then considered changes in fluid overload volume more directly, dividing our cohort into three groups at 12 and 24 months: those whose predialysis fluid overload increased, those who remained stable and those whose fluid overload decreased. Increases in extracellular fluid overload over time were associated with slower gait speed than decreases. Collectively these findings point toward a significant impact of extracellular fluid overload on physical performance among patients on maintenance dialysis.
Age, race, ethnicity, history of diabetes, recent hospitalization and recent fall were predictive of slower gait speed. Ongoing tobacco use was a strong modifiable risk factor that was associated with slower gait speed, potentially through limitations in cardiorespiratory fitness. After adjustment for these correlates, our cohort of patients on dialysis experienced an average decline in gait speed of 0.07 m/s/year over 2 years. This rate of decline was more than double the 0.03 m/s rate observed among the fastest declining tertile of participants in the Health ABC cohort of >2300 community-dwelling individuals ages 70–79 years [13]. More rapid gait speed decline among patients on dialysis may be related to conditions common among patients with chronic kidney disease, such as sedentary behavior, lower extremity neuropathy and muscle atrophy. Our results suggest that fluid overload may also contribute to a faster gait speed decline among dialysis patients.
The harms associated with chronic accumulation of extracellular fluid and subsequent high ultrafiltration volumes with dialysis have been the topic of several recent studies that have shown powerful associations with increased mortality [14–16]. The high cardiac-related mortality observed in patients on thrice-weekly dialysis may be related to repeated ebb and flow of fluid accumulation between dialysis sessions and rapid volume removal during treatment. Our data add to this literature, addressing the impact of fluid overload on physical performance. As pulmonary edema limits cardiorespiratory reserve and excess leg swelling can slow a patient’s gait directly, fluid overload not only leads to increased mortality, it likely contributes to significant morbidity with impairments in physical functioning.
One of the strengths of this analysis is that data were from a longitudinal cohort. Repeated measures of gait speed allowed for a more robust estimation of the longitudinal association between fluid overload and gait speed. Furthermore, physical function was assessed objectively and bioelectrical impedance spectroscopy was used to estimate each participant’s degree of fluid overload.
Important limitations of our study should also be noted. The observational nature of our analysis raises the likely presence of unmeasured confounding. For example, residual renal function, a potential confounder, as it could be related to less excess fluid predialysis and to better physical performance, was not assessed. Also, gait speeds were only assessed prior to the dialysis session. Therefore these data cannot be used to assess any impact of suboptimal fluid management on physical performance in the postdialysis period.
Despite the fact that physical performance limitations present significant quality of life impairment among many patients facing kidney disease, few data are available to guide best practices to prevent declines in these patient-centered outcomes. This study identifies a potentially modifiable risk factor related to reduced health-related quality of life associated with dialysis therapy. Given that gait speed is a quantifiable patient-centered outcome, these findings may be useful in discussions with patients. Recommendations to prolong treatment sessions or to adhere to strict interdialytic dietary sodium and fluid intake restrictions may carry additional weight if directly associated with an outcome, such as physical performance, that is of great concern to patients. As interest in implementing guidelines to improve fluid management with dialysis grows [6, 17–21], clinical trials are needed to assess whether adjustments to our dialysis prescriptions may affect patients’ quality of life.
ACKNOWLEDGEMENTS
The data reported here have been supplied in part by the United States Renal Data System. The interpretation and reporting of these data are the responsibility of the authors and in no way should be seen as an official policy or interpretation of the US government.
FUNDING
This work was supported by National Institute of Diabetes and Digestive and Kidney Diseases (grants F32-DK118829, R01-DK107269 and K24-DK085153).
CONFLICT OF INTEREST STATEMENT
None declared.
REFERENCES
United States Renal Data System.


Comments