


Abstract
Background. Conventional ultrasound parameters such as the resistance index (RI) are only of limited use in the diagnosis of early allograft dysfunction. We, therefore, performed a prospective study to compare the value of ultrasound contrast media (USCM) with conventional US in the diagnosis of early allograft dysfunction.
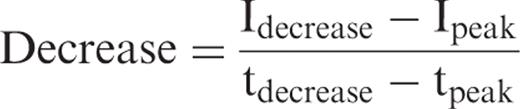
Methods. A total of 48 consecutive kidney recipients underwent US examination after USCM administration 4–10 days after transplantation. Arterial inflow was determined in the interlobar artery and renal cortex using time–intensity curve (TIC) software. The difference in time-to-peak intensity between these two vascular territories was determined, and a perfusion quotient (PQ) was defined as the ratio of TIC increase of interlobar artery to renal cortex. Three patients with segmental loss of renal perfusion demonstrated by Doppler US were excluded.
Results. Nineteen patients had an uneventful clinical course (control group); PQ was 1.2 ± 0.4. Seven patients with a large perirenal haematoma, without rejection had an increased PQ ( P < 0.05) and a prolonged time difference ( P < 0.05). Based on clinical and histological criteria, the remaining patients were classified as acute tubular necrosis (ATN) ( n = 7), non-vascular rejection ( n = 7) or vascular rejection ( n = 5). RI determination could not discriminate these groups. Patients with ATN (PQ = 1.6 ± 0.7) or non-vascular rejection (PQ = 1.1 ± 0.6) had a lower PQ than patients with vascular rejection (PQ = 2.2 ± 0.8, P < 0.05). The time difference in all three subgroups was longer compared with controls.
Conclusions. USCM might be superior in the diagnosis of early kidney allograft dysfunction compared with conventional US by means of RI determination. Perirenal haematoma, ATN and vascular rejection are associated with characteristic changes of the TIC.
Introduction
The visualization of tissue properties and tissue perfusion is an important component of the diagnostic evaluation of kidney grafts by any imaging modality. Since acute rejection of a kidney graft primarily involves the capillary and interstitial area, early and detailed visualization of the subcapsular capillaries would provide crucial diagnostic information. Conventional vascular ultrasound (US) techniques such as colour-duplex ultrasonography (CDUS) do not depict vessels with a diameter of less than about 30 μm, and rely on the determination of the so-called resistance index (RI) in diagnosing acute kidney rejection. The RI is determined in larger arteries such as the interlobar or arcuate artery and is interpreted as indirect evidence of the situation in the capillary system. This method is susceptible to error resulting from the examiner dependence of the method, the effect of systemic disease such as atherosclerosis or the presence of renal artery stenosis, and the accessibility of the kidney graft in very obese patients [ 1 ].
Optimized US assessment of kidney transplants might help to initiate early drug therapy and differentiate various conditions. An improved evaluation might be expected from the use of ultrasound contrast media (USCM), so-called echo enhancers, which is well established for the US evaluation of myocardial perfusion [ 2–4 ]. The rapid development of US technology and the advent of new echo enhancers that are stable to pressure have led to the recent introduction of different US techniques for the visualization of organ perfusion [ 3 ]. An important new technique is so-called contrast-medium-specific imaging, in which the emission of minimum US energy (<1% of the energy emitted in conventional B-mode US) induces the reflection of contrast-medium-specific sequences by the individual microbubbles [ 4 , 5 ]. These harmonic frequencies enable the selective depiction of even minute perfusion signals from the capillary area while the tissue signals are suppressed [ 6 , 7 ]. Only little data is available on the evaluation of kidney transplants by contrast-enhanced ultrasonography [ 8–10 ]. With the reliable clinical use of second-generation USCM having been established [ 11 ] and the improved examination techniques available, we undertook a study aimed at quantifying the arterial inflow of US contrast medium by means of time–intensity curves (TICs) in the early post-operative phase after kidney transplantation in order to evaluate the potential of this US technique as a new tool for the post-transplant follow-up of kidney recipients. The new method of contrast-enhanced US was compared with conventional CDUS [ 12 ] in the context of the usual clinical parameters.
Material and methods
In this prospective evaluation of the utility of the new contrast-enhanced US technique, all consecutive patients transplanted between April 2003 and November 2004 were included, in whom a standardized investigation of the kidney allograft was performed in the first post-transplant week. The study was approved by the institutional review board and a standard study protocol for the use of USCM and conventional US was defined before the beginning of the study. Written informed consent was obtained from all patients who participated in the study.
US examination protocol
All US examinations were performed with a high-end US system (Aplio 80, Toshiba, Otawa, Japan) using a 3.5 MHz transducer by a single examiner (T.F.) experienced in the diagnostic evaluation of kidney transplants. Conventional US parameters determined on days 2, 5 and 7 after transplantation were transplant volume, RI in the area of the interlobar artery by CDUS (pulse repetition frequency 800–2000 Hz), and possible perfusion defects by power Doppler US and 3D power Doppler. An additional investigation was performed, when acute rejection was suspected, immediately before diagnostic renal biopsy was performed.
The examination with administration of an USCM was performed using contrast harmonic imaging at a low mechanical index (MI) of <0.1 and a minimum tissue signal. All 45 patients were examined with a standard protocol by contrast-enhanced US 4–10 days after transplantation, or when acute rejection or delayed graft function was suspected. In the case of kidney biopsy, contrast-enhanced US was performed immediately before the biopsy. The microbubble echo enhancer SonoVue (Bracco Altana Pharma GmbH, Constance, Germany) was administered as a 2.4 ml bolus together with 5 ml saline solution over 4–5 s [ 10 ].
Arterial inflow of the contrast medium and the parenchymal phase were documented by digitally storing the images over 60 s at an image repetition rate of 10 images per second. Subsequently, perfusion was quantified using the US system's inbuilt TIC software. Four circular regions of interest (ROIs) were placed in the area of the main renal artery (A), the interlobar artery (IA), the subcapsular renal cortex (RC) and the renal vein (V). The ROIs were adjusted to the respective vessel diameters and were smaller than the largest vessel diameter in order to eliminate minor motion artifacts. The zoom function was used for maximum depiction of the kidney graft, which also served to reduce possible motion artifacts. The digital clip was then reviewed to identify and correct any misplacement of the ROIs. Intensity was defined as the mean of the gray-scale values within the ROI.
Patient groups
The patients without signs of acute rejection or delayed graft function (DGF) were assigned to the control group; the patients of this group did not require post-transplant haemodialysis and presented with an uneventful clinical course. The indication for US-guided biopsy of the kidney graft was established by standard criteria: (i) in patients in whom serum creatinine levels did not decrease, (ii) the decrease was inadequate despite adequate immunosuppressive drug levels or (iii) in whom renal function deteriorated. Secondary causes of an inadequate or absent decrease in serum creatinine levels were excluded to the extent that this was possible on clinical grounds. Based on the clinical and histological criteria of the modified Banff classification [ 13 ], the patients were assigned to one of four groups; (i) control group with a normal uneventful course, (ii) acute tubular necrosis (ATN) group, without evidence for rejection, (iii) non-vascular and (iv) vascular rejection group.
All patients, who required dialysis during the first week and in whom acute rejection was excluded by clinical or histological means, were included in the ATN group. In addition, non-dialyzed patients, in whom serum creatinine on day 7 was higher than 3 mg/dl, were classified as slow graft function (SGF). Because core biopsy of the graft demonstrated ATN without evidence for rejection, these patients were also assigned to the ATN group.
Analysis and statistics

To analyse the reproducibility of the USCM the Spearman correlation coefficient was applied.
Before performing any statistical analyses between the groups data were checked for normal distribution using the Kolmogorov–Smirnov Z-test. The intra-group data were tested using Wilcoxon's test for paired samples. The results in the different groups were compared using the Mann–Whitney U-test for unpaired samples. Significance was assumed at P < 0.05.
For further analysis of the predictive power of PQ measurements we performed a receiver operating characteristic (ROC) analysis for PQ measurements as a predictor of vascular rejection compared with the normal group.
Results
Reproducibility
Two different investigators experienced in the field of conventional and contrast-media-enhanced US were asked to investigate six stable maintenance kidney transplanted patients on the same day. Both investigators were asked to do a complete US investigation including volume, RI and PQ measurement. The time interval from the first to the second investigation was ∼30 min. For allograft volume we found a poor reproducibility (ρ = 0.029, P = 0957). Also RI measurement revealed no good correlation (ρ = 0.143, P = 0.787). Only PQ measurements showed a satisfactory result (ρ = 0.829, P = 0.042). The PQ index in these patients was 1.35 ± 0.14. We next looked at the reproducibility when the investigators did the measurements on two consecutive days (time interval from the first to the second measurement was around 24 h). Again the poorest correlation was found for kidney volume (ρ = 0.143, P = 0.787). For the RI measurement reproducibility was good (ρ = 0.829, P = 0.042), as it was for PQ (ρ = 0.829, P = 0.042).
Patients
Forty-eight consecutive adult kidney transplant recipients (27 women, 21 men) ranging in age from 18 to 71 years (median: 45 years) who were referred for US evaluation of their kidney grafts were examined with the standardized administration of USCM. Three patients were excluded from TIC-based analysis because of a perfusion defect in the pole area that was already demonstrated by power Doppler sonography and clearly shown in its extent after USCM administration. Thus, a total of 45 patients with a normal transplant appearance on B-mode scanning were included in the study. A total of 26 patients showed no signs of acute rejection and were assigned to the control group (group N). Ninteen patients had a complete uneventful clinical course with primary graft function, good diuresis and no signs of rejection, and were defined as normal control population (group N1), ( Table 1 ). Seven patients of the control group had a large perirenal haematoma (>1/3 of the graft volume) and were assigned to the haematoma group (group H). Despite the large haematoma, this group had a similar uneventful clinical course with all seven patients showing primary graft function and good diuresis.
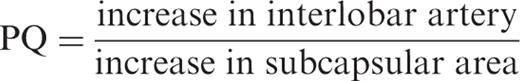
Five patients had delayed graft function and two patients fulfilled the criteria of slow graft function (ATN group). In 5/7 of the patients acute rejection was excluded by renal biopsy; however, besides ATN additional signs of calcineurin toxicity were seen in 4/5 of the patients. In 2/7 of the patients with DGF and beginning diuresis, no biopsy was performed, and the subsequent uneventful clinical course further excluded rejection in both patients. Patients in the ATN group had baseline characteristics similar to those in the control group ( Table 1 ). As expected, the ATN group had no decrease in creatinine levels (day 2: 7.5 ± 2.6 mg/dl vs day 7: 7.9 ± 3.2 mg/dl, NS) over the first week. Acute rejection was suspected clinically in 17 patients and rejection was confirmed by biopsy in 12 patients, who were assigned into the two rejection groups. Seven patients had non-vascular rejection (group B1, Banff I). Clinically, despite primary function in six patients, these patients had no further decrease in their serum creatinine on day 7 (day 2: 3.6 ± 1.9 mg/dl vs day 7: 3.0 ± 1.5 mg/dl). Five patients were found to have vascular rejection (group B2, Banff II), and presented with poor renal function (serum creatinine on day 7: 8.5 ± 2.5 mg/dl, P < 0.05, compared with N1) ( Table 1 , Figure 2 ).
The patients’ clinical and demographic data are summarized in Table 1 . There were no apparent differences between groups in the demographic characteristics and in immunosuppressive treatment. All patients received calcineurin-inhibitors and steroids.
Conventional US parameters
Immediate post-operative evaluation of the kidney transplants by unenhanced B-mode scanning demonstrated a normal morphologic appearance with good differentiation of medulla and cortex and a normal resistance index. In five of the 45 patients, one renal pole could not be assessed by Doppler US for RI determination because the kidneys were located deep within the iliac fossa and the patients were extremely obese. In one patient of group B2, power Doppler demonstrated a wedge-shaped perfusion defect on day 7.
Patients in all groups showed a mild-to-moderate (mean 13.7 ± 23.2%), but not significant increase in volume from day 2 to day 7 ( Table 2 ). All patients showed a marginal increase (0.08 ± 0.02) in RI from day 2 to day 7 ( Table 2 ). B2 already showed markedly higher post-operative baseline RI values as compared with all other groups. Most importantly, intraindividual comparison yielded no significant differences between RI values on day 2 and day 7 in any of the groups ( P = 0.652 for the vascular rejection group B2).
In summary, the conventional US examination, including the determination of RI values, provided no reliable basis for the diagnosis of early allograft dysfunction even when looking at the intraindividual course over time.
Contrast medium dynamics
In all 45 patients, the entire kidney graft could be evaluated by contrast-enhanced US. In contrast to B-mode and CDUS, even deep pole areas showed adequate opacification and were amenable to TIC measurement.
The patients of group N1 showed uniform contrast medium dynamics ( Figure 3 ). The curves were characterized by an early (time to peak in the renal cortex: 17.2 ± 6.4 s) and steep increase of comparable magnitude in the main renal artery (11.0 ± 5.3 intensity units/s), the interlobar artery (11.4 ± 5.4 intensity units/s), and the renal cortex (10.7 ± 5.1 intensity units/s) ( P > 0.05, intra-group test). The peak was followed by a washout and subsequent plateau phase. The ratio of the increase in the interlobar artery to that in the renal cortex (perfusion quotient, PQ) was 1.2 ± 0.4. The decline of perfusion was comparable in the three vascular territories (renal artery: −2.4 ± 1.1 intensity units/s, interlobar artery: −2.7 ± 1.5 intensity units/s, renal cortex: −2.8 ± 1.1 intensity units/s). Peak intensity was seen at nearly the same times in the renal cortex and the interlobar artery (▵t peak : −0.4 ± 1.5 s). The arteriovenous time difference between the renal artery and vein was 2.6 ± 1.3 s.
Interestingly, patients in the haematoma group, H, showed rather heterogeneous contrast medium dynamics. While the increase was similar in the main renal artery (15.9 ± 6.0 intensity units/s) and the interlobar artery (15.0 ± 4.3 intensity units/s), the renal cortex showed a less pronounced increase (9.5 ± 3.6 intensity units/s). The resulting PQ was significantly higher compared with controls (1.7 ± 0.4, P < 0.05). The efflux characteristics differed between the three vascular territories with a rather slow efflux from the renal cortex (renal artery: −3.9 ± 1.8 intensity units/s, interlobar artery: −2.9 ± 1.5 intensity units/s, renal cortex: −2.2 ± 1.3 intensity units/s). Peak intensity was reached later in the renal cortex as compared with the interlobar artery (▵t peak : 1.4 ± 1.3 s, P < 0.05). The arteriovenous time difference between the renal artery and vein (1.8 ± 0.8 s) was short. In five of the seven patients, administration of the echo enhancer clearly improved delineation and volume determination of the haematoma.
The patients of the ATN group showed a delayed increase (time to peak in renal cortex: 19.3 ± 5.3 s) on the 5th post-operative day. The increase was less pronounced in the renal cortex (5.4 ± 2.1 intensity units/s, P > 0.05) when compared with the main renal artery (7.3 ± 2.5 intensity units/s) and the interlobar artery (8.0 ± 3.3 intensity units/s). The PQ was 1.6 ± 0.7 ( P > 0.05). The decrease was comparable in the renal cortex (−2.1 ± 0.8 intensity units/s), the interlobar artery (−1.9 ± 0.7 intensity units/s) and the renal artery (−2.2 ± 0.8 intensity units/s). Peak intensity was significantly later in the renal cortex compared with the interlobar artery (▵t peak : 1.9 ± 5.7 s, P < 0.05). The arteriovenous time difference was 2.4 ± 1.2 s.
Since the ATN group contained both dialysis as well as non-dialysed patients (SGF) we also looked at the PQ in these two subgroups. The PQ in the dialysis ATN patients was 1.4 ± 0.4 compared with 2.0 ± 1.1 in the non-dialysed patients ( P > 0.05).
The rejection patients of group B1 had similar curves as the normal population. The time to peak was 17.7 ± 4.1 s in the renal cortex. Increases were comparable in the main renal artery (12.5 ± 4.3 intensity units/s), the interlobar artery (9.4 ± 2.2 intensity units/s) and in the renal cortex (9.7 ± 2.8 intensity units/s) ( P > 0.05). The resulting PQ was 1.1 ± 0.6. The decreases did not differ between the three vascular territories (renal cortex: −2.2 ± 1.0 intensity units/s, interlobar artery: −2.4 ± 1.0 intensity units/s, renal artery: −2.1 ± 1.2 intensity units/s) ( P > 0.05). Peak intensity was seen at nearly the same times in the renal cortex and the interlobar artery (▵t peak : 0.1 ± 2.1 s, P > 0.05). The arteriovenous time difference was 2.0 ± 1.1 s.
The patients in group B2 had significantly different contrast medium dynamics. The time to peak in the renal cortex was markedly longer (23.6 ± 8.5 s). The increases in the main renal artery (7.0 ± 4.2 intensity units/s) and the interlobar artery (9.0 ± 3.8 intensity units/s) were higher than in the renal cortex (4.6 ± 2.3 intensity units/s, P < 0.05; intra-group test between the increase in the interlobar artery and the renal cortex. The PQ was 2.2 ± 0.8, which is significantly above the PQ of the normal population, N1 (1.2 ± 0.4, P < 0.05). The contrast medium efflux was slower, but did not differ between the three vascular territories (renal cortex: −1.8 ± 1.4 intensity units/s, interlobar artery: −2.9 ± 1.5 intensity units/s, renal artery: −1.8 ± 0.9 intensity units/s) ( P > 0.05). The arteriovenous time difference was 2.1 ± 0.9 s. Peak intensity was later in the renal cortex as compared with the interlobar artery (▵t peak : 1.0 ± 3.6 s, P > 0.05). In two patients contrast-enhanced US detected perfusion defects in the subcapsular renal cortex that had not been demonstrated by power Doppler. Conventional US parameters and the major parameters of contrast medium dynamics are summarized in Table 2 .
The coefficient of variation (%) was 32.3 for the normal group, 28.1 for the haematoma, 49.8 for the ATN, 56.1 for non-vascular rejection and 39.2 for the vascular rejection group.
In summary, contrast-enhanced US not only provided valuable additional information on the morphology and extent of the graft perfusion, but also demonstrated the consequences on the intragraft perfusion in patients with haematoma and severe rejection ( Figure 4 ).
Predictive power of the PQ and the RI measurements
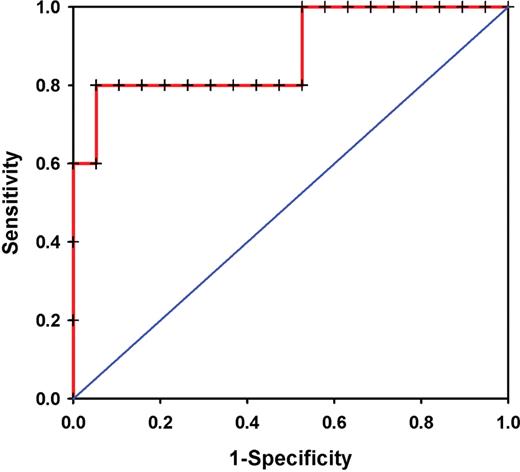
For further analysis of the predictive power of PQ measurements we performed a ROC analysis for PQ measurements as a predictor of vascular rejection ( n = 5) compared with the normal group ( n = 19). The area under the ROC-curve was 0.884 ± 0.099 ( P = 0.009) ( Figure 5 ). The optimal cut-off value for PQ derived from ROC analysis was 1.72. With this cut-off value, the sensitivity was 4/5 (80%) and the specificity 18/19 (95%).
For the RI measurements ROC analyses revealed a non-significant difference between the normal control group (group N1, n = 19) and the vascular rejection group ( n = 5) on day 2 (AUC 0.741, P = 0.108) but a significant difference on day 7 (AUC 0.827, P = 0.028).
Discussion
Technical developments in US equipment [ 14 , 15 ] and the introduction of US contrast media [ 2 , 5–7 ] have revolutionized US in recent years. Conventional US techniques such as determination of RI and evaluation of subcapsular perfusion by CDUS or power Doppler have been established for years as part of the diagnostic evaluation of kidney recipients in the follow-up of both acute and chronic rejection [ 12 ]. Nevertheless, the method has limitations. The known examiner dependence of the US examination and the limited accessibility by Doppler US of obese patients or when the kidney lies deep within the iliac fossa [ 1 ] frequently impair evaluation or may give rise to misinterpretation. Furthermore, the renal resistance index is unspecific and is influenced by many factors. Some are unrelated to disease. These include the site at which the RI is measured [ 16 ], the increased intra-abdominal pressure during forced inspiration, the pulse rate [ 17 , 18 ], or simply the immunosuppressive medication such as ciclosporin [ 12 ]. The contrast-enhanced ultrasound examination, on the other hand, is independent of the examiner and yields valid results even under difficult anatomic conditions as in obese patients [ 10 ].
This is the first study comparing the results of an early post-operative contrast-enhanced US examination with standard US technique. The results presented here provide the first evidence that the evaluation of US contrast medium dynamics of the kidney grafts in the early post-operative period might be superior to previous US assessments, including standardized volume measurements in the B-mode and RI determination. USCM ultrasound clearly provided better morphology of the graft, and a better discrimination of deep pole areas and haematomas. Changes in contrast medium inflow and washout provide better insight into the perfusion of the graft and even might reflect the consequences of severe vascular damage as seen in vascular rejection. The patients of the non-rejection group, N1, showed uniform contrast medium inflow curves with an early and steep increase followed by a washout and subsequent plateau phase. Peak intensity in the renal cortex was observed already after 17.2 s. The ratio of the increase in the interlobar artery to that in the renal cortex (PQ) was 1.2 ± 0.4 and was thus comparable for both vascular territories.
It was very surprising to see that patients with a large (>1/3 of the graft volume) perirenal haematoma had a significantly higher PQ than the patients of the control group. These results suggest that the pressure on the renal cortex caused by the haematoma compromises the microcirculation of the renal cortex. However, the impaired perfusion did not translate into a grossly altered clinical course, as all our patients had good initial renal function. Whether, the disturbed perfusion may have minor consequences on outcome has to be determined in future investigations. Another important implication of this observation is that the examiner must be aware of the effect perirenal haematoma may have on the time–intensity curve of the renal cortex.
Patients with ATN had very heterogeneous curves. The time difference and PQ were above those in the normal population, the time difference was significant, and the PQ was not significant. This group had the longest time difference in contrast medium arrival between the interlobar artery and the renal cortex (Δt peak 1.9 ± 5.7 s, P < 0.05). ATN is usually associated with pronounced interstitial oedema. It is tempting to speculate that in such cases there is secondary involvement of the vascular bed with changes that can be demonstrated by contrast-enhanced US.
Interestingly, mild interstitial Banff I rejection was not associated with any specific findings on contrast-enhanced US. This is not surprising as Banff I is by definition located in the tubulointerstial space and not associated with vascular changes. Thus any non-vascular rejection is not expected to lead to any changes in a diagnostic procedure that assesses intravascular contrast medium dynamics. At most, one might expect secondary intravascular changes resulting from impairment of microcirculation as a result of tissue oedema.
As already mentioned, abnormal changes in contrast medium dynamics were primarily seen in patients with severe vascular (Banff II) rejection. In this group, the PQ was roughly twice as high as in the normal population, which may be attributable to a loss of capillaries or an increase in peripheral resistance [ 19 ]. Even in our small patient population, we were able to identify those patients, which was however not possible using conventional ultrasound techniques, including RI determinations.
The higher RI values in patients with severe vascular rejection measured immediately after transplantation do not allow differentiation between a normal course, acute tubular necrosis or a rejection. Hollenbeck and co-workers [ 20 ], in a prospective study including 65 consecutive patients, found a specificity of only 30% for the absolute RI value in detecting a rejection episode. He recommended the serial monitoring of the RI instead of performing a single examination in the cases of transplant dysfunction.
In our study, patients with vascular rejection did not show a significant increase in the RI value over time. This was due to the fact that the RI values at baseline were already quite high. However, ROC analyses on day 7 indicated that a high RI might be of some value for the detection of a vascular rejection. Nevertheless, the absolute RI value is difficult to be valuated when it remains constant over a long period of time which, however, is often seen in the clinical routine. Patients who start off with high RI values immediately after transplantation are, therefore, difficult to be followed up. In these patients the PQ monitoring can be of great value.
Further studies with larger patient groups are needed to clearly define cut-off values for a pathological PQ value in this patient population. Based on our initial results we feel confident that contrast-enhanced US techniques will be a reliable and easy way to better monitor renal perfusion in those patients.
In our study, contrast-enhanced US enabled full evaluation of renal vascularization including deep pole areas in all patients while non-enhanced US failed to depict one pole area in five of 45 cases. In two patients with acute rejection only the contrast-enhanced examination revealed a perfusion defect; in five of seven patients with a large perirenal haematoma, administration of the echo enhancer improved the evaluation of the extent of the haematoma. Thus it became very clear that this new method really improved the visualization of renal allograft morphology in the early phase after transplantation. The US examination with administration of an echo enhancer has no adverse effects and is, therefore, a suitable follow-up modality for kidney transplant recipients that should be performed whenever rejection is suspected. In patients where the US parameters show improvement, biopsy may be dispensed with. Given the importance of improved diagnosis of early allograft dysfunction, we think that the increased costs (∼$20 per investigation) are well offset by the utility of this method.
In summary, renal biopsy continues to be the gold standard for diagnosing rejection in kidney recipients. Ultrasonography with administration of a contrast medium is an excellent and easy to perform procedure that is superior to conventional techniques such as B-mode US for volume measurement and duplex scanning for RI determination. The quotient of the time–intensity curves in the interlobar artery and the renal cortex can be used for the standardized and early diagnosis of acute rejection. The method is well suited for the identification of vascular rejection. Perirenal haematoma is associated with characteristic changes of the time-intensity curve and must be considered in the differential diagnosis. Studies in larger populations are needed to evaluate the potential of the method in the follow-up of drug therapy and in identifying further conditions affecting kidney grafts.
Conflict of interest statement . None declared.
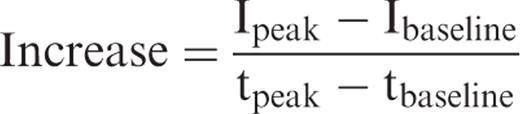
![Depiction of the course of contrast enhancement in the interlobar artery. The increase [(I peak – I baseline )/(t peak − t baseline )], decrease [(I decrease − I peak )/(t decrease − t peak )], and the time until maximum intensity was reached (t peak ) were calculated from the time-intensity curves (defined ROIs in the interlobar artery, renal cortex).](https://oup.silverchair-cdn.com/oup/backfile/Content_public/Journal/ndt/21/10/10.1093_ndt_gfl313/3/m_gfl313f1.jpeg?Expires=1716417790&Signature=u0F5e8tYzClVBIvHN4Uzwe4FuBZBCO21qJYxGESTkg5IhR2hb7~duoy~d8ZijXKT7WUjqxwHhAwO2c-XdqaT8aVgQl2qkk~jWo60UFcf8sdnQOHBskj0tZYgqmi-iwfavOO5mMNKLQMgMWuogk2W8Wtd1dkdC1yVtqmDVZa6hvb~ntJRAEWN-T7byZ~D9RLImXjvAnJYfuN0fjUJ4sabpLy3oVllGI85sdg3yBrl7W4rK6u-Aih4l5Ec-zPjB-U4THZCYR6GeAXu46LF6KFVHDL3Df7tku8udzW1R3Q7Zl5kjnuuVwHjfFLr4IUKwiWFCeONbvXo0Kj2xg~2oKNRWw__&Key-Pair-Id=APKAIE5G5CRDK6RD3PGA)
Depiction of the course of contrast enhancement in the interlobar artery. The increase [(I peak – I baseline )/(t peak − t baseline )], decrease [(I decrease − I peak )/(t decrease − t peak )], and the time until maximum intensity was reached (t peak ) were calculated from the time-intensity curves (defined ROIs in the interlobar artery, renal cortex).
Demographic and clinical data of the study groups
| Demographic and clinical data | No rejection | Rejection | |||
|---|---|---|---|---|---|
| Normal population (group N1, n = 19) | Haematoma (group H, n = 7) | ATN (group ATN, n = 7) | Non-vascular (group B1, n = 7) | Vascular (group B2, n = 5) | |
| Recipient age (years) | 43 ± 9 | 38 ± 12 | 50 ± 16 | 47 ± 18 | 62 ± 5* |
| Proportion of living donation | 7/19 | 2/7 | 0/7 | 5/7 | 1/5 |
| Panel-reactive antibodies | 1 a /19 | 0/7 | 0/7 | 0/7 | 0/5 |
| Donor age (years) | 44 ± 13 | 41 ± 11 | 56 ± 14* | 68 ± 12* | 65 ± 7* |
| Cold ischaemia (h) | 7.02 ± 4.82 | 10.83 ± 5.91 | 13.16 ± 4.76* | 4.02 ± 3.06 | 8.76 ± 4.35 |
| Missmatches | 3.6 ± 2.7 | 0.9 ± 1.7* | 4.9 ± 2.6 | 5.3 ± 2.0 | 4.8 ± 1.6 |
| Immuno-suppressive treatment | Tacrolimus: 11 | Tacrolimus: 3 | Tacrolimus: 3 | Tacrolimus: 3 | Tacrolimus: 4 |
| Ciclosporin A: 8 | Ciclosporin A: 4 | Ciclosporin A: 4 | Ciclosporin A: 4 | Ciclosporin A: 1 | |
| MMF: 14 | MMF: 5 | MMF: 4 | MMF: 4 | MMF: 4 | |
| Treatment with IL2-antibodies | 8/19 | 3/7 | 4/7 | 3/7 | 4/5 |
| Average ciclosporin-level at time of investigation (ng/ml) | 200 ± 33 | 157 ± 31 * | 143 ± 39 * | 165 ± 31 | 171 ± 10 |
| Average tacrolimus-level at time of investigation (ng/ml) | 10.1 ± 3.5 | 13.1 ± 3.0 | 16.7±5.7 | 13.6±7.9 | 12.4±8.8 |
| Primary graft function | 19/19 | 7/7 | 2/7 | 6/7 | 3/5 |
| Creatinine pre-operative | 9.0 ± 2.3 | 7.7 ± 3.0 | 6.8 ± 2.2* | 7.4 ± 2.7 | 7.7 ± 2.0 |
| Day 2 | 5.0 ± 3.0 | 4.5 ± 2.3 | 7.5 ± 2.6* | 3.6 ± 1.9 | 6.8 ± 1.0 |
| Day 7 | 2.7 ± 2.0 | 2.3 ± 1.4 | 7.9 ± 3.2* | 3.0 ± 1.5 | 8.5 ± 2.5* |
| (mg/dl) | |||||
| Diuresis pre-operative | 334 ± 643 | 617 ± 662* | 460 ± 549 | 1216 ± 620* | 625 ± 820 |
| Day 2 | 3655 ± 2648 | 3097 ± 545 | 1542 ± 2020* | 2815 ± 889 | 946 ± 1235* |
| Day 7 | 2132 ± 835 | 2890 ± 1342 | 2168 ± 1030 | 1822 ± 657 | 1985 ± 1596 |
| (ml/d) | |||||
* P ≤ 0.05, all significances in this table compared with group N1, a 22%.
Courses of serum creatinine levels in the five groups within the first 2 weeks after transplantation and pre-operative baseline. Markedly abnormal courses in group B2 and ATN.
Conventional US parameters and time–intensity curve parameters in the different groups
| Ultrasound | No rejection | Rejection | |||
|---|---|---|---|---|---|
| Normal population (group N1, n = 19) | Haematoma (group H, n = 7) | ATN (group ATN, n = 7) | Non-vascular (group B1, n = 7) | Vascular (group B2, n = 5) | |
| Conventional parameters | |||||
| Volume increase day 2 to day 7 (%) | 18.0 ± 25.2 | 3.4 ± 15.1 | 0.8 ± 13.2 | 26.1 ± 28.4 | 11.8 ± 9.5 |
| Resistance index | |||||
| Day 2 | 0.68 ± 0.05 | 0.63 ± 0.05 * | 0.72 ± 0.10 | 0.66 ± 0.04 | 0.82 ± 0.15 * |
| Day 7 | 0.77 ± 0.11 | 0.68 ± 0.04 * | 0.81 ± 0.09 * | 0.79 ± 0.09 | 0.87 ± 0.13 * |
| Time–intensity curves | |||||
| AV time (s) | 2.6 ± 1.3 | 1.8 ± 0.8 | 2.4 ± 1.2 | 2.0 ± 1.1 | 2.1 ± 0.9 |
| PQ | 1.2 ± 0.4 | 1.7 ± 0.4 * | 1.6 ± 0.7 | 1.1 ± 0.6 | 2.2 ± 0.8 * |
| Δt peak (s) | −0.4 ± 1.5 | 1.4 ± 1.3 * | 1.9 ± 5.7 * | 0.1 ± 2.1 | 1.0 ± 3.6 |
AV time, arteriovenous time difference; PQ, perfusion quotient defined as ratio of the increase in the interlobar artery to that in the renal cortex; Δt peak , temporal difference between peak intensity in the interlobar artery and in the renal cortex, * P ≤ 0.05, all significances in this table compared with group N1.
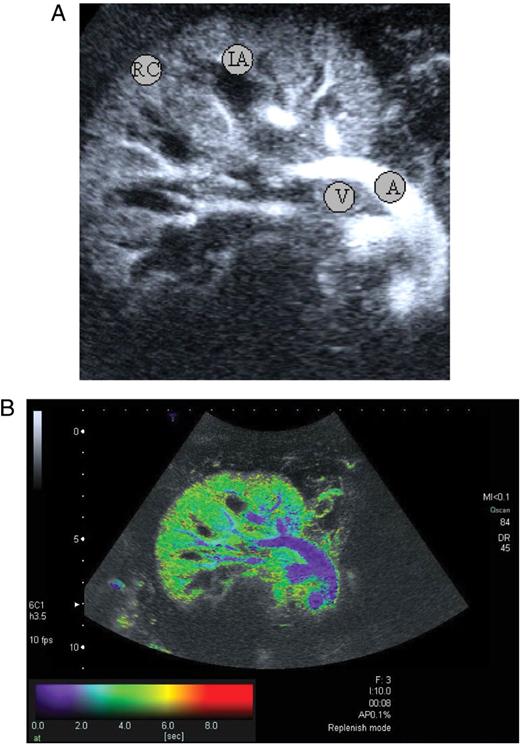
( A ) Perfusion image from a patient with good graft function 8 s after administration of the echo enhancer. Good contrast of the artery (A), vein (V), interlobar artery (IA), and renal cortex (RC). These are the ROIs from which the time–intensity curves were generated. ( B ) So-called parametric image of the kidney graft shown in Figure 3 A. The temporal course of contrast medium wash in is depicted in color. At time 0, the main renal artery is coded blue. Only 2–4 s later, the entire organ appears homogeneously green. In addition, there is opacification of a bowel loop around the kidney. Wash in of the contrast medium is also depicted in deep portions (10 cm).
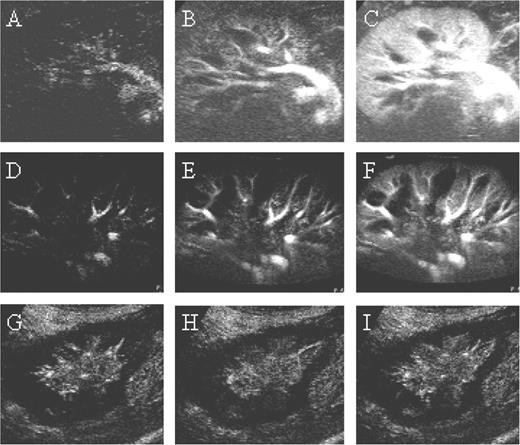
Temporal course of contrast medium wash in. Shown are the first 10 s after the onset of opacification of the interlobar arteries. The examples show a patient with good graft function at times 0 s ( A ), 5 s ( B ), and 10 s ( C ), a patient with slow graft function and graft volume increase due to tissue oedema at times 0 s ( D ), 5 s ( E ) and 10 s, and a patient with severe Banff II vascular rejection ( G ). There was no opacification of the renal cortex after 5 s ( H ) and 10 s ( I ) while there was opacification of the interlobar arteries.
For further analysis of the predictive power of PQ measurements we performed a ROC analysis for PQ measurements as a predictor of vascular rejection ( n = 5) compared with the normal group ( n = 19). The area under the ROC-curve was 0.884 ± 0.099 ( P = 0.009).
References
Restrepo-Schafer IK, Schwerk WB, Muller TF, Prinz H, Gorg C, Arnold R. (
Schlosser T, Pohl C, Veltmann C, et al. (
Nahar T, Li P, Kuersten B, Batra S, Vannan MA. (
Bouakaz A, Krenning BJ, Vletter WB, ten Cate FJ, De Jong N. (
Hohmann J, Skrok J, Puls R, Albrecht T. (
Quaia E, Bertolotto M, Calderan L, Mosconi E, Mucelli RP. (
Basilico R, Blomley MJ, Harvey CJ, et al. (
Girard MS, Mattrey RF, Baker KG, Peterson T, Deiranieh LH, Steinbach GC. (
Wei K, Le E, Bin JP, Coggins M, Thorpe J, Kaul S. (
Fischer T, Mühler M, Kröncke TJ, et al. (
Bokor D, Chambers JB, Rees PJ, Mant TG, Luzzani F, Spinazzi A. (
Radermacher J, Mengel M, Ellis S, et al. (
Racusen LC, Solez K, Colvin RB, et al. (
Pudszuhn A, Marx C, Malich A, Fleck M, Schneider A, Kaiser WA. (
Dietrich CF. (
Martinoli C, Bertolotto M, Crespi G, Pretolesi F, Valle M, Derchi LE. (
Takano R, Ando Y, Taniguchi N, Itoh K, Asano Y. (
Schwerk WB, Restrepo IK, Prinz H. (
Waiser J, Schreiber M, Budde K, et al. (


Comments