


Abstract
This study aimed to analyze adult kidney transplant recipients (KTRs) for the risk of new-onset diabetes after transplantation (NODAT) associated with viral serologies and immunosuppression regimens [tacrolimus (Tac) + mycophenolate (MPA), cyclosporine (CSA) + MPA, sirolimus (SRL) + MPA, SRL + CSA or SRL +Tac].
Cox regression models were used to examine the risk of NODAT in the first posttransplant year associated with: (i) CSA + MPA, SRL + MPA, SRL + MPA or SRL + Tac versus reference, Tac + MPA; (ii) pretransplant viral serology [+ or −; hepatitis B core (HBc), hepatitis C (HCV), cytomegalovirus (CMV) or Epstein Barr Virus (EBV)]; and (iii) interactions between immunosuppression regimens and the viral serology found significant in the main analysis.
Adult KTRs (n = 97 644) from January 1995 through September 2015 were studied. HCV+ [hazard ratio (HR) 1.50, 95% confidence interval (CI) 1.31–1.68] or CMV+ (HR 1.12, 95% CI 1.06–1.19) serology was a risk factor and HBc+ (HR 1.04, 95% CI 0.95–1.15) or EBV+ (HR 1.06, 95% CI 0.97–1.15) serology was not a risk factor for NODAT. Regardless of associated HCV or CMV serology, risk of NODAT relative to the reference regimen (Tac + MPA) was lower with CSA + MPA [HCV−: HR 0.74, 95% CI 0.65–0.85; HCV+: HR 0.47, 95% CI 0.28–0.78; CMV−: CSA + MPA HR 0.68, 95% CI 0.54–0.86; CMV+: (CSA + MPA) HR 0.73, 95% CI 0.63–0.85] and similar with SRL + CSA or SRL + MPA. In KTRs with HCV− or CMV+ serology, SRL + Tac was associated with a higher risk of NODAT relative to reference [HCV− (HR 1.43, 95% CI 1.17–1.74) and CMV+ (HR 1.44, 95% CI 1.14–1.81), respectively]. The risk for NODAT-free graft loss was lower with Tac + MPA than the other regimens.
Tailoring immunosuppression regimen based on HCV or CMV serology may modify the risk of developing NODAT in KTRs.
INTRODUCTION
The success of modern immunosuppression in improving short and intermediate patient and graft outcomes after transplantation has not extended to long-term outcomes [1, 2]. The most common cause of kidney transplant loss is death with a functioning graft due to cardiovascular diseases; one of the major risk factors for this is new-onset diabetes after transplantation (NODAT) [3, 4].
The problem of ‘post-transplantation diabetes’ has been long recognized even before the formal definition of NODAT in 2003–04 [5–7]. Diabetes in kidney transplant recipients (KTRs) is characterized by an accelerated course and has been associated with worse outcomes including infectious and cardiovascular complications, graft loss, increased medical cost and death [8–13]. Therefore, reduction of risk and early treatment of NODAT are crucial for the prevention of its complications and adverse patient and graft outcomes. Thus, to these ends, there has been an increase in clinicians’ efforts to intervene through education, lifestyle modification programs and pharmacotherapy [14].
Recognition of non-modifiable risk factors for NODAT (older age, race, genetic background, family history, metabolic syndrome and pretransplant-impaired glucose tolerance) will ease early initiation of preventive measures in patients identified to be at risk [15]. Furthermore, clinical management measures may be incorporated into the posttransplant care of patients with modifiable risk factors for NODAT including overweight or obesity, past or present hepatitis C (HCV) and cytomegalovirus (CMV) infections and diabetogenic immunosuppressant medications [15].
The most transplant-specific modifiable risk factor for NODAT is the immunosuppression drug regimen administered to prevent allograft rejection [14, 16, 17]. Thus, it is not surprising that in KTR, the highest incidence of NODAT occurs in the first 6 to 12 posttransplant months coinciding with the patients’ exposure to the highest doses of immunosuppressants [5, 13, 18, 19]. The calcineurin inhibitors (CNIs), with tacrolimus being significantly more diabetogenic than cyclosporine [9, 20, 21], and the mammalian target of rapamycin inhibitors are hypothesized to cause or exacerbate NODAT though cellular mechanisms causing defect of insulin secretion and/or insulin resistance [5, 22].
The corticosteroids have been implicated in diabetogenesis through insulin resistance, increased glucagon release, increased hepatic gluconeogenesis and dose-related islet cell apoptosis [23–26]. However, despite the strong association of corticosteroids with NODAT in observational studies [27, 28], clinical trials have reported conflicting results on the role of steroids in the development of NODAT [18, 29–32], which could be partly explained by variations in drug doses and their interaction with other risk factors [33]. Induction antibody agents had also been associated with the risk of NODAT. Small single-center studies have shown an association between NODAT and the anti-interleukin-2, CD25 receptor antibody induction antibody agent, basiliximab [34–36]; mean while, T-cell-depleting induction antibodies have been indirectly associated with reduction of risk for NODAT [16, 37].
Two viral infections have been linked to NODAT. HCV has been associated with a 30–40% higher risk of NODAT [9, 21, 38], and Hjelmesæth et al. [8] hypothesized that asymptomatic or treatment-requiring CMV infection increases the risk of NODAT. On the other hand, although hepatitis B and Epstein Barr viruses (EBV) were linked to diabetes in the non-transplant setting, we are not aware of studies directly associating them with NODAT [39–41].
Consensus guidelines have emphasized the importance of vigilance in patient monitoring for hyperglycemia and weight gain in NODAT prevention [7]. ‘Tailoring of immunosuppression regimen based on pretransplant cardiovascular and diabetes risk factors’ has been highlighted in NODAT management consensus guidelines [7]; however, due to lack of supporting literature, the inclusion of viral serology among the factors considered in the individualized immunosuppression regimen choice to reduce the risk of NODAT has not been previously proposed [42].
This article aimed to analyze the association between viral serology status, anti-rejection immunosuppression regimen and the risk of NODAT in KTRs using data from the Scientific Registry of Transplant Recipients (SRTR). Results of this study demonstrate the distinct risk of NODAT associated with specific immunosuppression regimen and viral serology combinations. These findings may provide the basis for including the viral serology status in tailoring immunosuppression regimens for KTRs at risk for NODAT.
MATERIALS AND METHODS
This article used data from the SRTR and was approved by the University of Rhode Island Institutional Review Board (IRB# 955723-3). The SRTR system includes data on all donor, wait-listed candidates and transplant recipients in the USA, submitted by the members of the Organ Procurement and Transplantation Network (OPTN), and has been described elsewhere. The Health Resources and Services Administration provides oversight to the activities of the OPTN and SRTR contractors.
We used a retrospective cohort design to study KTR risk of NODAT associated with the common kidney transplant immunosuppression regimens and pretransplant viral serology status typically recorded by SRTR. The transplant period studied was from 3 January 1995 through 15 September 2015 with last KTR follow-up on 1 September 2016. The outcome of interest was NODAT, with the analysis centered on the adjusted risk of NODAT associated with immunosuppression regimens, viral serology statuses and their relevant interactions. In this study, NODAT was identified when KTRs did not have a diagnosis or history of diabetes mellitus (DM) at transplant and diagnosis of DM was recorded at follow-up within the first posttransplant year. The SRTR’s designation of + (positive) or – (negative), was followed in the assignment of the KTR antibody serology status (also termed ‘serology status’, ‘viral serology’, ‘serology’) to the following: hepatitis B core (HBc), HCV, CMV and EBV. Excluded from this study were KTRs with: human immunodeficiency virus-positive serology, combined solid-organ transplants, missing or unknown baseline viral serology or discharge immunosuppression regimen, no induction immunosuppression and non-study discharge immunosuppression regimen.
Based on an intention-to-treat design, KTRs were categorized into cohorts based on their discharge immunosuppression regimen: (i) cyclosporine (CSA) + mycophenolate (MPA), (ii) sirolimus (SRL) + MPA, (iii) tacrolimus (Tac) + MPA, (iv) SRL + CSA or (v) SRL + Tac. To study their independent associations with NODAT, corticosteroids and induction antibody drugs were separately analyzed in the Cox hazards models. Follow-up for outcomes was started on the day after transplant and continued until the earliest of the following: (i) end of the first posttransplant year, (ii) re-transplantation, (iii) death, (iv) graft failure of any cause, (v) end of SRTR follow-up or (vi) diagnosis of NODAT.
Data analysis
We presented summary baseline cohort characteristics as means with standard deviations for continuous variables and percentages for categorical variables; as applicable, Student’s t-test or χ2-test was used to compare baseline characteristics. To investigate the etiologic relationships between risk factors and the main outcome of interest, NODAT, cause-specific Cox hazards models were used where overall graft loss defined as graft failure of any cause, re-transplantation or death was treated as a competing event [43, 44]. The following clinically relevant covariates were used in the main Cox hazards model for the risk of NODAT: immunosuppression regimen (CSA + MPA, SRL + MPA, CSA + SRL or Tac + SRL versus Tac + MPA); viral serology status (positive or negative HBc, HCV, CMV or EBV serology); induction antibody agent; steroids; donor type; era of transplant; and recipient age, race or body mass index (BMI). Clinically relevant covariates for the NODAT-free overall graft loss Cox hazards model included all the variables in Table 1. Transplant era 1995–2004 versus 2005–15 was used as a covariate to adjust for the influence on outcome of the NODAT consensus guidelines’ publication in 2003 and 2004 [6, 7] and of the overall samples’ median year of transplant, 2004. Comparisons in the risks for NODAT between immunosuppression regimens were made by estimation of differences in their correlated adjusted log-hazard ratios (HRs) and 95% confidence intervals (CIs) relative to the reference, Tac + MPA [45]. Separate Cox multivariable hazards models analyzed the risk for NODAT associated with the interaction between immunosuppression regimens (CSA + MPA, SRL + MPA, CSA + SRL or Tac + SRL versus Tac + MPA) and viral serologies determined significant in the main Cox model. Visual inspection of the complementary log–log survival plots for the primary explanatory variables and examination of the Schoenfeld residual plots confirmed that the Cox models had satisfied the proportionality of hazards assumption. Cox regression analyses results were reported as HR with 95% CI. All analyses were performed using SAS software, version 9.2 (SAS Institute, Inc., Cary, NC, USA). Statistical significance was based on a P ≤ 0.05 and all CIs used a 95% threshold.
Demographic and clinical characteristics of adult KTRs on 3 January 1995 and 15 September 2015a grouped according to discharge immunosuppression regimens
| Variables | CSA + MPAb | SRL + MPAc | Tac + MPAd | SRL + CSAe | SRL + Tacf | P |
|---|---|---|---|---|---|---|
| (n = 7907) | (n = 1279) | (n = 84 986) | (n = 1666) | (n = 1806) | ||
| (8.1%) | (1.3%) | (87%) | (1.7%) | (1.8%) | ||
| Viral serology | <0.0001 | |||||
| HBc+ | 706 (8.9) | 97 (7.6) | 6248 (7.4) | 78 (4.7) | 177 (9.8) | |
| HCV+ | 360 (4.6) | 63 (4.9) | 3288 (3.9) | 50 (3.0) | 89 (4.9) | |
| CMV+ | 4975 (62.9) | 777 (60.1) | 52 900 (62.2) | 908 (54.5) | 1095 (60.6) | |
| EBV+ | 6540 (82.7) | 1087 (85.0) | 73 307 (86.3) | 1397 (83.8) | 1568 (86.8) | |
| Corticosteroids maintenance | 7836 (99.1) | 1248 (97.6) | 82 214 (96.7) | 1648 (98.9) | 1667 (92.3) | <0.0001 |
| Induction | <0.0001 | |||||
| ATG | 1731 (21.9) | 539 (42.1) | 43 885 (51.6) | 1193 (71.6) | 864 (47.8) | |
| Alemtuzumab | 180 (2.3) | 28 (2.2) | 10 710 (12.6) | 1 (0.1) | 17 (1.0) | |
| Basiliximab | 4020 (50.8) | 551 (43.1) | 21 495 (25.3) | 257 (15.4) | 618 (34.2) | |
| Other induction | 1976 (25.0) | 161 (12.6) | 8896 (10.5) | 215 (12.9) | 307 (17.0) | |
| Donor type | <.0001 | |||||
| Deceased donor | 4420 (55.9) | 738 (57.7) | 50 844 (59.8) | 734 (44.1) | 902 (49.9) | |
| Living donor | 3487 (44.1) | 541 (42.3) | 34 142 (40.2) | 932 (55.9) | 904 (50.1) | |
| Recipient age | <.0001 | |||||
| 18–45 (years) | 3729 (47.2) | 608 (47.5) | 38 817 (45.7) | 759 (46.2) | 980 (54.3) | |
| 45–60 (years) | 2602 (33.0) | 388 (30.3) | 26 950 (31.7) | 598 (35.9) | 593 (32.8) | |
| >60 (years) | 1569 (19.8) | 283 (22.1) | 19 210 (22.6) | 299 (17.9) | 233 (12.9) | |
| Recipient race | <0.0001 | |||||
| Caucasian | 4790 (60.6) | 776 (60.7) | 45 739 (53.8) | 1204 (72.3) | 1011 (56.0) | |
| Black | 1578 (20.0) | 292 (22.8) | 21 024 (24.7) | 317 (19.0) | 460 (25.5) | |
| Hispanic | 949 (12.0) | 166 (13.0) | 12 282 (14.4) | 93 (5.6) | 244 (13.5) | |
| Other | 590 (7.5) | 45 (3.5) | 5941 (7.0) | 52 (3.1) | 91 (5.0) | |
| BMI | <0.0001 | |||||
| <25 kg/m2 | 1919 (24.3) | 311 (24.3) | 21 282 (25.0) | 420 (25.2) | 443 (24.5) | |
| 25–29 kg/m2 | 3115 (39.4) | 483 (37.8) | 34 041 (40.1) | 601 (36.1) | 841 (46.6) | |
| ≥30 kg/m2 | 1871 (23.7) | 349 (27.3) | 22 492 (26.5) | 515 (30.9) | 353 (19.6) | |
| Unknown | 1002 (12.7) | 136 (10.6) | 7171 (8.4) | 130 (7.8) | 169 (9.4) | |
| Recipient male sex | 4925 (62.3) | 780 (61.0) | 49 681 (58.5) | 964 (57.9) | 1037 (57.4) | <0.0001 |
| Re-transplant | 699 (8.8) | 186 (14.5) | 12 406 (14.6) | 203 (12.2) | 309 (17.1) | <0.001 |
| PRA (%) | <0.001 | |||||
| PRA <80% | 7274 (92.0) | 1127 (88.1) | 61 935 (72.9) | 1527 (91.7) | 1599 (88.5) | |
| PRA ≥80% | 425 (5.4) | 138 (10.8) | 8306 (9.8) | 129 (7.7) | 179 (9.9) | |
| PRA unknown | 208 (2.6) | 14 (1.1) | 14 745 (17.4) | 10 (0.6) | 28 (1.6) | |
| Human leukocyte antigen mismatch (HLA mm) | <0.001 | |||||
| HLA mm ≤3 | 3949 (49.9) | 583 (45.6) | 33 200 (39.1) | 754 (45.3) | 867 (48.0) | |
| HLA mm >3 | 3889 (49.2) | 694 (54.3) | 51 407 (60.5) | 909 (54.6) | 928 (51.4) | |
| HLA mm unknown | 69 (0.9) | 2 (0.2) | 379 (0.4) | 3 (0.2) | 11 (0.6) | |
| Primary diagnosis | <0.0001 | |||||
| Glomerulonephritis | 2629 (33.2) | 379 (29.6) | 26 334 (31.00) | 308 (18.5) | 586 (32.4) | |
| Hypertension | 2154 (27.2) | 467 (36.5) | 24 218 (28.5) | 953 (57.20) | 472 (26.1) | |
| Other diseases | 2138 (27.0) | 288 (22.5) | 23 801 (28.0) | 292 (17.5) | 549 (30.4) | |
| Polycystic kidney | 986 (12.5) | 145 (11.3) | 10 633 (12.5) | 113 (6.8) | 199 (11.0) | |
| Transplant era | <0.0001 | |||||
| 1995–2004 | 5493 (69.5) | 694 (54.3) | 11 284 (13.3) | 644 (38.7) | 1188 (65.8) | |
| 2005–15 | 2414 (30.5) | 585 (45.7) | 73 702 (86.7) | 1022 (61.3) | 618 (34.2) |
PRA, panel reactive antibody.
Last patient follow-up: 1 September 2016.
CSA + MPA;
SRL + MPA;
Tac + MPA;
SRL + CSA;
SRL + Tac
RESULTS
Study population and demographics
We studied 97 644 adult kidney transplants from 3 January 1995 through 15 September 2015 with the last patient followed on 1 September 2016. Of these, 7907 (8.1%) KTRs were on CSA + MPA, 1279 (1.3%) on SRL + MPA, 84 986 (87%) on Tac + MPA, 1666 (1.7%) on SRL + CSA and 1806 (1.8%) on SRL + Tac. The baseline recipient, donor and clinical characteristics of the study cohorts are shown in Table 1. CMV antibody seropositivity rate was lowest in the SRL + CSA (54.5%) compared with the other four cohorts (range 60.6–62.9%). At discharge, 92% or higher of KTRs were on corticosteroids (Table 1). The CSA + MPA cohort had the highest proportion of KTRs (69.5%) in the 1995–2004 era, while the Tac + MPA cohort had the highest percentage of KTRs (86.7%) in the 2005–15 era.
Risk factors for NODAT: main Cox model
Compared with Tac + MPA, the risk of NODAT was lower with CSA + MPA (HR 0.72, 95% CI 0.63–0.82), higher with SRL + Tac (HR 1.41, 95% CI 1.16–1.71) and similar with SRL + MPA (HR 1.05, 95% CI 0.83–1.34) or SRL + CSA (HR 0.91, 95% CI 0.73–1.12) (Figure 1). Comparisons of study regimens (Figure 2) showed that CSA + MPA was less diabetogenic than Tac + MPA (HR 0.72, 95% CI 0.63–0.82), SRL + MPA (HR 0.69, 95% CI 0.52–0.89) and SRL + Tac (HR 0.51, 95% CI 0.40–0.65). SRL + Tac was more diabetogenic than all other regimes studied (Figure 2), while SRL + MPA and SRL + CSA were similarly diabetogenic (HR 1.15, 95% CI 0.84–1.59).
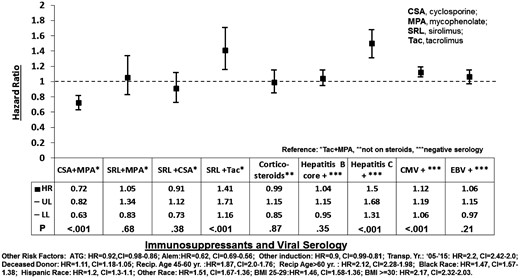
Risk factors for new-onset diabetes in the year after kidney transplantation. HR, hazard ratio; UL and LL, upper and lower limit of 95% confidence interval (CI).
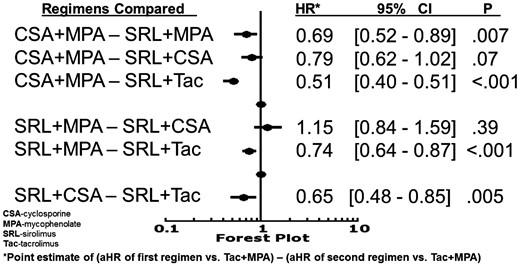
Comparison of risk for NODAT between immunosuppression regimens.
HCV+ and CMV+ serologies were risk factors [(HR 1.50, 95% CI 1.31–1.68) and (HR 1.12, 95% CI 1.06–1.19), respectively], while HBc+ and EBV+ serologies were not risk factors for NODAT [(HR 1.04, 95% CI 0.95–1.15) and (HR 1.06, 95% CI 0.97–1.15), respectively] (Figure 1). Induction of immunosuppression with Antithymocyte globulin (ATG) or alemtuzumab was associated with a lower risk of NODAT than anti-CD25 receptor antagonist [(HR 0.92, 95% CI 0.86–0.98) and (HR 0.62, 95% CI 0.56–0.69), respectively]. Corticosteroids in the maintenance immunosuppression regimen at discharge was not a statistically significant risk factor for NODAT (HR 0.99, 95% CI 0.85–1.15) (Figure 1). The other significant risk factors for NODAT included: overweight or obese BMI category; KTR age > 60 or 45–60 years (versus <45 years old); year of transplantation between 2005 and 2015 compared with 1995 and 2004; and African American, Hispanic or other KTR ethnicities (Figure 1).
Risk for NODAT: significant serology and immunosuppression regimen interactions
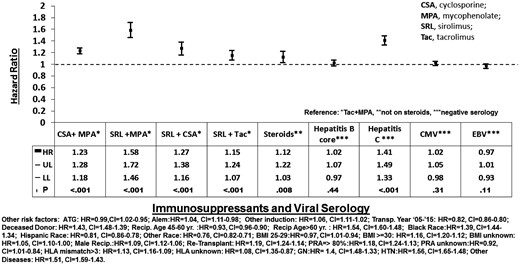
Cox regression analyses were performed to test the significance of interactions between immunosuppression regimens and significant viral serologies (HCV and CMV) from the main Cox model. In KTRs with HCV or CMV + or − serology, CSA + MPA was associated with a lower and SRL + MPA or SRL + MPA was associated with a similar risk of NODAT as the reference, Tac + MPA (Figure 3). The relative risk (RR) reduction for NODAT was highest with CSA + MPA in HCV+ KTR (53%; HR 0.47, 95% CI 0.28–0.78). Compared with the reference, the risk of NODAT associated with SRL + Tac was higher in HCV− KTR or CMV+ KTR and similar in HCV+ or CMV− KTR (Figure 3).
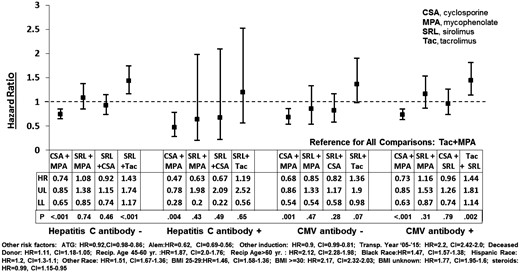
Risk factors for NODAT in HCV and CMV serology cohorts on different immunosuppression regimens. HR, hazard ratio; UL and LL, upper and lower limit of 95% confidence interval (CI).
Risks factors for NODAT-free overall graft loss
The risk of NODAT-free overall graft loss in the first year after transplant was higher with study regimens (CSA + MPA, SRL + MPA, SRL + CSA and SRL+ Tac) than with the reference regimen (Tac + MPA) (Figure 4). Maintenance corticosteroids was associated with a higher risk of NODAT-free overall graft loss and the risk of NODAT-free overall graft loss did not differ among induction agents. HCV+ serology was a risk factor for and EBV+ serology seemed to be a protective factor against NODAT-free overall graft loss (Figure 4).
Risk factors for diabetes-free overall graft loss in the year after kidney transplantation. HR, hazard ratio; UL and LL, upper and lower limit of 95% confidence interval (CI).
DISCUSSION
In this study, we analyzed the associations of viral serologies and immunosuppression regimens in NODAT development in the first posttransplant year in 97 644 KTRs. We confirmed that HCV+ or CMV+, but not HBc+ or EBV+ serology was associated with NODAT. Among discharge immunosuppression regimens, the risk of NODAT was highest with SRL + Tac and lowest with CSA + MPA. In KTRs with positive or negative HCV or CMV serology; CSA + MPA was protective, and none of the SRL regimens was protective against NODAT (relative to the reference regimen). In HCV− or CMV+ transplant recipients, SRL + Tac was associated with a higher risk for NODAT than Tac + MPA or CSA + MPA (Figure 3).
BMI and non-modifiable risk factors for NODAT
The most modifiable risk factors for NODAT are obesity and anti-rejection immunosuppressant [46]. In this study, the combined pretransplant overweight and obesity rates across cohorts ranged from 63 to 67%, while obesity alone rates across cohorts ranged between 20% and 31%. These data are consistent with previously reported rates in US transplant recipients [4, 47]. In a recent single-center study, pretransplant BMI was found to positively correlate with the risk of NODAT in the first year of transplant [48]. Our analysis showed that overweight and obese pretransplant BMIs were associated with a 54% and 117% higher risk of NODAT, respectively, than BMI <25 kg/m2 (Figure 1). Therefore, our findings and other earlier studies would support established recommendations of NODAT prevention through lifestyle modification to achieve normal BMI in overweight or obese transplant candidates or recipients [4, 6].
Immunosuppression regimen and NODAT
In our analysis, the immunosuppression regimens associated with the highest and lowest risks of NODAT were SRL + Tac [increased RR = 41% (HR 1.41, 95% CI 1.16–1.71)] and CSA + MPA [decreased RR = 28% (HR 0.72, 95% CI 0.63–0.82), respectively (Figure 1). Although as a class, the CNIs have been known to contribute to NODAT via islet cell toxicity and inhibition of insulin secretion or expression, the pro-diabetic effects of CNIs have differed between CSA and Tac [4]. In our analysis, CSA combined with MPA or SRL was associated with a 28% and 35% lower risk of NODAT than Tac, respectively (Figures 1 and 2, respectively). A 53% higher risk of NODAT associated with Tac versus a non-Tac regimen was previously reported by Kasiske et al. in their landmark study in 2003 [9]. In a randomized clinical trial, Vincenti et al. showed that CSA was associated with a lower incidence of NODAT than tacrolimus at Month 6 posttransplant [18]. The lower diabetogenicity of CSA than Tac has been further supported by literature showing that switching from Tac to CSA in KTRs resulted in resolution of NODAT [49].
In a study of 20 124 KTRs, Johnston et al. [50] showed that SRL regimens increased the risk of NODAT compared with CSA + MPA/azathioprine regimens. Aside from confirming the above findings in a larger and more contemporary KTR population, our study further highlighted the comparative diabetogenicity of SRL regimens: SRL + Tac was the most diabetogenic, followed by SRL + MPA, and SRL + CSA was the least diabetogenic (Figures 1 and 2). In clinical practice, these findings may be incorporated with other data in tailoring immunosuppression to lower diabetogenic risk.
Viral serology and NODAT
A prospective study showed an association of subclinical or treated CMV infection with an increased risk of posttransplant diabetes; the proposed mechanisms for the diabetogenicity of CMV included decreased insulin secretion and increased insulin resistance due cytokine-mediated damage and apoptosis of pancreatic beta cells [8]. In this study, we found a 12% higher risk of NODAT associated with a CMV+ serology at kidney transplant (Figure 1). Since existing literature speaks mainly of the association between active CMV infection and NODAT [8], our finding associating CMV+ serology with an increased risk of NODAT in KTRs is novel. Further studies would be needed to confirm the underlying mechanism of this finding. Furthermore, we showed that CSA + MPA was associated with 27% and 32% lower risks of NODAT than Tac + MPA, in CMV+ or CMV− KTR, respectively; mean while, SRL + Tac was associated with 44% and 36% higher risks of NODAT than Tac + MPA in CMV+ or CMV− KTR, respectively (Figure 3). We hypothesize that if studied in a controlled clinical trial, an anti-CMV prophylactic or pre-emptive protocol combined with the use of CSA + MPA for immunosuppression in low-rejection risk KTR would have a salutary effect in reducing the incidence of NODAT.
Consistent with other reports, our study showed that HCV infection was a risk factor for NODAT [9, 21, 38] (Figure 1). Furthermore, our study showed that CSA + MPA was associated with 53% and 26% lower risks of NODAT than Tac + MPA in HCV+ and HCV– KTR, respectively (Figure 3). Our findings differed from a retrospective study that reported a higher incidence of NODAT in KTRs on Tac versus CSA exclusively in HCV+, not in HCV, KTR [42]. Novel findings from our study are: both Tac + MPA and SRL + Tac were associated with a higher risk of NODAT than CSA + MPA in HCV– KTR, and only Tac + MPA was associated with a higher risk of NODAT than CSA + MPA in HCV+ KTR (Figure 3). Based on the wide CI in the Cox analysis (Figure 3), the HR for NODAT associated with Tac + SRL in HCV+ KTR may be due to lack of statistical power in the subgroup rather than a clinical cause.
Our multivariate Cox regression analysis revealed that corticosteroid as a component of maintenance immunosuppression at discharge was not an independent risk factor for NODAT (HR 1.07, 95% CI 0.92–1.25). This finding is consistent with the results of multiple clinical trials [18, 21, 29, 30, 32]. Our analysis also showed that induction with anti-IL-2, CD25 receptor antibody was associated with a higher risk for NODAT compared with anti-thymocyte globulin, alemtuzumab and other induction agents (Figure 1, data below the graph). Previous studies that showed an association of anti-IL-2, CD25 receptor antibody induction with NODAT were from single centers and included smaller sample sizes (n = 74–134) [34–36]. To our knowledge, our study has been the largest that compared the risk of NODAT associated with induction using anti-IL-2, CD25 receptor antibody versus T-cell-depleting antibody agents.
Limitations of our study included the lack of standardized diagnostic criteria for NODAT used by transplant centers, absence of data on the doses and/or drug levels for corticosteroids and other immunosuppressant drugs, and lack of information on other NODAT risk factors [33].
In conclusion, our study showed that pretransplant HCV or CMV serology and specific immunosuppression regimens are associated with NODAT. Choosing maintenance immunosuppression regimen based on HCV or CMV serology may modify the risk of NODAT in the first year after kidney transplant. Further studies on the impact of interactions between other risk factors and immunosuppression regimens on the risk of NODAT would help reduce this complication through an individualized risk-based selection of rejection prophylaxis regimen in KTRs.
ACKNOWLEDGEMENTS
The data reported here have been supplied by the Minneapolis Medical Research Foundation as the contractor for the SRTR. The interpretation and reporting of these data are the responsibility of the authors and in no way should be seen as an official policy of or interpretation by the SRTR or the US Government.
FUNDING
This work was supported by the Gatorade Trust through funds distributed by the University of Florida, Department of Medicine.
AUTHORS’ CONTRIBUTIONS
A.H.S., X.W., C.C.: participated in research design; X.W., C.C., A.H.S.: participated in performance of the research; A.H.S, X.W., M.J.C., K.L.W.: participated in writing of the article; and A.H.S, M.J.C, K.L.W., X.W., C.C.: participated in data analysis.
CONFLICT OF INTEREST STATEMENT
None declared.


Comments