


Abstract
Promoter mutation in the human telomerase reverse transcriptase gene (hTERT) occurs in ~75% of primary glioblastoma (GBM). Although the mutation appears to upregulate telomerase expression and contributes to the maintenance of telomere length, its clinical significance remains unclear.
We performed hTERT promoter genotyping on 303 isocitrate dehydrogenase 1 wild-type GBM tumors treated with standard chemoradiotherapy. We also stratified 190 GBM patients from the database of The Cancer Genome Atlas (TCGA) by hTERT gene expression. We analyzed overall and progression-free survival by Kaplan–Meier and Cox regression.
We detected hTERT promoter mutation in 75% of the patients. When included as the only biomarker, hTERT mutation was not prognostic in our patient cohort by Cox regression analysis. However, when hTERT and O6-DNA methylguanine-methyltransferase (MGMT) were included together, we observed an interaction between these 2 factors. To further investigate this interaction, we performed pairwise comparison of the 4 patient subcohorts grouped by hTERT-MGMT status (MUT-M, WT-M, MUT-U, and WT-U). MGMT methylated patients showed improved survival only in the presence of hTERT promoter mutation: MUT-M versus MUT-U (overall survival of 28.3 vs 15.9 mos, log-rank P < .0001 and progression-free survival of 15.4 vs 7.86 mo, log-rank P < .0001). These results were confirmed by Cox analyses. Analogously, the cohort from TCGA demonstrated survival benefit of MGMT promoter methylation only in patients with high hTERT expression. In addition, hTERT mutation was negatively prognostic in our MGMT unmethylated patients, while the analogous association with high expression was not observed in the cohort from TCGA.
The prognostic influence of MGMT promoter methylation depends on hTERT promoter mutation. This interaction warrants further mechanistic investigation.
Glioblastoma (GBM) is the most common and lethal form of primary brain cancer, whose prognosis remains poor despite ongoing advances in treatment. Recent reports indicate that 70%–80% of GBM genomes harbor either C228T or C250T mutations in the promoter region of the human telomerase reverse transcriptase gene (hTERT).1–9 These mutations upregulate the hTERT gene product in GBM5,10 and other cancers.2,3,11,12 In doing so, hTERT mutation may represent the predominant mechanism underlying the maintenance of telomere length necessary to achieve replicative immortality in GBM cells. Despite accumulating studies demonstrating such a functional role of hTERT promoter mutation, consensus on their prognostic value in GBM has not been established.1–10,13,14 Several studies showed worse overall survival (OS) and progression-free survival (PFS) in the hTERT mutant group,2–9,13 while others1,10,14 showed no difference in survival between hTERT mutant and hTERT wild-type (wt) patients. These disparate findings may be explained by small cohort size and lack of genetic, pathological, and treatment homogeneity in these cohorts.
Multiple retrospective studies have investigated the association of hTERT promoter mutation with several known biomarkers in GBM and found that the significance of hTERT promoter mutation depends on the genetic background of the tumor. For example, hTERT promoter mutation is associated with better outcome in gliomas with mutation in the isocitrate dehydrogenase 1 gene (IDH1),3,6 and GBM with epidermal growth factor receptor (EGFR) amplification.4 In addition, hTERT promoter mutational status appears to influence the clinical significance of EGFR amplification: EGFR amplification was reported to associate with better outcome in hTERT mutant patients, but with poorer outcome in hTERT-wt patients.4,8 These results support the notion that hTERT promoter mutation is likely to be an important genetic event. However, its clinical significance may manifest differently depending on genetic context.
In the past decade, promoter methylation in the O6-methylguanine-DNA-methyltransferase gene (MGMT) has provided an avenue to stratify GBM outcome. Methylation of MGMT promoter disrupts the tumor’s DNA repair mechanism by silencing MGMT expression,15,16 which subsequently sensitizes GBM to temozolomide, an alkylating agent, and portends a survival benefit for patients receiving standard chemoradiotherapy.15,17,18 Nencha and colleagues8 studied both hTERT promoter mutation and MGMT promoter methylation in GBM patients but reported no association in incidence of the 2 markers; however, this study included only 239 (37%) of the 651 patients following standard chemoradiotherapy, and 50 patients of the 651 were IDH1 mutant. Given the importance of MGMT promoter methylation in predicting GBM patient outcome, multiple other studies have also reported no significant association in incidence between MGMT promoter methylation and hTERT promoter mutation1,4,8,9; however, no study has addressed the clinical significance of hTERT promoter mutation in the context of MGMT promoter methylation.
As the vast majority of primary GBM are IDH1-wt, we investigated hTERT promoter mutation as a potential prognostic marker in a large homogeneous primary GBM cohort, limited to only IDH1-wt patients treated with standard chemoradiotherapy. By analyzing data from 303 IDH1-wt treatment naïve GBM patients treated at the University of California Los Angeles (UCLA) and Kaiser Permanente Los Angeles (KPLA), we observed an interaction between hTERT promoter mutation and MGMT promoter methylation. The survival benefit of MGMT promoter methylation was seen only in hTERT mutant GBM, and hTERT promoter mutation was a negative prognostic indicator in MGMT unmethylated patients. Similarly, analysis of 190 patients from the database of The Cancer Genome Atlas (TCGA) showed that the benefit of MGMT promoter methylation was seen only in high hTERT expressing GBM.
Materials and Methods
Patient Data Collection
UCLA/Kaiser cohort.
We retrospectively identified 303 IDH1-wt primary glioblastoma patients from UCLA and KPLA for hTERT promoter sequencing and survival analyses. Two hundred and twenty-eight patients came from a previously reported cohort.16 All patients were diagnosed from March 2001 to October 2013, had DNA isolated from treatment naïve formalin-fixed, paraffin-embedded tumor samples, and received first-line treatment with concurrent radiation and temozolomide. Two hundred and seventy-seven patients (91%) received sufficient dose of radiotherapy (≥5400cGy) and 11 patients (4%) received whole brain radiation or planned to receive less than sufficient radiation dose. Among the remaining 15 patients, 2 developed adverse events secondary to radiation therapy, hence received less than sufficient dose, while the rest showed unclear reasons for early termination due to lack of clinical follow-up around the radiotherapy period. Pathological diagnosis was reviewed at UCLA (n = 258) or collected from outside-institution pathological reports (n = 45).
The Cancer Genome Atlas cohort.
Gene expression of hTERT and OS data were collected from TCGA for 190 de novo, IDH1-wt, primary GBM patients, all of whose diagnoses were after 2005; they all received temozolomide after surgical resection and had MGMT promoter methylation reported by Brennan et al.19 The majority of patients (n = 171) received radiotherapy, while the remaining patients (n = 19) had unclear documented radiation treatment. As only a small subset of IDH-WT primary GBM patients from the database of TCGA were genotyped for hTERT promoter sequence (n = 30 in Ceccarelli et al20), we used hTERT low versus high gene expression as an approximate surrogate for wild-type versus mutant promoter, respectively, based on previous studies showing relative increased hTERT expression in hTERT mutant GBM.1,5,6,9,10,13
Detection of Biomarker Status
Genomic DNA from formalin-fixed, paraffin-embedded sample blocks was isolated using the Recoverall Total Nucleic Acid Isolation Kit (Ambion) and the DNeasy Blood & Tissue Kit (Qiagen), respectively. PCR amplification of hTERT promoter was performed using forward primer, 5ʹ–AGCACCTCGCGGTAGTGG–3ʹ and reverse primer, 5ʹ– GGCCGATTCGACCTCTCT–3ʹ. The product was confirmed by agarose gel electrophoresis and cleaned up using the MinElute PCR Purification Kit (Qiagen). Purified PCR products were sequenced using the BigDye Terminator v1.1 and analyzed on a 3730 sequencer, both from Applied Biosystems. All PCR products were sequenced using forward primer as described above. Reverse primer was used to confirm only samples that failed sequencing with forward primer.
IDH1 genotype and MGMT promoter methylation status were previously reported for 225 patients from the previous study,16 while the remainder were tested using Sanger sequence and methylation-specific PCR as previously described16,21 in our laboratory or from routine clinical testing by a lab (LabCorp) certified by the Clinical Laboratory Improvement Amendments as described in Vlassenbroeck et al.22 Among 303 UCLA/Kaiser patients, all carried IDH1-wt. Eighty-four patients were subsequently sequenced for IDH2 genotype and confirmed to have IDH2-wt. Based on the low incidence of IDH2 mutation in IDH1-wt GBM, which was found to be ~0.6% from our institutional experience, IDH2 genotyping was discontinued for the remaining 219 cases. The collection of the brain tumor samples was approved by the UCLA institutional review board, and informed consent was obtained from all patients.
Statistical and Survival Analyses
The primary objective was to assess OS for both cohorts and PFS for only the UCLA/Kaiser cohort. OS was determined from the date of tumor diagnosis by surgery to the date of death/censor. Patients who were lost to follow-up with unobtainable dates of death or had the last follow-up before the freeze date on September 21, 2015 were censored on their last known clinical visit or imaging study. Patients with the last follow-up after the freeze date were censored on September 21, 2015. We followed the same protocol described by Lalezari et al16 to calculate PFS, using the freeze date of September 21, 2015. The majority of PFS (n = 220) were available from a previous study16; only patients who were stable at the time of the previous study were reviewed again for PFS. An additional 49 patients who had MRI scans available were reviewed as previously described.16 In cases where scans were not available (n = 30), the original neuro-oncologist progression date was used. Four patients from the UCLA/Kaiser cohort were excluded from PFS analysis due to lack of radiological follow-up.
Patient characteristics were summarized using descriptive statistics and compared between hTERT mutant versus wild-type subjects using the Wilcoxon rank sum test for continuous variates and the chi-square test for categorical variables. Statistical analyses were carried out using SAS v9.4. Since this was an exploratory study, alpha level was not adjusted for multiple comparisons, and significance level was assigned at P < .05.
Survival curves were generated using Kaplan–Meier analysis in the R package. The Cox proportional hazard regression model was used to study the prognostic significances of hTERT promoter mutation, both with and without MGMT promoter methylation, on OS and PFS, while other important clinical factors were adjusted (such as age, gender, KPS, extent of resection status, and whether the patient received bevacizumab treatment). Upfront bevacizumab factor was included in the Cox regression model evaluating PFS to control for early benefit from bevacizumab observed in PFS.23
Multiple Cox regression models were developed. Besides the clinical factors, hTERT promoter mutation and MGMT promoter methylation were included in the model individually first, then jointly, including hTERT promoter mutation by an MGMT promoter methylation interaction term. Following the interaction in the Cox regression analysis, we performed single degree of freedom analysis for the 4 patient groups defined by hTERT promoter mutation and MGMT promoter methylation status while controlling for other clinical factors and patient groups. In the last model, we performed pairwise comparisons while controlling for other clinical factors, to evaluate the effect of hTERT promoter mutation or MGMT promoter methylation in the context of each other, such as MGMT methylated versus unmethylated hazard ratio (HR) for given hTERT mutational status and hTERT mutant versus wild-type HR for given MGMT methylation status.
To validate the stability of the interaction between the 2 biomarkers and the dependence of each marker’s survival benefit on the other, we used bootstrap analysis to obtain unbiased estimates of HR and its 95% confidence interval.24–26 We performed random resampling with replacement from the original dataset to obtain a new dataset with equal size and carried out Cox regression analysis using the new data. We repeated the above steps 1000 times and calculated the mean HR and 95% CI for each parameter using the analysis results of the 1000 bootstrap datasets. Bootstrap analysis was carried out using SAS v9.4.
Several studies reported a strong association between hTERT promoter mutation and high hTERT gene expression in GBM1,5,6,9,10,13; hence, we analyzed OS of the primary GBM cohort from TCGA with available hTERT gene expression data. The same methods were applied to investigate the significance of hTERT gene expression level on predicting IDH1-wt GBM patient outcome from the dataset of TCGA.
Results
Human TERT Promoter Mutation Alone Is Not Associated with IDH1-wt Primary GBM Patient Survival
In order to resolve conflicting reports regarding the significance of hTERT promoter mutation in primary GBM, we sought to investigate hTERT promoter mutation as a potential biomarker in a large homogeneous GBM patient cohort. We genotyped 303 IDH1-wt GBM samples and detected a total of 228/303 hTERT mutations (75%), distributed as 177 patients (78%) with C228T mutation and 51 patients (22%) with C250T mutation. Patients carrying the C228T mutation had improved median PFS, but not OS, compared with patients with C250T mutation (Fig. 1A–B). Based on this observation, we combined both mutations into a single hTERT mutant group for further survival analysis. Patient demographics and clinical summary are presented in Table 1.
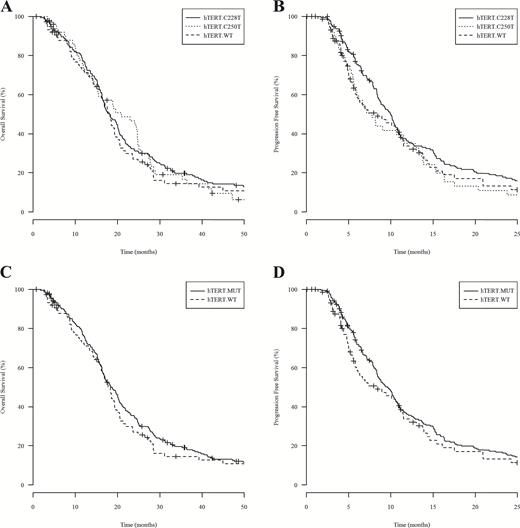
Kaplan–Meier analysis of 303 UCLA/Kaiser patients evaluating the survival benefit of hTERT promoter mutation. (A) and (B) show OS and PFS, respectively, for patients with hTERT C228T variant (hTERT C228T, median OS=18.2 mo and PFS=10.0 mo), patients with hTERT C250T variant (hTERT C250T, median OS=20.9 mo and PFS=7.79 mo), and patients with hTERT wild-type (hTERT WT, median OS and PFS = 17.8 mo and 8.45 mo). Log-rank P values comparing median OS and PFS between hTERT C228T versus C250T were 0.7910 and 0.0306, respectively. (C) and (D) show OS, in months, and PFS, in months, respectively, for patients carrying hTERT promoter mutation (hTERT.MUT) and patients with hTERT wild-type (hTERT.WT).
Demographic characteristics of 303 IDH1-wt primary GBM patients in UCLA/Kaiser cohort
| UCLA/Kaiser Patient Characteristics (n = 303) | hTERT MUT | hTERT WT | P value | |
|---|---|---|---|---|
| (n = 228, 100%) | (n = 75, 100%) | |||
| Age | Mean ± SD | 58.6±9.8 | 54.3±14.3 | * P = .0433 |
| Median, IQR | 58.9, 52.6–65.9 | 56.7, 45.6–65.5 | ||
| Gender | Male | 130 (57.0%) | 47 (62.7%) | ǂ P = .3892 |
| Female | 98 (43.0%) | 28 (37.3%) | ||
| KPS status | 100 | 39 (17.1%) | 8 (10.8%) | *P = .0117 |
| 90 | 115 (50.5%) | 33 (44.6%) | ||
| 80 | 52 (22.8%) | 15 (20.2%) | ||
| 70 | 14 (6.1%) | 9 (12.2%) | ||
| ≤60 | 8 (3.5%) | 9 (12.2%) | ||
| [NA] | [1] | |||
| Extent of resection | Gross total resection | 108 (48.0%) | 47 (63.5%) | ǂ P = .0205 |
| Subtotal resection/ Biopsy | 117 (52.0%) | 27 (36.5%) | ||
| [NA] | [3] | [1] | ||
| MGMT | M | 93 (40.8%) | 25 (33.3%) | ǂ P = .2507 |
| U | 135 (59.2%) | 50 (66.7%) | ||
| Upfront bevacizumab | Yes | 55 (24.2%) | 13 (17.3%) | ǂ P = .2151 |
| No | 172 (75.8%) | 62 (82.7%) | ||
| [NA] | [1] | |||
| Bevacizumab at recurrence | Yes | 130 (57.0%) | 29 (38.7%) | ǂ P = .0058 |
| No | 98 (43.0%) | 46 (61.3%) | ||
| Received bevacizumab (any time) | Yes | 151 (66.2%) | 38 (50.7%) | ǂ P = .0158 |
| No | 77 (33.8%) | 37 (49.3%) | ||
Abbreviations: IQR, interquartile range; MUT: mutant; M: methylated; U: unmethylated; NA: not available
*Wilcoxon rank sum test ǂ chi-square test.
By Kaplan–Meier analysis, patients with hTERT promoter mutation demonstrated similar median OS of 18.5 months (n = 228) versus 17.8 months (n = 75) in hTERT-wt patients (log-rank P = .3845), and similar median PFS of 9.63 months (n = 224) versus 8.45 months (n = 75) in hTERT-wt patients (log-rank P = .5346; Fig. 1C–D). Confirming the univariate analysis, the Cox regression model also showed that hTERT mutation alone was not an independent predictor of outcome in IDH1-wt primary GBM patients; OS and PFS hazard ratios were 1.08 (P = .6549) and 1.03 (P = .8399), respectively (Table 2). Our result indicates that hTERT promoter mutation alone was not prognostic of patient survival in IDH1-wt GBM.
Cox regression analysis evaluating prognostic value of hTERT promoter mutation and MGMT promoter methylation individually in UCLA/Kaiser cohort
| Factors–UCLA/Kaiser Cohort | Estimated HR (95% CI) P value | Estimated HR (95% CI) P value | |||
|---|---|---|---|---|---|
| OS | PFS | OS | PFS | ||
| Age | 1.01 (1.00, 1.03), P = .0296 | 1.01 (0.99, 1.02), P = .2679 | 1.02 (1.01, 1.04), P = .0003 | 1.02 (1.01, 1.03), P = .0189 | |
| Gender | Male vs Female | 1.19 (0.92, 1.53), P = .1883 | 1.08 (0.82, 1.38), P = .6214 | 1.17 (0.91, 1.50), P = .2313 | 1.02 (0.79, 1.32), P = .8984 |
| KPS | 100–80 | 0.26 (0.15, 0.45), P < .0001 | 0.38 (0.21, 0.68), P = .0013 | 0.31 (0.18, 0.53), P < .0001 | 0.45 (0.25, 0.80), P = .0065 |
| 70 | 0.47 (0.24, 0.95), P = .0340 | 0.60 (0.29, 1.21), P = .1527 | 0.51 (0.26, 1.02), P = .0553 | 0.69 (0.34, 1.41), P = .3078 | |
| ≤60 | 1.00 (reference) | 1.00 (reference) | 1.00 (reference) | 1.00 (reference) | |
| EOR | GTR vs others | 0.61 (0.47, 0.78), P = .0001 | 0.66 (0.51, 0.85), P = .0016 | 0.66 (0.52, 0.86), P = .0017 | 0.72 (0.55, 0.93), P = .0134 |
| Bevacizumab treatment | Y vs N | 0.81 (0.61, 1.07), P = .1353 | 0.89 (0.68, 1.18), P = .4136 | ||
| Upfront bevacizumab | Y vs N | 0.78 (0.58, 1.05), P = .1013 | 0.81 (0.60, 1.08), P = .1530 | ||
| MGMT | M vs U | 0.39 (0.30, 0.52), P < .0001 | 0.43 (0.33, 0.57), P < .0001 | ||
| hTERT | MUT vs WT | 1.08 (0.78, 1.48), P = .6549 | 1.03 (0.75, 1.44), P = .8399 | ||
EOR: extent of resection; GTR: gross total resection; Y: Yes; N: No; M: methylated; U: unmethylated; MUT: mutant.
Human TERT Promoter Mutation Shows Statistical Interaction with MGMT Promoter Methylation
Promoter mutation of hTERT alone was not prognostic of GBM outcome in our cohort, but accumulating evidence supports the notion that the prognostic value of the hTERT promoter mutation depends on the overall genetic background of the patient’s tumor.3,4,6,8 Therefore, we sought to investigate the prognostic value of hTERT promoter mutation in combination with MGMT promoter methylation. As expected, we observed survival advantage of MGMT promoter methylation in the entire cohort by Kaplan–Meier and Cox analyses (Fig. 2A–B and Table 2). A Cox regression model including both factors was performed and showed an interaction between hTERT promoter mutation and MGMT promoter methylation: OS and PFS hazard ratios were 0.37 (P = .0032) and 0.41 (P = .0125; Table 3). This result was validated by bootstrap analysis (Table 3).
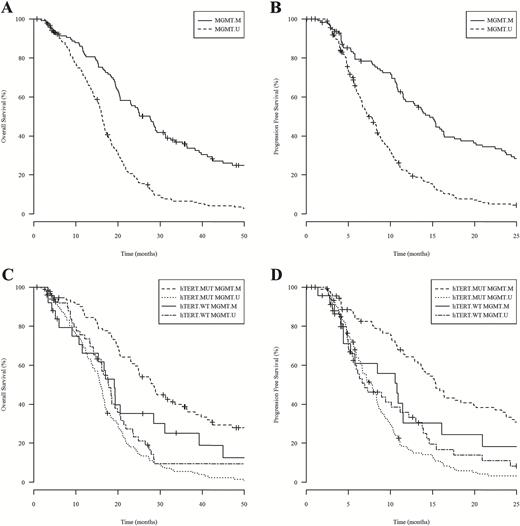
Kaplan–Meier analysis of 303 UCLA/Kaiser patients while substratifying by MGMT promoter methylation alone or in combination with hTERT promoter mutation. (A) and (B) show OS and PFS, respectively, for patients with MGMT promoter methylation (MGMT.M) and patients without MGMT promoter methylation (MGMT.U). MGMT methylated patients showed median OS of 27.6 months (n = 118) and PFS of 14.7 months (n = 114), while MGMT unmethylated patients showed median OS of 16.3 months (n = 185) and PFS of 7.36 months (n = 185). Log-rank P values comparing OS and PFS between MGMT methylated versus unmethylated patients both reach significant values (P < .0001). (C) and (D) show OS (mo) and PFS (mo), respectively, for four subgroups of patients stratified by both factors, including patients with hTERT mutation and MGMT methylated (hTERT.MUT MGMT.M), patients with hTERT mutation and MGMT unmethylated (hTERT.MUT MGMT.U), patients with hTERT wild-type and MGMT methylated (hTERT.WT MGMT.M), and patients with hTERT wild-type and MGMT unmethylated (hTERT.WT MGMT.U).
Cox regression analysis and bootstrap validation evaluating the interaction between MGMT promoter methylation and hTERT promoter mutation in predicting patient outcome, and the single degree of freedom analysis of UCLA/Kaiser cohort
| Factors–UCLA/Kaiser Cohort | OS HR (95% CI), P value | Bootstrap HR (95% CI) | PFS Survival HR (95% CI), P value | Bootstrap PFS HR (95% CI) | |
|---|---|---|---|---|---|
| Age | 1.02 (1.01, 1.03), P = .0056 | 1.02 (1.01, 1.04) | 1.01 (0.99, 1.02), P = .1877 | 1.01 (0.99, 1.02) | |
| Gender | Male vs female | 1.20 (0.93, 1.54), P = .1601 | 1.22 (0.91, 1.61) | 1.03 (0.80, 1.34), P = .8132 | 1.04 (0.80, 1.36) |
| KPS | 100–80 | 0.24 (0.13, 0.43), P < .0001 | 0.24 (0.08, 0.50) | 0.36 (0.20, 0.66), P = .0010 | 0.37 (0.18, 0.69) |
| 70 | 0.41 (0.20, 0.83), P =.0127 | 0.44 (0.11, 0.99) | 0.56 (0.27, 1.17), P = .1239 | 0.60 (0.24, 1.18) | |
| ≤60 | 1.00 (reference) | 1.00 (reference) | 1.00 (reference) | 1.00 (reference) | |
| EOR | GTR vs others | 0.67 (0.52, 0.87), P = .0026 | 0.67 (0.51, 0.87) | 0.72 (0.55, 0.94), P = .0144 | 0.72 (0.54, 0.93) |
| Bevacizumab treatment | Y vs N | 0.80 (0.60, 1.07), P = .1332 | 0.79 (0.54, 1.09) | ||
| Upfront bevacizumab | Y vs N | 0.78 (0.58, 1.05), P = .0979 | 0.77 (0.58, 0.98) | ||
| MGMT | M vs U | 0.85 (0.48, 1.52), P = .5855 | 0.89 (0.44, 1.65) | 0.88 (0.47, 1.65), P = .6931 | 0.96 (0.41, 2.06) |
| hTERT | MUT vs WT | 1.68 (1.13, 2.50), P = .0098 | 1.73 (1.13, 2.53) | 1.57 (1.05, 2.36), P = .0287 | 1.59 (0.99, 2.37) |
| hTERT by MGMT interaction | 0.37 (0.19, 0.72), P = .0032 | 0.39 (0.16, 0.76) | 0.41 (0.21, 0.83), P = .0125 | 0.43 (0.16, 0.87) | |
| OR | |||||
| hTERT-MGMT (single degree of freedom analysis) | MUT-M | 0.53 (0.34, 0.82), P = .0047 | 0.57 (0.37, 0.89), P = .0121 | ||
| WT-M | 0.85 (0.48, 1.52), P = .5855 | 0.88 (0.47 1.65), P = .6931 | |||
| MUT-U | 1.68 (1.13, 2.50), P = .0098 | 1.57 (1.05, 2.36), P = .0287 | |||
| WT-U | 1.00 (reference) | 1.00 (reference) | |||
EOR: extent of resection; GTR: gross total resection; Y: Yes; N: No; M: methylated; U: unmethylated; MUT: mutant.
To further understand the interaction between hTERT promoter mutation and MGMT promoter methylation, we performed single degree of freedom analysis of the interaction and applied a P value threshold of .0167 in order to control for type 1 (multiple comparisons) error. Three single degrees of freedom were defined as patients with hTERT.MUT-MGMT.M, hTERT.WT-MGMT.M, or hTERT.MUT-MGMT.U, who were then compared with the reference group designated as patients with hTERT.WT-MGMT.U. When the same clinical factors were controlled, we observed that patients with hTERT.MUT-MGMT.M showed the best outcome with the lowest HRs of OS (0.53, P = .0047) and PFS (0.57, P = .0121), while patients with hTERT.MUT-MGMT.U showed the worst outcome with the highest HRs of OS (1.68, P = .0098; Table 3). Our results indicate that patients with both genetic variations carried the best prognosis, which was also reflected in Kaplan–Meier analysis comparing survival of 4 patient subcohorts representing the different combinations of hTERT-MGMT (MUT-M, WT-M, MUT-U, and WT-U) (Fig. 2C–D). Interestingly, these results also indicate that hTERT promoter mutation is negatively prognostic in the unmethylated MGMT population.
Human TERT Promoter Mutation Appears Necessary for the Prognostic Value of MGMT Promoter Methylation
To further understand these results, we performed pairwise comparisons of the 4 cohorts grouped by the various hTERT (MUT/WT) and MGMT (M/U) combinations. By comparing MUT-M versus MUT-U alongside WT-M versus WT-U, we found that the survival benefit associated with MGMT promoter methylation remained only in patients carrying the hTERT promoter mutation (Fig. 2C–D). Among 228 hTERT mutant patients, MGMT methylated patients had median OS of 28.3 months (n = 93) versus 15.9 months (n = 135) in MGMT unmethylated patients (log-rank P < .0001), and median PFS of 15.4 months (n = 89) versus 7.86 months (n = 135) in MGMT unmethylated patients (log-rank P < .0001). Among 75 hTERT-wt patients, MGMT methylated patients showed median OS of 19.1 months (n = 25) versus 17.8 months (n = 50) in MGMT unmethylated patients (log-rank P = .4290), and median PFS of 10.8 months (n = 25) versus 6.94 months (n = 50) in MGMT unmethylated patients (log-rank P = .6875). Confirming these univariate findings, Cox regression analysis also showed that in hTERT mutant patients, MGMT promoter methylation was prognostic of OS and PFS: OS and PFS hazard ratios were 0.32 (P < .0001) and 0.36 (P < .0001), whereas in hTERT-wt patients, MGMT promoter methylation was not prognostic: OS and PFS hazard ratios were 0.85 (P = .5855) and 0.88 (P = .6931; Table 4). These results were validated by bootstrap analysis (Table 4). Our results show that IDH1-wt GBM patients treated with first-line radiation and temozolomide benefited from MGMT promoter methylation only in the context of hTERT promoter mutation.
Prestratified by MGMT methylation and hTERT mutation log-rank test, Cox pairwise comparison and bootstrap validation while controlling for other clinical factors (age, gender, KPS, EOR, and bevacizumab treatment) in UCLA/Kaiser cohort
| hTERT - MGMT Status | Overall Survival | Progression-free Survival | ||||
|---|---|---|---|---|---|---|
| Median Survival Log-rank P value | HR (95% CI) P value | Bootstrap HR (95% CI) | Median Survival Log-rank P value | HR (95% CI) P value | Bootstrap HR (95% CI) | |
| MUT-M vs MUT-U | 28.3 mo vs 15.9 mo P < .0001 | 0.32 (0.23, 0.43) P < .0001 | 0.31 (0.21, 0.42) | 15.4 mo vs 7.86 mo P < .0001 | 0.36 (0.27, 0.49) P < .0001 | 0.36 (0.24, 0.49) |
| WT-M vs WT-U | 19.1 mo vs 17.8 mo P = .4290 | 0.85 (0.48, 1.52) P = .5855 | 0.90 (0.44, 1.65) | 10.8 mo vs 6.94 mo P = .6875 | 0.88 (0.47, 1.65) P = .6931 | 0.96 (0.41, 2.06) |
| MUT-U vs WT-U | 15.9 mo vs 17.8 mo P = .0973 | 1.68 (1.13, 2.50) P = .0098 | 1.73 (1.13, 2.53) | 7.86 mo vs 6.94 mo P = .1395 | 1.57 (1.05, 2.36) P = .0287 | 1.59 (0.99, 2.37) |
| MUT-M vs WT-M | 28.3 mo vs 19.1 mo P = .0231 | 0.63 (0.37, 1.06) P = .0810 | 0.64 (0.32, 1.14) | 15.4 mo vs 10.8 mo P = .0318 | 0.65 (0.37, 1.14) P = .1324 | 0.65 (0.29, 1.17) |
MUT: hTERT mutant; WT: hTERT wildtype; M: MGMT methylated; U: MGMT unmethylated.
Interestingly, several additional observations can be made if we first separated patients by MGMT status (ie, comparing WT-U vs MUT-U alongside WT-M vs MUT-M). We observed by Kaplan–Meier analysis that hTERT mutant patients showed improved survival in MGMT methylated patients (log-rank P =.0231 for OS and P = .0318 for PFS), and trended toward worse survival in MGMT unmethylated patients (log-rank P = .0973 for OS and P = .1395 for PFS). However, Cox regression analysis showed that hTERT promoter mutation represented an independent predictor for both OS and PFS only in MGMT unmethylated patients; OS and PFS hazard ratios for hTERT mutant patients were 1.68 (P = .0098) and 1.57 (P = .0287), respectively (Table 4). Thus, as seen in the single degree of freedom analysis and pairwise analysis of WT-U versus MUT-U alongside WT-M versus MUT-M, hTERT mutation was prognostic of poorer outcome in the unmethylated MGMT population. These results were validated by bootstrap analysis (Table 4).
From the patient cohort at UCLA and Kaiser, we observed that hTERT mutation can be both beneficial (in enabling benefit of MGMT methylation) and harmful (in the context of MGMT unmethylated patients).
Human TERT High Gene Expression Appears Necessary for the Improved Prognosis of MGMT Promoter Methylation Based on Analysis of TCGA GBM Database
The GBM database of TCGA lacks hTERT promoter mutation information. As hTERT promoter mutation showed a strong association with high gene expression in GBM,1,5,6,9,10,13 we analyzed the database from TCGA of primary GBM patients who had both hTERT gene expression and MGMT promoter methylation data available.19 Starting with the entire GBM cohort (n = 577), we retained 190 patients who were diagnosed after 2005, and received temozolomide after surgical resection. Most patients (n = 171, 90%) received radiotherapy, while the remaining patients (n = 19, 10%) had unclear documented radiation treatment. Gene expression of hTERT was dichotomized using the expression level above the 25th percentile as indication for high hTERT gene expression, while patients with equal or lower than 25th percentile expression were stratified into the low hTERT gene expressing group. The 25th percentile cutoff point was selected based on the observation that 75% of primary GBM carried hTERT promoter mutation in our discovery UCLA/Kaiser cohort. This cutoff point yielded 48 patients with low hTERT gene expression and 142 patients with high hTERT gene expression. Detailed patient characteristics are presented in Supplementary Table 1.
Analogous to our cohort stratified by genotype, hTERT gene expression level in isolation did not predict patient survival. Patients with high hTERT expression showed a median OS of 14.9 months (n = 142) versus 12.7 months (n = 48) in patients with low expression (log-rank P = .1587) (Supplementary Fig. 1A). Kaplan–Meier analysis also demonstrated the survival benefit of MGMT promoter methylation only in patients with high hTERT gene expression. In 142 patients with high hTERT expression, patients with MGMT methylation had median OS of 17.8 months (n = 68) versus 13.9 months (n = 74) from patients with unmethylated MGMT (log-rank P = .0026), whereas in 48 patients with low hTERT expression, MGMT methylated patients had median OS of 12.7 months (n = 21) versus 12.2 months (n = 27) from patients with unmethylated MGMT (log-rank P = .9967; Supplementary Fig. 1B). In addition, the Cox regression model demonstrated that MGMT promoter methylation was prognostic for patient survival only in the context of high hTERT expression (OS HR = 0.61, P = .0303) and not in patients with low hTERT expression (OS HR = 0.84, P = .6407) (Supplementary Table 2).
We obtained similar results using the median expression as the cutoff point for hTERT dichotomization (Supplementary Table 1 and 2; Supplementary Fig. 2A–B). The cohort from TCGA supports the observations in our discovery cohort that the survival benefit from MGMT promoter methylation is present only in the context of increased hTERT expression, which has been shown to associate with hTERT promoter mutation.1,5,6,9,10,13 However, low hTERT gene expression was not found to be associated with poorer survival in MGMT unmethylated patients as observed in our discovery cohort.
Discussion
Despite the high frequency of hTERT promoter mutation in primary GBM, its clinical significance remains unclear. By retrospectively genotyping the hTERT promoter region for 303 IDH1-wt primary GBM patients treated with radiation and temozolomide, we detected hTERT promoter mutation in 75% of our patients, confirming the findings from other reported cohorts.2–10 Our results showed that hTERT promoter mutation as the sole molecular marker did not predict OS or PFS in the UCLA/Kaiser patient cohort, supporting the findings from a smaller study of 53 patients, in which, like our study, only IDH1-wt GBM patients treated with standard chemoradiotherapy were included.1 Unexpectedly, however, when MGMT promoter methylation and hTERT promoter mutation were included together, we discovered a statistical interaction that led us to the observations that hTERT promoter mutation enabled the MGMT methylation benefit and was a negative prognostic marker in MGMT unmethylated patients.
This dual prognostic nature of hTERT promoter mutation may explain conflicting results reported in the literature on whether hTERT promoter mutation is a negative prognostic marker. Our results clearly indicate that interpretation of studies correlating hTERT promoter mutation with survival must consider both the percentage of patients receiving temozolomide and the percentage of patients with methylated/unmethylated MGMT promoters. Since patients carrying methylated MGMT promoter showed minimal survival benefit over MGMT unmethylated patients in the absence of first-line temozolomide treatment,15MGMT methylated patients who were not exposed to temozolomide after tumor resection might behave similarly to MGMT unmethylated patients, allowing the hTERT promoter mutation to predominate as a negative prognostic factor. In addition, even when all patients received temozolomide upfront, if more MGMT unmethylated patients were included in the cohort, the survival outcome would be skewed, again leading to the conclusion that hTERT promoter mutations are associated with poor survivals in these studies.2–4,6,8,9,13
We also analyzed an independent cohort of 190 IDH1-wt primary GBM patients, who had both hTERT gene expression and MGMT promoter methylation data available from the database of TCGA,19 and investigated the interaction of the 2 biomarkers. Despite the strong association between the promoter mutation and increased gene expression in GBM,1,5,6,9,10,13 some hTERT-wt tumors show a relatively high level of hTERT mRNA expression under different mechanisms (ie, hypermethylation of hTERT promoter).27 In addition, only a small subset (n = 30) of IDH1-wt primary GBM from the database of TCGA were genotyped for hTERT promoter sequence, and all samples were reported to carry hTERT promoter mutation.20 Therefore, hTERT gene expression from the cohort of TCGA may not represent an adequate surrogate for hTERT promoter mutation and limits the ability of these results to validate findings in our cohort. However, this analysis has utility as a complementary approach to support the results obtained by hTERT genotyping in our discovery cohort. TCGA cohort demonstrated similar results, showing that high hTERT gene expression in isolation did not predict patient OS but enabled MGMT promoter methylation survival benefit, which was not observed in patients with low hTERT gene expression. Low hTERT gene expression, however, was not found associated with poorer survival in MGMT unmethylated patients as observed in our discovery cohort. This lack of confirmation might be due to the expression threshold for dichotomization or the lack of homogeneity in salvage treatment across patients in the dataset from TCGA.
The interaction between hTERT mutation and MGMT methylation may have biological implications. Promoter mutation of hTERT is associated with higher hTERT gene and telomerase activity,1,5,6,9,10,13 whose main function is telomere maintenance.28,29MGMT encodes for a DNA repair enzyme that repairs alkylation of the O6 position on guanine.30 Promoter methylation silences MGMT gene expression and predicts improved outcome in primary GBM patients treated with radiation and temozolomide.15–17,31 Thus, our observation that the survival advantage of MGMT promoter methylation only occurs in hTERT mutant patients suggests that temozolomide sensitivity may depend on telomerase activity in addition to reduced MGMT repair activity. We hypothesize that high hTERT gene expression via promoter mutation could enhance the tumor sensitivity to temozolomide treatment. This is supported by a study showing that telomerase inhibition using catalytically inactive and dominant-negative forms of hTERT increased resistance of melanoma cells to temozolomide.32 This hypothesis warrants further experimental investigation, with the possible clinical implication that pharmacological inhibitors of telomerase activity may be unsuitable for concurrent use with temozolomide.
The worse survival associated with hTERT promoter mutation in MGMT unmethylated patients may also have biological consequences by suggesting that hTERT promoter mutation could intrinsically promote glioblastomas to behave more aggressively. Further studies looking at association of hTERT promoter mutation with other radiological and pathological phenotypes in GBM, such as proliferative rate and Ki67 index, might show promising findings. Moreover, this observation suggests the use of telomerase inhibitors that are currently under clinical investigation, such as imetelstat,33,34 in treating IDH1-wt primary GBM tumors, which do not carry MGMT promoter methylation.
While we believe that our study, by virtue of the large patient cohort, homogeneous treatment, complete MGMT promoter methylation status, and analysis of the dataset of TCGA, provides useful insight regarding the use of hTERT promoter mutation as a prognostic marker, we acknowledge that this is a retrospective study and could include selection biases or treatment variation that may affect the results. While we attempted to minimize the differences in treatment by selecting only patients receiving radiation and temozolomide after tumor resection, patients might be exposed to a variety of other salvage chemotherapies throughout their treatment, which might contribute unknown benefit or disadvantage to patient survival. Our findings need to be validated in an independent cohort in which hTERT genotype is assessed.
In summary, using a large cohort of homogeneously treated IDH1-wt GBM patients, we provide evidence that the hTERT promoter mutation has different prognostic implication depending on the MGMT promoter methylation status of the patient. The co-occurrence of hTERT promoter mutation and MGMT promoter methylation classified a subgroup of IDH1-wt GBM with the best prognosis and may mechanistically contribute to the beneficial effects of MGMT promoter methylation. On the other hand, hTERT mutation may potentially portend a more aggressive GBM when MGMT is unmethylated. Further investigation is required to understand these interactions and ultimately to determine whether hTERT inhibition will have a clinical role.
Supplementary material
Supplementary material is available online at Neuro-Oncology (http://neuro-oncology.oxfordjournals.org/)
Funding
This work was supported by the National Institutes of Health (R01CA179071); Art of the Brain; and the Bradley Zankel Foundation.
Acknowledgments
We thank SiliconMed for providing data aggregation and search support and the UCLA Brain Tumor Translational Resource (BTTR) for logistical and technical support.
Conflict of interest statement. None.
References
Author notes
Corresponding Author: Albert Lai, MD, PhD, UCLA Neurology, 710 Westwood Plaza, RNRC 1–230, Los Angeles, CA 90095 (albertlai@mednet.ucla.edu).


