


Abstract
The Population Assessment of Tobacco and Health (PATH) Study is a nationally representative cohort of tobacco product users and nonusers. The study’s main purpose is to obtain longitudinal epidemiologic data on tobacco use and exposure among the US population.
Nicotine biomarkers—cotinine (COT) and trans-3′-hydroxycotinine (HCT)—were measured in blood samples collected from adult daily tobacco users and nonusers during Wave 1 of the PATH Study (2013–2014; n = 5012; one sample per participant). Participants’ tobacco product use and exposure to secondhand smoke were categorized based on questionnaire responses. Nonusers were subdivided into never users and recent former users. Daily tobacco users were classified into seven tobacco product use categories: exclusive users of cigarette, smokeless tobacco, electronic cigarette, cigar, pipe, and hookah, as well as polyusers. We calculated sample-weighted geometric mean (GM) concentrations of cotinine, HCT, and the nicotine metabolite ratio (NMR) and evaluated their associations with tobacco use with adjustment for potential confounders.
The GMs (95% confidence intervals) of COT and HCT concentrations for daily tobacco users were 196 (184 to 208) and 72.5 (67.8 to 77.4) ng/mL, and for nonusers they were 0.033 (0.028 to 0.037) and 0.021 (0.018 to 0.023) ng/mL. Exclusive smokeless tobacco users had the highest COT concentrations of all user groups examined. The GM NMR in daily users was 0.339 (95% confidence interval: 0.330 to 0.350).
These nationally representative estimates of serum nicotine biomarkers could be the basis for reference ranges characterizing nicotine exposure for daily tobacco users and nonusers in the US adult population.
This report summarizes the serum nicotine biomarker measurements in Wave 1 of the PATH Study. We are reporting the first estimates of HCT in serum for daily tobacco users and nonusers in the noninstitutionalized, civilian US adult population; the first nationally representative serum COT estimates for daily exclusive users of different tobacco products and daily polyusers; and the first nationally representative estimate of the serum NMR in daily tobacco users by age, race/ethnicity, and sex.
Introduction
In 2011, the Population Assessment of Tobacco and Health (PATH) Study was launched by the Food and Drug Administration Center for Tobacco Products in collaboration with the National Institutes of Health National Institute on Drug Abuse. The study’s main purpose is to obtain longitudinal epidemiologic data on tobacco use and exposure among the US population to inform Food and Drug Administration’s regulatory actions under the Tobacco Control Act.1 Extensive information on tobacco-use patterns are collected from participants annually, and biospecimens including urine and blood were collected from the adults at Wave 1 (W1) (September 12, 2013 to December 15, 2014).
Exposure to tobacco, whether through active use of tobacco products or passive exposure through secondhand smoke (SHS), can be monitored by measuring nicotine or its metabolites in biological specimens. Cotinine (COT) and trans-3′-hydroxycotinine (HCT) are the two predominant nicotine metabolites measured in serum.2–4 These metabolites are generally preferred over nicotine itself as biomarkers of tobacco exposure5–7 because their concentrations in serum are greater and their elimination half-lives are significantly longer.8–10 Approximately 70%–80% of the absorbed nicotine is converted to COT, and approximately 60% of COT is further metabolized to HCT; together, these metabolites account for 60%–80% of absorbed nicotine.11 There is considerable interindividual variability in nicotine pharmacokinetics due to physiologic factors (age, sex, race, ethnicity, kidney function, genetics, etc.) as well as medications used. Metabolism of nicotine to COT and of COT to HCT involve the genetically polymorphic liver enzyme CYP2A6.11–13 The molar concentration ratio of HCT to COT is known as the nicotine metabolite ratio (NMR). It is commonly used as a marker of CYP2A6 enzymatic activity, the rate of nicotine metabolism, and total nicotine clearance.14,15 A significant advantage of the NMR over CYP2A6 genotyping is that it incorporates genetic as well as other (eg, estrogenic16) influences on CYP2A6 activity and nicotine clearance. The molar sum of COT and HCT (COT + HCT) better captures the total amount of nicotine exposure than either analyte alone, so we calculated this summary variable in the current analysis.
COT can be measured in serum, saliva, urine, hair, and other biological matrices. Nicotine metabolite concentrations in serum represent the circulating levels of those metabolites, whereas urinary concentrations fluctuate more and are influenced by hydration. Nevertheless, serum, saliva, and urinary levels of COT are highly correlated.17,18 Measurements of urinary nicotine metabolites obtained in W1 of the PATH Study are published elsewhere.19 There are a few nationally representative studies that use COT measurements to evaluate population-wide exposure to nicotine for both active smokers and nonsmokers. Among them are the National Health and Nutrition Examination Survey (NHANES) which includes measurements of serum and urinary COT levels in the US population,20 the Canadian Health Measures Survey which measures urinary COT levels of Canadians,21 and the Health Survey for England which measures salivary COT levels in English smokers and nonsmokers.22 However, these major surveys are cross-sectional in design and focused on exposure to SHS in nonsmokers. The PATH Study is unique because it is focused on tobacco users and the various types of tobacco products they use. It is longitudinal in design so it can measure changes in tobacco biomarker concentrations in the US population as regulatory changes are made to tobacco products.
The primary objective of this analysis was to summarize the serum nicotine biomarker levels in US adult daily tobacco users and nonusers overall, by major demographic variables, and by tobacco user group using data from W1 of the PATH Study. We are reporting serum levels of COT, HCT, and COT + HCT, and the calculated NMR among adult US daily users of a variety of tobacco products and serum levels of COT and HCT among US nonusers of tobacco. These results represent a cross-sectional analysis of the serum nicotine biomarker levels for current, recent former (within 12 months), and never users of tobacco products in the US civilian, noninstitutionalized population at the time of W1 (September 2013 to December 2014).
Methods
Study Population and Interview Data
The PATH Study is a longitudinal cohort study of approximately 46 000 adults and youth in the United States, ages 12 years and older. Address-based, area-probability sampling, with an in-person household screener to select youths and adults, was used to obtain a nationally representative sample of the noninstitutionalized, civilian US population. Tobacco users aged 18 years and up, young adults aged 18 to 24, and African Americans were oversampled relative to US population proportions. Sample weighting adjusted for oversampling and nonresponse in the probability sample so that weighted estimates are representative of the population. The PATH Study used audio-computer-assisted self-interviews to collect information on tobacco-use patterns and associated health behaviors. The interview questionnaire asked about the use of nicotine-containing products over the 3-day period prior to biospecimen collection.1 W1 data used for this analysis comprise one observation for each participant (n = 32 320; adults ≥ 18 years old). To ensure participants represented diverse tobacco product use patterns—including users of multiple tobacco products (polyusers) and never users of any tobacco product—a stratified probability sample was taken from W1 adult participants who had completed the interview questionnaire and provided a urine specimen. Of these 11 522 adults, 7159 also provided a blood specimen and are the basis for results reported here. New weights were calculated to enable statistics estimated from this subsample of 7159 adults with analyzed sera to be representative of the target population and to account for differences between the subsample and the full set of adult interview respondents. Further details regarding the PATH Study design and methods are published elsewhere.1 Details on survey interview procedures, questionnaires, sampling, weighting, and information on accessing the data are available on the PATH Study website at https://doi.org/10.3886/Series606. Westat’s Institutional Review Board approved the study design and data collection protocol.
Biospecimen Collection Procedures
All W1 adult respondents were asked to provide biospecimens. Blood was collected by trained phlebotomists from 14 520 (44.9%) participants. Biospecimens were stored between 2°C and 8°C immediately after collection and shipped overnight to the PATH Study biorepository. After processing, serum specimens were shipped overnight on dry ice to the Centers for Disease Control and Prevention laboratories where they were stored at −80°C until ready for analysis.
Serum COT and HCT Measurement
COT and HCT were measured by isotope dilution high-performance liquid chromatography—atmospheric pressure chemical ionization tandem mass spectrometry using a modified version of the method of Pirkle et al.23 Briefly, a 50 µL aliquot of internal standard solution containing isotopically labeled COT and HCT was added to 200 µL serum. The mixture was basified and applied to a supported liquid extraction plate. The analytes were eluted with 5% isopropanol in methylene chloride, the organic extract was dried, the residue was reconstituted in water and injected onto an high-performance liquid chromatography column. COT and HCT were monitored and identified by their retention times and precursor/product ion pairs. Concentrations were derived from the area ratios of native to labeled compounds in the sample by comparison to a standard curve using 1/x weighted linear regression. Samples with concentrations above the highest standard in the calibration curve were diluted and re-analyzed. The inter- and intra-day precision of the method ranged from 1.2% to 15.0% and the accuracy ranged from 91% to 109% depending on the analyte and concentration. The limits of detection (LODs) were 0.015 ng/mL for both analytes. Two quality control samples and one water blank were analyzed along with 21 unknown samples in each analytical run. All biomarker results met quality control/quality assurance protocols of the Centers for Disease Control and Prevention National Center for Environmental Health, Division of Laboratory Sciences.24
Demographic Variables
PATH Study participants reported information on sex, age, race, Hispanic origin, and educational attainment. We categorized race/ethnicity as: Hispanic, non-Hispanic Black (NHB), non-Hispanic White (NHW), and other/multi-race. Educational attainment was categorized as: less than high school graduate, high school graduate/GED, some college/associate degree, and bachelor/advanced degree.
Tobacco Use Categories
The current analysis includes data from 5012 adults who provided blood specimens in the probability sample and reported they were either daily tobacco users (3741) or nonusers of tobacco (1271). We excluded participants who reported nicotine replacement therapy use (72), were missing biomarker data (13), were missing tobacco use information (197), were some day users (1134) or experimental users (731). Daily tobacco users were defined as established (ie, not experimental) everyday users of at least one tobacco product. They were further divided into tobacco product groups which included polyusers and exclusive users of cigarette, smokeless tobacco (including snus pouches and dissolvables), electronic cigarette (e-cigarette), cigar (including traditional cigar, filtered cigar, and cigarillo), pipe, and hookah. Nonusers consisted of recent former users and never users. Tobacco user groups and their definitions are given in Supplementary Table S1.
Statistical Analysis
All data used in this analysis are from the PATH Study W1 Restricted Use Files and the Biomarker Restricted Use Files. All statistical analyses were conducted using the PATH Study W1 biomarker sample weights as described in the Biomarker Restricted Use Files User Guide (http://doi.org/10.3886/ICPSR36231). Data analyses were performed using SAS version 9.4 (SAS Institute Inc., Cary, NC) and SUDAAN version 11.0.0 (Research Triangle Institute, Research Triangle Park, NC). All values below the LOD were replaced with LOD/√2. The distribution of biomarker concentrations exhibited substantial right skew, so the original measurements were transformed with the natural log for compatibility with normal distribution assumptions in statistical analysis. Sample-weighted variances for reported statistics were estimated with balanced repeated replicate weights obtained using Fay’s method with 0.3 as the adjustment factor.25 Multiple linear regression models were estimated with the natural log of the serum concentration of COT, HCT, and COT + HCT, as well as NMR as dependent variables, and sex, age, race/ethnicity, education, tobacco user group, past-smoking status, and SHS exposure as predictors. Pairwise comparisons of least squares means (LSMs) for all predictors were performed with p-values adjusted by Bonferroni’s method. Statistical significance was set at α ≤ .05. All estimates were sample-weighted and are thereby representative of the current, recent former (within 12 months), and never users of tobacco products in the US civilian, noninstitutionalized adult population at the time of W1 (2013–2014). Estimates were flagged as statistically unreliable if they met any of the following conditions: unweighted sample size < 50, relative standard error > 30, or proportion of biomarker results below the LOD > 40%.
Results
Study Population Characteristics
Characteristics of the PATH Study W1 population by tobacco user groups are presented in Table 1. Daily polyuser was the largest tobacco user group followed by daily exclusive user of cigarettes, smokeless tobacco, e-cigarette, cigar, pipe, and hookah (Table 1). Polyusers, smokeless users, and cigar users were mostly male while cigarette users, e-cigarette users, and nonusers were mostly female. NHW was the largest race/ethnicity group in all user categories except for cigar user where NHB was the largest group.
Characteristics of the PATH Study Population by Tobacco User Groups, Unweighted Sample Size (Sample-Weighted Percentage)
| Daily tobacco users | Nonusers | ||||||||||
|---|---|---|---|---|---|---|---|---|---|---|---|
| All users | Polyusers | Exclusive cigarette | Exclusive smokeless | Exclusive e-cigarette | Exclusive cigarette | Exclusive pipe | Exclusive hookah | All nonusers | Former | Never | |
| All adults | 3741 (100) | 1978 (100) | 1380 (100) | 232 (100) | 104 (100) | 39a (100) | 5a (100) | 3a (100) | 1271 (100) | 359 (100) | 912 (100) |
| Sex | |||||||||||
| Female | 1678 (42.1) | 796 (34.8) | 790 (52.7) | 13a (3.4) | 69 (58.6) | 9a (14.0) | b | b | 804 (61.8) | 205 (54.0) | 599 (62.9) |
| Male | 2063 (57.9) | 1182 (65.2) | 590 (47.3) | 219 (96.6) | 35a (41.4) | 30a (86.0) | b | b | 467 (38.2) | 154 (46.0) | 313 (37.1) |
| Age, years | |||||||||||
| 18–24 | 807 (13.5) | 589 (21.2) | 177 (7.8) | 21a (5.5) | 10a (5.7) | 8a (11.3) | b | b | 489 (16.9) | 141 (23.2) | 348 (16.0) |
| 25–34 | 822 (23.9) | 463 (26.9) | 286 (21.7) | 38a (17.6) | 30a (34.6) | 4a (14.9) | b | b | 224 (18.9) | 94 (26.5) | 130 (17.8) |
| 35–44 | 672 (20.2) | 339 (20.1) | 253 (20.1) | 47a (20.9) | 22a (22.9) | 11a (29.5) | b | b | 151 (15.3) | 49a (16.0) | 102 (15.2) |
| 45–54 | 738 (20.2) | 303 (15.7) | 336 (23.2) | 73 (31.0) | 20a (17.5) | 6a (20.1) | b | b | 152 (17.1) | 29a (11.0) | 123 (18.0) |
| 55+ | 702 (22.1) | 284 (16.0) | 328 (27.3) | 53 (25.0) | 22a (19.3) | 10a (24.2) | b | b | 255 (31.8) | 46a (23.3) | 209 (33.1) |
| Race/ethnicity | |||||||||||
| Hispanic | 348 (8.1) | 200 (8.4) | 138 (8.7) | 5a (2.2) | 4a (4.1) | b | b | b | 291 (19.7) | 68 (14.4) | 223 (20.5) |
| Non-Hispanic Black | 474 (14.0) | 256 (16.6) | 178 (12.4) | 13a (4.7) | 6a (6.3) | 21a (49.8) | b | b | 175 (11.1) | 49a (12.8) | 126 (10.9) |
| Non-Hispanic White | 2646 (73.6) | 1351 (69.6) | 984 (75.3) | 196 (88.9) | 91 (87.3) | b | b | b | 695 (61.2) | 206 (63.3) | 489 (60.9) |
| Other/multiracial | 273 (4.3) | 171 (5.4) | 80 (3.5) | 18a (4.3) | 3a (2.3) | b | b | b | 110 (8.0) | 36a (9.4) | 74 (7.7) |
| Education | |||||||||||
| Less than High School | 1126 (27.9) | 595 (28.1) | 436 (28.4) | 65 (26.4) | 15a (14.7) | 13a (26.4) | b | b | 225 (15.9) | 64 (16.3) | 161 (15.8) |
| High school graduate | 934 (28.4) | 467 (23.7) | 367 (32.4) | 63 (30.7) | 24a (28.1) | 12a (28.8) | b | b | 301 (26.0) | 80 (27.2) | 221 (25.8) |
| Some college | 1380 (35.2) | 770 (39.5) | 474 (31.7) | 74 (29.3) | 48a (41.4) | 11a (33.5) | b | b | 466 (28.1) | 164 (35.7) | 302 (27.0) |
| Bachelor’s degree + | 301 (8.6) | 146 (8.7) | 103 (7.4) | 30a (13.3) | 17a (15.7) | 3a (11.3) | b | b | 279 (30.0) | 51 (20.9) | 228 (31.4) |
aDoes not meet the statistical reliability criterion of unweighted sample size ≥ 50.
bSuppressed due to low numbers and confidentiality concerns.
Serum Nicotine Biomarker Levels in Tobacco Users
Nicotine Biomarkers in Daily Tobacco Users by Demographics
The geometric mean (GM) and 95% confidence interval (CI) of serum concentrations of COT, HCT, and COT + HCT for daily tobacco users overall and by selected demographics are presented in Table 2. For all daily tobacco users, the GMs (95% CI) of COT, HCT, and COT + HCT concentrations were 196 (184 to 208) ng/mL, 72.5 (67.8 to 77.4) ng/mL, and 1.54 (1.45 to 1.63) nmol/mL, respectively (Table 2). Biomarker levels varied by demographic characteristics; the youngest age group (18–24 years), Hispanics, and college graduates had the lowest biomarker concentrations in their respective categories. Males had higher COT and COT + HCT levels than females; however, females had higher HCT concentrations than males. NHWs had higher levels of all three biomarkers than NHBs (Table 2).
Sample-Weighted Nicotine Biomarker Geometric Mean Concentration (95% CI) in Daily Tobacco Users by Demographic Groups
| N | Cotinine, ng/mL | HCT, ng/mL | Cotinine + HCTa, nmol/mL | |
|---|---|---|---|---|
| All adults | 3741 | 196 (184, 208) | 72.5 (67.8, 77.4) | 1.54 (1.45, 1.63) |
| Sex | ||||
| Female | 1678 | 183 (169, 198) | 75.9 (69.5, 82.8) | 1.49 (1.37, 1.61) |
| Male | 2,063 | 205 (190, 223) | 70.1 (64.1, 76.6) | 1.58 (1.46, 1.71) |
| Age, years | ||||
| 18–24 | 807 | 130 (115, 147) | 38.7 (34.1, 44.0) | 0.97 (0.86, 1.09) |
| 25–34 | 822 | 188 (174, 203) | 61.5 (55.5, 68.1) | 1.42 (1.32, 1.54) |
| 35–44 | 672 | 207 (182, 235) | 77.2 (66.7, 89.3) | 1.62 (1.43, 1.84) |
| 45-54 | 738 | 243 (219, 270) | 95.3 (85.5, 106.0) | 1.94 (1.76, 2.14) |
| 55+ | 702 | 205 (175, 240) | 93.3 (78.7, 111.0) | 1.72 (1.47, 2.00) |
| Race/ethnicity | ||||
| Hispanic | 348 | 102 (78, 133) | 35.4 (26.7, 47.0) | 0.79 (0.60, 1.03) |
| Non-Hispanic Black | 474 | 198 (163, 241) | 58.8 (45.9, 75.4) | 1.48 (1.21, 1.81) |
| Non-Hispanic White | 2,646 | 214 (204, 225) | 84.7 (80.2, 89.4) | 1.71 (1.63, 1.79) |
| Other/multiracial | 273 | 136 (90, 204) | 38.0 (23.8, 60.7) | 1.03 (0.69, 1.55) |
| Education | ||||
| Less than high school | 1,126 | 202 (181, 225) | 75.1 (66.7, 84.6) | 1.58 (1.42, 1.77) |
| High school graduate | 934 | 202 (186, 220) | 73.1 (66.3, 80.7) | 1.58 (1.46, 1.72) |
| Some college | 1,380 | 191 (172, 212) | 72.0 (63.8, 81.2) | 1.51 (1.35, 1.68) |
| Bachelor’s degree + | 301 | 175 (145, 212) | 64.1 (50.8, 80.8) | 1.40 (1.16, 1.68) |
CI = confidence interval; HCT = trans-3′-hydroxycotinine.
aMolar sum of cotinine and HCT.
After adjusting for sex, age, race/ethnicity, education, and tobacco user group, the youngest age group had significantly lower LSM concentrations of all three nicotine biomarkers than the older age groups (p-value < .0001 for all comparisons). Hispanics had significantly lower LSM concentrations of all three nicotine biomarkers than NHWs (p-value <.0001), significantly lower LSM concentrations of COT (p-value = .0013) and COT + HCT (p-value = .0037) than NHBs, and lower, but not significantly lower, LSM concentrations of HCT (p-value = .0915) than NHBs. NHBs had significantly lower LSM concentrations of HCT than NHWs (p-value = .0095). Selected population percentiles of COT and HCT in daily users are presented in Supplementary Tables S2 and S3.
COT in Daily Tobacco Users by Tobacco User Group
The GM and 95% CI of COT concentrations for selected daily tobacco user groups are presented in Figure 1. Exclusive smokeless tobacco users had the highest GM COT concentrations (347 [95% CI: 303 to 397] ng/mL) of all user groups examined. Exclusive cigarette, pipe users, and polyusers had lower COT GM concentrations (198 [95% CI: 181 to 218], 194 [95% CI: 103 to 368], and 188 [95% CI: 176 to 202] ng/mL, respectively). Exclusive e-cigarette and cigar users had even lower COT GM concentrations (102 [95% CI: 70 to 149] and 101 [95% CI: 72 to 142] ng/mL, respectively), and exclusive hookah users had the lowest COT GM concentrations (78 [95% CI: 43 to 142] ng/mL).
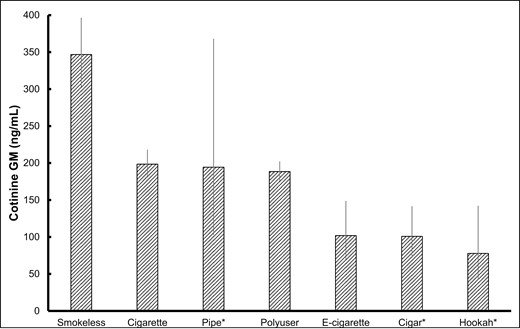
Sample-weighted serum cotinine geometric mean concentrations (95% CI) in daily tobacco users by tobacco user group.
CI = confidence interval, GM = geometric mean, bars indicate 95% CI.
*Estimate does not meet the statistical reliability criterion of unweighted sample size ≥ 50.
After adjusting for sex, age, race/ethnicity, education, and tobacco user group, smokeless users had significantly higher LSM concentrations of COT than all other groups except for pipe users (all p-value ≤ .0032). Exclusive cigarette users and polyusers had significantly higher LSM concentrations of COT than exclusive users of cigar and e-cigarette (all p-value < .01). Note that estimates for cigar, pipe, and hookah users are flagged for not meeting statistical reliability criteria.
COT in Daily Tobacco Users by Race/Ethnicity and Tobacco User Group
The GM and 95% CI of serum COT concentrations in daily users by race/ethnicity and selected tobacco user groups are presented in Supplementary Figure S1. For all tobacco user groups except for cigarette users, COT levels were highest in NHWs, followed by NHBs and then Hispanics. In cigarette users, COT levels were highest in NHBs (261 [95% CI: 226 to 301] ng/mL), followed by NHWs (210 [95% CI: 193 to 229] ng/mL), and then Hispanics (100 [95% CI: 63 to 159] ng/mL).
We performed pairwise comparisons of LSM concentrations of COT by race/ethnicity and tobacco user group. Within each tobacco user group, we adjusted for sex, age, race/ethnicity, and education. Among cigarette users, Hispanics had significantly lower LSM concentrations of COT than NHBs (p-value = .0008) and NHWs (p-value = .0098), and among polyusers, Hispanics had significantly lower COT levels than NHWs (p-value < .0001). No other pairwise comparisons were statistically significant.
NMR in Daily Tobacco Users by Sex, Age, and Race/Ethnicity
The GM and 95% CI of the serum NMR in daily tobacco users by sex, age, and race/ethnicity are presented in Figure 2. Overall, the NMR GM (95% CI) in daily users was 0.339 (0.330 to 0.350). Among Hispanics and NHBs, females and males had similar NMR GMs (0.320 [95% CI: 0.284 to 0.360] vs. 0.320 [95% CI: 0.286 to 0.358], respectively for Hispanics and 0.263 [95% CI: 0.230 to 0.302] vs. 0.276 [95% CI: 0.239, 0.319], respectively for NHBs); however, among NHWs, females had higher NMR GMs than males (0.411 [95% CI: 0.392 to 0.431] vs. 0.328 [95% CI: 0.315 to 0.341]).
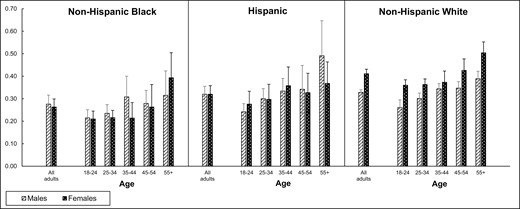
Sample-weighted serum NMR geometric means (95% CI) in daily tobacco users by race/ethnicity, age, and sex.
NMR = nicotine metabolite ratio = (trans-3'-hydroxycotinine molar concentration/cotinine molar concentration); CI = confidence interval; GM = geometric mean, bars indicate 95% CI.
Estimates for non-Hispanic black males ≥ 55 years, Hispanic male age groups ≥ 35 years, and all non-Hispanic black and Hispanic female age groups do not meet the statistical reliability criterion of sample size ≥ 50
After adjusting for sex, age, race/ethnicity, education, and the interaction of sex and race/ethnicity (sex × race/ethnicity), NHW females had significantly higher LSM NMR levels than all other sex × race/ethnicity groups (all p-value < .05) and NHB females had significantly lower LSM NMR levels than NHW males (p-value = .0169). No other pairwise sex × race/ethnicity comparisons were statistically significant. Overall, the LSM NMR levels were positively correlated with age (p-value < .0001).
Serum Nicotine Biomarker Levels in Nonusers
Nicotine Biomarkers in Nonusers by Demographics
The GM and 95% CI of serum concentrations of COT, HCT, and COT + HCT in nonusers overall and by sex, age, race/ethnicity, and educational attainment are presented in Supplementary Table S4. For all nonusers the GMs (95% CI) of COT, HCT, and COT + HCT were 0.033 (0.028 to 0.037) ng/mL, 0.021 (0.018 to 0.023) ng/mL, and 0.303 (0.268 to 0.343) pmol/mL, respectively. Biomarker levels varied by demographic characteristics; males, the youngest age group, NHBs, and those with less than a high school diploma had the highest biomarker concentrations in their respective categories (Supplementary Table S4). Note that most estimates for nonuser biomarker concentrations are flagged for not meeting statistical reliability criteria.
After adjusting for sex, age, race/ethnicity, education, and past-smoking status (recent former users and never users), males had higher LSM nicotine biomarker levels than females, but only COT and COT + HCT levels were significantly higher (p-value = .0129 and p-value = .0285, respectively). NHBs had significantly higher LSM nicotine biomarker levels than Hispanics (p-value < .05 for all biomarkers) and significantly higher levels of COT (p-value = .008) and COT + HCT (p-value = .0214) and higher, but not significantly higher, levels of HCT than NHWs. College graduates had significantly lower LSM biomarker levels than those who did not graduate from college (p-value < .05 for all comparisons). Selected population percentiles of COT and HCT in nonusers are presented in Supplementary Tables S5 and S6.
COT in Nonusers by Past-Smoking Status and SHS Exposure
The GM and 95% CI of serum COT concentrations in nonusers by past-smoking status and by SHS exposure are presented in Supplementary Figure S2. Nonusers were considered exposed to SHS if they were exposed to smoke at work in the past week or living with someone who smoked cigarettes or cigars. Former users had higher COT GM concentrations than never users (0.090 [95% CI: 0.063 to 0129] vs. 0.028 [95% CI: 0.024 to 0.032] ng/mL). Among both former users and never users, nonusers with SHS exposure had higher COT GM concentrations than those with no SHS exposure (0.173 [95% CI: 0.099 to 0.305] vs. 0.058 [95% CI: 0.037 to 0.089] ng/mL for former users with and without SHS, and 0.063 [95% CI: 0.042 to 0.093] vs. 0.021 [95% CI: 0.018 to 0.024] ng/mL for never users with and without SHS).
After adjusting for sex, age, race/ethnicity, education, past-smoking status, and SHS exposure, we found all COT LSM levels were significantly different from one another (p-value < .05) except COT levels of former users without SHS and never users with SHS were not statistically different.
Discussion
This report summarizes the serum nicotine biomarker measurements in W1 of the PATH Study. We are reporting the first serum HCT, and COT + HCT estimates for daily tobacco users and nonusers in the noninstitutionalized, civilian US adult population; the first nationally representative estimate of the serum NMR in daily tobacco users by age, race/ethnicity, and sex; and the first nationally representative serum COT estimates for daily exclusive users of different tobacco products and daily polyusers. In our adjusted models among daily users of tobacco, we found serum concentrations of COT, HCT, and COT + HCT varied by some demographic characteristics in ways similar to previous reports of COT levels in cigarette smokers: significantly lower in the youngest compared to older age groups and significantly lower in Hispanics compared to NHWs.26,27 We did not find significant differences in COT concentrations between NHWs and NHBs in our adjusted models.
Our finding that NHWs had higher unadjusted COT GM levels than NHBs among all daily tobacco users is in contrast to most reports of COT levels in cigarette smokers where the reverse has been reported.11,26,27 However, when we examined COT levels by race/ethnicity within tobacco product groups, we found NHWs had lower COT levels than NHBs among daily exclusive cigarette users. For all other tobacco groups examined, NHWs had higher COT levels than NHBs. It is not clear why this is so, as a recent report has shown that higher levels of COT in NHBs can be explained by the prevalence of reduced or null COT glucuronidation in NHBs.28 Analyses using other covariates, including amount of tobacco product used and type of product used among polyusers may help explain this.
A major strength of the PATH Study is the ability to compare nicotine biomarker levels among users of different tobacco products. Consistent with what other studies have shown, we found that daily exclusive users of smokeless tobacco had significantly higher COT levels than daily exclusive cigarette users,29,30 and daily exclusive cigar users had significantly lower COT levels than daily exclusive cigarette users.31 Unadjusted PATH Study serum COT GM concentrations for US adult daily exclusive cigarette users overall and for NHBs, NHWs, and Hispanics are similar to estimates reported by Jarvis et al. from the 2011–2012 NHANES for NHB, NHW, and Mexican American cigarette users.32 Our data showed daily tobacco polyusers and daily exclusive cigarette users had similar COT levels. The most likely reason for this is because nearly all daily tobacco polyusers used cigarettes (>94%, data not shown).
The current report is one of the first US population-based reports of serum COT levels in daily exclusive e-cigarette users. We found that daily exclusive e-cigarette users had significantly lower COT GMs than daily exclusive cigarette users which is consistent with what Goniwiecz et al. found for total urinary COT in the PATH Study W1 cohort.33 Park et al. also found exclusive e-cigarette users had lower urinary COT levels than exclusive cigarette smokers, however, they did not restrict their comparison to daily users and the sample size for e-cigarette users was small (N = 44) compared to conventional cigarette users (N = 2627).34 Other researchers have found COT concentrations in exclusive e-cigarette users not significantly different from COT concentrations in exclusive cigarette smokers.35–39 It is worth noting that these other studies are based on sample sizes much smaller than the PATH Study (from 20 to 49 e-cigarette users), and only one (Rapp et al.) is representative of a general population. Rapp et al. used serum COT data from NHANES 2015–2016 and found no statistical difference in COT concentrations between daily e-cigarette users (GM = 259.78 [95% CI: 202.38 to 317.18] ng/mL; N = 26) compared to daily combustible cigarette smokers (GM = 242.57 [95% CI: 217.88 to 267.26] ng/mL; N = 277) among US adults.39 One reason Rapp et al. found higher levels of serum COT in e-cigarette users than the present study may be due to the use of e-cigarettes containing nicotine salts, which were introduced in 2015 and have been shown to deliver higher levels of nicotine than earlier e-cigarettes. PATH Study W1 data were collected in 2013–2014, prior to the introduction of nicotine-salt e-cigarettes that have been shown to deliver higher levels of nicotine. Research using tobacco product type and amount may shed light on these differences.
Nationally representative values for the NMR in daily tobacco users overall and by age, sex, and race/ethnicity are reported here for the first time. In agreement with other researchers, we found that NMR was positively correlated with age.40,41 Our adjusted NMR LSM models revealed NHW females had significantly higher NMR levels than all other sex × race/ethnicity groups examined. The only other significantly different sex × race/ethnicity comparison was between NHB females and NHW males with NMR levels lower in NHB females. Many researchers have reported significantly higher NMR levels in females than in males16,42–44 attributing this to estrogen induction of CYP2A6.16 Yet some studies have reported no sex difference in NMR levels.45,46 Several studies have reported higher NMR levels in NHWs compared to NHBs,42,43,45,46 which has been attributed to ethnic differences in nicotine metabolism.47 The current analysis is the first to analyze NMR by sex and race/ethnicity using a nationally representative cohort of tobacco product users. Further research needs to be done to see how these results are modified by variables that have been shown to affect NMR that we did not consider such as body mass index, use of mentholated tobacco products, and alcohol use among others.
In our adjusted models among nonusers, we found COT concentrations followed the same demographic trends observed for COT levels among nonsmokers in NHANES where males have higher levels than females, and NHBs have higher levels than NHWs and Hispanics.48 We also found nonusers who had attained a college degree had significantly lower COT levels than those who did not.
The major strength of this report is the analysis of nicotine biomarker data in a large sample of nationally representative users of different tobacco products; we are not aware of any other study that focuses on this topic. One of the limitations of this analysis is the small sample size for some product and demographic categories: daily exclusive users of pipe, hookah, and cigar, and NHB and Hispanic female daily users of all ages. In addition, for many nonuser categories, greater than 40% of biomarker results were below the LOD which makes the GMs we calculated less reliable. Another limitation is the reliance on self-reported data to classify tobacco users and nonusers into tobacco user groups which could be subject to recall bias. Finally, it was beyond the scope of this report to analyze nicotine biomarker levels using tobacco product quantity, but these types of analyses may help elucidate the underlying reasons for some of the differences we found. In conclusion, the nicotine biomarker results in this report will serve as reference ranges for adult U.S. daily tobacco users and nonusers, and they can be used to compare with future PATH Study waves.
Supplementary Material
A Contributorship Form detailing each author’s specific involvement with this content, as well as any supplementary data, are available online at https://academic.oup.com/ntr.
Acknowledgments
The findings and conclusions in this report are those of the authors and do not necessarily represent the official position of the U.S. Department of Health and Human Services or any of its affiliated institutions or agencies. This article was prepared while J. Ricky Akins, Ronald E. Hunter, and Yao Li, were employed at the Centers for Disease Control and Prevention; B. Rey deCastro was employed at the National Center for Environmental Health; Charles Lawrence was employed at Westat; and Kevin P. Conway was employed at the National Institute on Drug Abuse.
Funding
This work was supported by the National Institute on Drug Abuse at the National Institutes of Health and the Center for Tobacco Products at the U.S. Food and Drug Administration (FDA), under a contract to Westat (Contract No. HHSN271201100027C and HHSN271201600001C) and through an interagency agreement between the FDA Center for Tobacco Products and the CDC.
Declaration of Interests
MLG has received a research grant from Pfizer and served on a scientific advisory board to Johnson & Johnson, pharmaceutical companies that manufacture smoking cessation medications. No other authors report potential conflicts of interest.

Comments