


Abstract
More than 300 million people worldwide have been diagnosed with depression, which is a leading cause of disability and disease burden. Elucidating dietary patterns that may reduce the risk of depression could help reduce the incidence of other diseases.
PubMed/MEDLINE, ISI Web of Science, Scopus, Embase, and Google Scholar databases were searched to identify relevant publications up to May 2018.
All observational studies that considered the Mediterranean diet as the exposure variable and depression as the main outcome or as one of the outcome variables were included in this systematic review and meta-analysis. Two authors independently screened 3229 publications. A total of 14 observational studies were included in the meta-analysis.
Two authors independently extracted the data and assessed the risk of bias.
The studies in the meta-analysis included a total of 56 043 participants. When 5 effect sizes from 4 cohort studies were combined, no significant association was observed between adherence to the Mediterranean diet and risk of depression (overall hazard ratio = 0.95; 95%CI, 0.79–1.16). When 3 effect sizes from 3 cohort studies that reported β coefficients were combined, again no significant association was found (β = −0.00; 95%CI, −0.12, 0.12). However, when 9 effect sizes from 9 cross-sectional studies were combined, an inverse significant association was found between adherence to the Mediterranean diet and risk of depression (overall odds ratio = 0.72; 95%CI, 0.60–0.87).
The analysis of cohort studies revealed no significant association between adherence to the Mediterranean diet and risk of depression. However, an inverse significant association was found between adherence to the Mediterranean diet and odds of depression in cross-sectional studies.
INTRODUCTION
Depression is highly prevalent in people of all age groups worldwide and is particularly prevalent in women. More than 300 million individuals across the globe have been diagnosed with depression.1,2 National reports indicate that 21% of Iranian adults experience depressive symptoms.3 The World Health Organization has reported that depression is the primary reason for disability and one of the leading causes of disease burden.2 Therefore, investigation of the potential risk factors of depression, as well as preventive strategies, is especially important.
The etiology of depression involves genetic, biological, and environmental factors.4,5 Several epidemiological studies have examined the relationship between nutritional factors and depression.6 Previous studies have investigated the association of depression with single nutrients like B vitamins and omega-3 fatty acids,5 foods such as fish,7 food groups like fruits and vegetables,8 and dietary patterns such as DASH (Dietary Approaches to Stop Hypertension) and the Mediterranean diet.9,10 Diet is a multidimensional exposure that includes combinations and interactions between dietary components11; therefore, it seems that studying dietary patterns is a more comprehensive and useful approach for finding diet–disease relationships.
The Mediterranean diet is a healthy diet in which consumption of vegetables and fruits, nuts and seeds, whole grains, dairy products, olive oil, fish, and fresh seafood is encouraged, while consumption of red and processed meats is restricted.12 This dietary pattern has been extensively examined relative to several health conditions. Some investigators have also reported an association between this eating pattern and depression, but such findings are contradictory. In a French cohort, an inverse relationship was seen between adherence to the Mediterranean diet in midlife and risk of incident depressive symptoms.13 A cross-sectional study showed an inverse association between the Mediterranean diet and depression in patients with bronchiectasis.14 The results of some studies failed to reach significance. In a longitudinal study, there was no advantage for depression when participants with a low degree of adherence to the Mediterranean diet were compared with those with a high degree of adherence.15 The same findings were also reported by other investigators.16
A meta-analysis published in 2013 reported that moderate and high adherence to the Mediterranean diet was associated with a reduced risk of depression.10 The authors included only 1 cohort study, and most of the included studies were of cross-sectional design. Since then, however, 6 other cohort studies have been published. Therefore, it seems appropriate to conduct an updated meta-analysis to summarize earlier evidence on the link between adherence to the Mediterranean diet and the risk of depression.
METHODS
Search strategy
The following databases were searched systematically up to May 2018 to find previously published studies on the topic of the Mediterranean diet and depression: PubMed/MEDLINE, ISI Web of Science, Scopus, Embase, and Google Scholar. The keywords (“Mediterranean diet” OR “Mediterranean” OR “MD score” OR “dietary pattern” OR “Mediterranean diet score” OR “dietary score” OR “dietary adherence”) AND (“depression” OR “depressive symptom” OR “major depressive disorder” OR “major depression” OR “mood disorder”) were used. No time or language limitation was applied. The reference lists of included studies were also checked to avoid missing any relevant publications.
Inclusion criteria
Two authors (F.S. and A.S.M.) screened the output of the search independently to identify potentially eligible studies. Titles and abstracts of articles were reviewed to decide which articles were relevant. Full texts of articles were reviewed if the abstract indicated that the articles reported an association between the Mediterranean diet and depression. Studies were eligible for inclusion in the current review if they met the following criteria: (1) they were observational studies that considered the Mediterranean diet as the exposure variable and depression as the main outcome variable or as one of the outcome variables; (2) participants included were 18 years and older; (3) odds ratios, hazard ratios, or β estimates were reported as effect sizes (Table 1).
PICOS criteria for inclusion of studies
| Population | Adults |
| Intervention | Mediterranean diet |
| Comparator | Highest vs lowest category of adherence to the Mediterranean diet |
| Outcome | Depression |
| Setting | Cohort and cross-sectional studies |
| Population | Adults |
| Intervention | Mediterranean diet |
| Comparator | Highest vs lowest category of adherence to the Mediterranean diet |
| Outcome | Depression |
| Setting | Cohort and cross-sectional studies |
Exclusion criteria
Letters, commentaries, reviews, clinical trials, and animal studies were excluded from the current review. Unpublished studies or gray literature were also excluded from the analysis. In total, 3229 articles were found in the initial search. After elimination of duplicates, 2029 articles remained. After title and abstract screening, another 2000 studies were excluded, leaving 29 potentially relevant articles for further assessment. Ten of these were excluded for the following reasons: 1 did not report the required effect sizes,17 1 had considered mental health totally, rather than depression, as the outcome,18 1 had included depressed individuals only,19 1 had examined components of the Mediterranean diet rather than the whole diet as the exposure,20 and 1 had investigated the association between a statistically derived dietary pattern and psychological factors.21 Two studies had considered the same population22,23; of these, the 1 that reported more comperehensive data was included.23 Five other studies had also investigated the same population16,24–27; of these, the most comperehensive study was included.16 After these exclusions, 19 studies remained for the current systematic review.13–16,23,28–41 Two studies that had reported the mean ± the standard deviation of the depression score across categories of adherence to the Mediterranean diet30,31 and 3 studies that had reported risk of depression per 1 unit of the Mediterranean diet score14,34,37 were not included in the meta-analysis. Therefore, 14 studies (of the 19 studies included in the systematic review) were included in the meta-analysis (Figure 1). Two studies had reported data for cross-sectional and longitudinal phases16,37; therefore, these were included in the separate meta-analyses of cross-sectional studies and of cohort studies. Data for 7 studies28,29,32,33,35,36,39 were derived from the previous meta-analysis,10 because data were not reported in the original papers and the authors of the previous meta-analysis had contacted investigators to obtain the data.
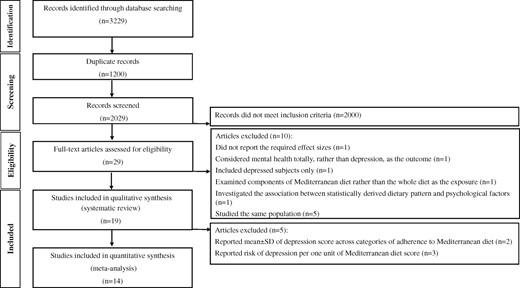
Flow diagram of the literature search process.
Data extraction
Two authors independently extracted the following data: first author’s last name; publication date; country; mean age or age range of participants; sex of participants; sample size or duration of follow-up and number of cases/cohort size; exposure; outcomes assessed; methods used for assessing exposure and outcome; comparison; reported β estimates, means ± standard deviations, and odds ratios or hazard ratios, along with the corresponding 95%CIs (Table 213,15,16,37,38,40,41 and Table 314,16,23,28–37,39).
Characteristics of cohort studies examining the association between Mediterranean diet and depression
| Reference | Country or region | Age (mean or range) | Sex | Duration of follow-up | No. of cases/cohort size | No. of MD components | Method of exposure assessment | Outcome | Method of outcome assessment | Comparison | Findings | Adjustmentsa |
|---|---|---|---|---|---|---|---|---|---|---|---|---|
| Adjibade et al (2017)13 | France | 49.5 y | M/F | 12.6 y | 172/3523 | 9 | 24-h dietary records | Depression | CES-D | T3 vs T1 | OR, M: 0.63 (0.32–1.25) | 1, 2, 3, 4, 5, 6, 7, 8, 9, 10, 11, 12, 13 |
| OR, F: 1.05 (0.62–1.75) | ||||||||||||
| Veronese et alb (2016)40 | United States | 61.3 y | M/F | NR | NR/4470 | 11 | MDS | Depression | CES-D | Q5 vs Q1 | OR: 1.22 (0.96–1.55) | 1, 2, 4, 10, 12, 14, 15, 16, 17, 18 |
| β: −0.05 (−0.09, −0.01) | ||||||||||||
| Lai et al (2016)15 | Australia | 45–50 y | F | 12 y | NR/9280 | 9 | DQES v2 | Depression | CES-D | Q5 vs Q1 | β: −0.48 (−0.74, −0.21) | 4, 5, 10, 11, 19, 20, 21 |
| Sanchez-Villegas et al (2015)16 | Spain | NR | M/F | 8.5 y | NR/15093 | 9 | FFQ | Depression | Physician diagnosis and/or use of antidepressant drugs | 6–9 vs 0–2 | OR: 0.84 (0.69–1.02) | 1, 2, 10, 11, 12, 18, 22, 23, 24, 25, 26 |
| Hodge et al (2013)41 | Australia | 50–69 y | M/F | 12 y | 731/8660 | 9 | FFQ | Depression | K10 | Q5 vs Q1 | OR: 0.92 (0.69–1.24) | 1, 2, 4, 10, 11, 18, 25, 27, 28, 29, 30, 31, 32, 33, 34, 35, 36 |
| Rienks et al (2013)37 | Australia | 50–55 y | F | 3 y | 660/6060 | 11 | FFQ | Depression | CES-D | Per unit of factor score | OR: 0.83 (0.75–0.91) | 4, 5, 10, 11, 12, 18, 37, 38, 39 |
| Skarupski et al (2013)38 | United States | 73.5 y | M/F | 7.2 y | 987/3502 | 11 | FFQ | Depression | CES-D | T3 vs T1 | β: −0.002 | 1, 2, 4, 12, 14, 18, 20, 40, 41, 42, 43, 44 |
| SE: 0.001 |
Abbreviations: CES-D, Center for Epidemiologic Studies Depression Scale; DQES v2, Dietary Questionnaire for Epidemiological Studies version 2; F, female; FFQ, food frequency questionnaire; K10, Kessler Psychological Distress Scale; M, male; MD, Mediterranean diet; MDS, Mediterranean Diet Score; NR, not reported; OR, odds ratio; Q, quartile; SE, standard error; T, tertile.
1, age; 2, sex; 3, supplementation group during the trial phase; 4, educational level; 5, marital status; 6, socioprofessional status; 7, energy intake without alcohol; 8, number of 24-hour dietary records; 9, interval between the 2 CES-D measurements; 10, tobacco use; 11, physical activity; 12, body mass index; 13, first CES-D measurement; 14, race; 15, annual income; 16, Charlson comorbidity index; 17, use of analgesic drugs; 18, total energy intake; 19, area of residence; 20, average household income; 21, self-reported physician diagnosis of depression and use of antidepressant drugs; 22, use of vitamin supplement(s); 23, presence of cardiovascular disease at baseline; 24, presence of type 2 diabetes at baseline; 25, presence of hypertension at baseline; 26, presence of dyslipidemia at baseline; 27, age at follow-up; 28, asthma; 29, arthritis; 30, gallstones; 31, kidney stones; 32, quintile of Socio-Economic Indexes for Areas (SEIFA); 33, number of relatives visited at least once a month; 34, number of friends the participant could visit without invitation; 35, number of people in household; 36, social activity; 37, ability to manage on available income; 38, occupation; 39, mean stress score; 40, widowhood; 41, Mediterranean diet score; 42, time lag; 43, interaction of each variable with time lag; 44, global cognitive function and its interaction with time lag.
Mediterranean diet was categorized on the basis of the 4th and 5th quintiles (higher adherence = reference) compared with the other 3 quintiles.
Quality assessment
The quality of studies included in this systematic review and meta-analysis was assessed by the Newcastle-Ottawa Scale.42 With this method, a maximum of 9 scores can be awarded to each cohort study: 4 for selection, 2 for comparability, and 3 for outcome. A maximum of 10 scores can be awarded to each cross-sectional study: 5 for selection, 2 for comparability, and 3 for outcome. In the current analysis, studies with above-median quality scores were considered high-quality studies; otherwise, studies were deemed to be of low quality.
Statistical analysis
Cohort and cross-sectional studies were analyzed separately. Different effect sizes (odds ratios or β coefficients) were also considered separately. The effect sizes used were odds ratios, hazard ratios, and β coefficient estimates and their 95%CIs or standard errors for risk of depression in the highest vs the lowest category of adherence to the Mediterranean diet. Odds ratios and hazard ratios were used to calculate log odds ratios and hazard ratios and their standard errors. β Coefficients and their confidence intervals or standard errors were used to calculate standard deviations. The overall effect sizes were calculated using the random-effects model, which incorporates between-study variability. Statistical heterogeneity between studies was examined using Cochrane’s Q test and I2. Publication bias was assessed by visual inspection of funnel plots. Formal statistical assessment of funnel plot asymmetry was performed with Egger regression asymmetry tests. Sensitivity analysis was used to explore the extent to which inferences might depend on a particular study or group of studies. Statistical analyses were conducted using Stata MP software, version 14. P values less than 0.05 were considered statistically significant.
RESULTS
Systematic review of cohort studies
Seven cohort studies, published between 2013 and 2017, were included in this systematic review13,15,16,37,38,40,41 (Table 2). These studies had included 50 588 healthy people aged greater than 45 years with 2550 incident cases of depression during the follow-up period of 3 to 12.6 years. Three studies were reported from Australia,15,37,41 2 from the United States,38,40 and 1 each from France13 and Spain.16 To assess exposure, 4 studies had used a 9-component Mediterranean dietary pattern,13,15,16,41 and 3 others had examined an 11-component Mediterranean dietary pattern.37,38,40 For outcome assessment, 5 studies had used the Center for Epidemiologic Studies Depression Scale,13,15,40 1 had used the Kessler Psychological Distress Scale,41 and 1 had used physician diagnosis and/or the use of antidepressant drugs.16 All studies were of high quality.
Systematic review of cross-sectional studies
Fourteen cross-sectional studies were included in this systematic review14,16,23,28–37,39 (Table 3). These studies were published between 2008 and 2018 and included 35 873 men and women aged more than 44.5 years. Five studies were reported from Greece,28,29,32,34,36 2 from Australia,30,37 2 from Spain,14,16 and 1 each from France,31 Italy,35 the United States,39 the United Kingdom,33 and the Mediterranean islands.23 To assess exposure, 7 studies had used a 9-component Mediterranean dietary pattern,16,30,31,33,35,36,39 6 had examined an 11-component Mediterranean dietary pattern,23,28,29,32,34,37 and 1 had used a 14-item Mediterranean diet questionnaire (to obtain the PREDIMED score).14 To assess outcomes, 4 studies had used the Center for Epidemiologic Studies Depression Scale,30,31,35,37 4 had used the Geriatric Depression Scale,23,29,34,36 2 had used the Hospital Anxiety and Depression Scale,14,33 2 had used the Zung Self-Rating Depression scale,8,32 and 1 each had used physician diagnosis and/or use of antidepressant drugs16 and interviews.39 All studies were of high quality.
Characteristics of cross-sectional studies examining the association between Mediterranean diet and depression
| Reference | Country or region | Age (mean or range) | Sex | Sample size | No. of MD components | Method of exposure assessment | Outcome | Method of outcome assessment | Comparison | Findings | Adjustmentsa |
|---|---|---|---|---|---|---|---|---|---|---|---|
| Masana et al (2018)23 | Mediterranean islands | ≥ 65 y | M/F | 2718 | 11 | FFQ | Depression | GDS | T3 vs T1 | OR: 0.98 (0.68–1.40) | 1, 2, 3, 4, 5, 6, 7, 8, 9, 10, 11, 12, 13 |
| Sanchez-Villegas et al (2015)16 | Spain | NR | M/F | 15 093 | 9 | FFQ | Depression | Physician diagnosis and/or use of antidepressant drugs | 6–9 vs 0– <3 | HR: 0.70 (0.58–0.85) | 1, 2, 6, 9, 10, 11, 12, 13, 14, 15, 16 |
| Olveira et al (2014)14 | Spain | 57.2 y | M/F | 205 | 14 self-reported | 14-item questionnaire (PREDIMED) | Depression | HADS | Per 1 unit score | OR: 0.663 (0.512–0.85) | 1, 4, 17, 18 |
| Crichton et al (2013)30 | Australia | 51 y | M/F | 1183 | 9 | FFQ | Depression | CES-D | Low (0–3) | Mean±SD: 33.4±9.7 | 1, 2, 4, 6, 9, 11, 15 |
| Medium (4–7) | Mean±SD: 32.9±9.9 | ||||||||||
| High (8–11) | Mean±SD: 32.6±9.9 | ||||||||||
| Rienks et al (2013)37 | Australia | 50–55 y | F | 7588 | 11 | FFQ | Depression | CES-D | Per unit of factor score | OR: 0.85 (0.79–0.91) | 4, 6, 9, 11, 15, 19, 20, 21, 22 |
| Luciano et al (2012)33 | United Kingdom | 69.5 y | M/F | 879 | 9 | FFQ | Depression | HADS | T3 vs T1 | OR: 0.46 (0.17–1.24) | NR |
| Antonogeorgos et al (2012)28 | Greece | 44.5 y | M/F | 853 | 11 | MDS | Depression | ZDRS | T3 vs T1 | OR: 1.37 (0.31–6.04) | 1, 2, 4, 5, 6 |
| Vercambre et al (2012)39 | United States | 72.3 y | F | 2504 | 9 | FFQ | Depression | Interview | T3 vs T1 | OR: 0.71 (0.53–0.97) | NR |
| Milaneschi et al (2011)35 | Italy | ≥ 65 y | M/F | 793 | 9 | Questionnaire | Depression | CES-D | T3 vs T1 | OR: 0.66 (0.39–1.11) | 1, 2, 6, 23, 24, 25 |
| Kastorini et al (2011)32 | Greece | 75 y | M/F | Cases: 111 Controls: 345 | 11 | FFQ | Depression | ZDRS | T3 vs T1 | OR: 0.21 (0.09–0.48) | NR |
| Chrysohoou et al (2010)29 | Greece | > 65 y | M/F | 673 (data for 269) | 11 | FFQ | Depression | GDS | T3 vs T1 | OR: 0.68 (0.15–2.98) | 1, 2 |
| Mamplekou et al (2010)34 | Greece | ≥65 y | M/F | 1190 | 11 | FFQ | Depression | GDS | Per 1 unit of MDS | OR: 1.03 (0.976–1.09) | 1, 2, 3, 4, 5, 6, 9, 10, 11, 12, 13, 26, 27, 28 |
| Feart et al (2009)31 | France | 75.9 y | M/F | 1410 | 9 | FFQ/24-h dietary recall | Depression | CES-D | Low | Mean±SD: 8.2±7.4 | NR |
| Medium | Mean±SD: 7.5±7.5 | ||||||||||
| High | Mean±SD: 7.3±6.8 | ||||||||||
| Psaltopolou et al (2008)36 | Greece | ≥60 y | M/F | 732 | 9 | FFQ | Depression | GDS | T3 vs T1 | OR: 0.84 (0.68–1.03) | 1, 2, 4, 6 |
Abbreviations: CES-D, Center for Epidemiologic Studies Depression Scale; F, female; FFQ, food frequency questionnaire; GDS, Geriatric Depression Scale; HADS, Hospital Anxiety and Depression Scale; HR, hazard ratio; M, male; MD, Mediterranean diet; NR, not reported; PREDIMED, 14-item Mediterranean diet questionnaire; OR, odds ratio; ZDRS, Zung Self-Rating Depression Scale.
1, age; 2, sex; 3, area of residence; 4, educational level; 5, financial status; 6, physical activity; 7, daily coffee drinking; 8, daily tea drinking; 9, body mass index; 10, diabetes; 11, smoking; 12, hypercholesterolemia; 13, hypertension; 14, use of vitamin supplement(s); 15, total energy intake; 16, presence of cardiovascular disease at baseline; 17, employment status; 18, Charlson comorbidity index; 19, ability to manage on available income; 20, occupation; 21, marital status; 22, mean stress score; 23, lower extremity function; 24, number of medications; 25, use of antidepressant and nonsteroidal anti-inflammatory drugs; 26, living alone; 27, alcohol use; 28, retired.
Meta-analysis of cohort studies
One study that had reported hazard ratios separately for men and women13 was considered as 2 distinct studies. When 5 effect sizes obtained from 4 studies13,16,40,41 were combined, no significant association was observed between adherence to the Mediterranean diet and risk of depression (overall hazard ratio = 0.95; 95%CI, 0.79–1.16) (Figure 213,16,40,41). No significant between-study heterogeneity was found (I2 = 45.2%, Pheterogeneity = 0.12), nor was any evidence of publication bias found (Egger test = 0.81).
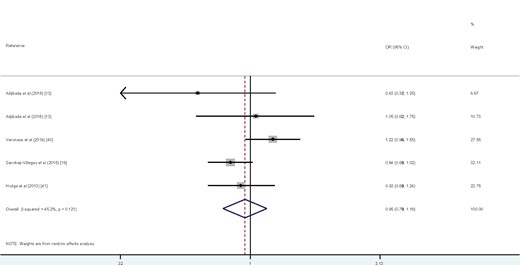
Forest plot of cohort studies that examined the association between Mediterranean diet and risk of depression.
When 3 effect sizes from 3 studies that reported β coefficients were combined,15,38,40 no significant association was observed between the Mediterranean diet score and the depression score (β=−0.02; 95%CI, −0.118-0.113), and no significant between-study heterogeneity was found (I2 = 0.0%, P = 0.99).
Meta-analysis of cross-sectional studies
Nine cross-sectional studies examined the association between adherence to the Mediterranean diet and depression.16,23,28,29,32,33,35,36,39 When 9 effect sizes from 9 studies were combined, a significant inverse association was found between adherence to the Mediterranean diet and odds of depression (overall odds ratio = 0.72; 95%CI, 0.60–0.87) (Figure 316,23,28,29,32,33,35,36,39). No significant between-study heterogeneity was observed (I2 = 45.1%, Pheterogeneity = 0.068), and no evidence of publication bias was found (Egger test = 0.39).
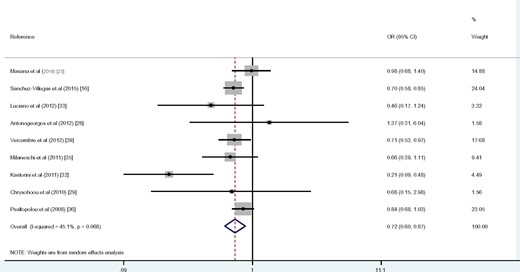
Forest plot of cross-sectional studies that examined the association between Mediterranean diet and odds of depression.
DISCUSSION
Findings from the present meta-analysis of 4 cohort studies revealed no significant association between adherence to the Mediterranean diet and risk of depression. However, meta-analysis of 9 cross-sectional studies showed that greater adherence to the Mediterranean diet was associated with 28% lower odds of depression.
Depression is the second leading cause of disability in the world and represents a significant global health and economic burden.43 Recent data have highlighted diet as a modifiable risk factor that might influence the risk of depression.11 Several studies with different designs investigated the relationship between Mediterranean diet adherence and risk of depression. In a previous meta-analysis, Molendijk et al44 investigated the relationship between diet quality and risk of depression in cohort studies. They considered the Mediterranean diet as one of several high-quality diets in their investigation. Adherence to the Mediterranean diet was associated with a lower risk of depressive symptoms over time. This was in contrast to the findings of the present meta-analysis of cohort studies, as no significant association was found between adherence to the Mediterranean diet and risk of depression. This difference in findings might be explained by the number of studies included in the analysis. Molendijk et al44 included 5 cohort studies in their meta-analysis.13,16,37,38,41 All 5 of these studies, along with 2 other cohort studies, were also included in the current meta-analysis. Therefore, the current review is more comprehensive, since the review by Molendijk et al44 does not cover all relevant published studies. In another meta-analysis, Li et al45 conducted a meta-analysis of dietary patterns (healthy patterns and Western-style or unhealthy patterns) and risk of depression. They reported a protective link between adherence to the healthy dietary pattern and risk of depression and a positive association between the Western dietary pattern and risk of depression. They did not consider the Mediterranean dietary pattern as their exposure, and they did not include publications on the Mediterranean diet in their meta-analysis.
No significant association was found between adherence to the Mediterranean diet and risk of depression in a meta-analysis of cohort studies. This is in line with the findings of a multicenter randomized trial conducted in community-dwelling people at high risk of cardiovascular disease, as no significant association between the Mediterranean dietary pattern and depression was found.46 However, these findings differed from the results of several studies that investigated the same relationship. Rienks et al37 reported that adherence to a Mediterranean-style dietary pattern may have had a protective effect against the onset of depressive symptoms in a mid-aged cohort in the Australian Longitudinal Study on Women’s Health. In addition, a cross-sectional study of 205 participants from Spain found that greater adherence to the Mediterranean diet was associated with lower odds of depression.14 However, few cohort studies have investigated this relationship, and therefore additional studies are required to reach a definitive conclusion.
A significant inverse association was observed between adherence to the Mediterranean diet and odds of depression in the meta-analysis of cross-sectional studies. This finding confirmed the results of a previous meta-analysis.10 The same finding was also reported from a cross-sectional study on mid-aged Australian women.37 In addition, Garcia-Toro et al19 demonstrated that adherence to the Mediterranean diet at the baseline of their study had a significant inverse association with depressive symptoms. Contrary to these findings, however, no significant association between the Mediterranean diet score and the presence of severe depressive symptoms was found in a cross-sectional study conducted in elderly people in Greece.34 Lack of controlling for several confounders may explain the different findings; however, it seems that higher adherence to the Mediterranean diet was associated with a lower chance of depression. Therefore, limited consumption of red and processed meats may play a role in preventing depression.
The mechanism through which the Mediterranean diet might affect the risk of depression may be mediated by components of the diet, which include fruit and vegetables, fish, whole grains, nuts, and olive oil. Another mediating factor may be the limited consumption of red and processed meat. Fruit and vegetables contain high levels of antioxidants like β-carotene, tocopherols, ascorbic acid, polyphenols, and anthocyanin, which are associated with reduced oxidative stress that may, in turn, reduce neural damage.47,48 In addition, olive oil is rich in polyphenolic compounds, which are antioxidants that have neuroprotective properties.49 Fish and nuts are good dietary sources of long-chain omega-3 polyunsaturated fatty acids, which can alter cell membrane structure and function, influence cell communications, reduce inflammatory processes, and improve neurotransmitter activities.50 B vitamins, found in whole grains, are involved in neurochemical pathways that regulate the homocysteine cycle and synthesize monoamines in the neural system.51 Deficiency of B vitamins like B12 and folic acid is related to deterioration of mental function.52 In addition, red and processed meats are linked to inflammation, shown in previous studies to be associated with depression.53,54
Although the large number of studies and participants is a strength of this review, several limitations must also be considered. First, data for some studies were derived from the previous meta-analysis. Second, some patients may have been misclassified because food frequency questionnaires were used for dietary assessment in most previous studies, and subjective cutoff points of the Mediterranean diet score were used to indicate good adherence to this diet. Third, owing to the cross-sectional nature of most studies, causal relationships cannot be inferred between the Mediterranean diet adherence and depression. Finally, confounding factors may provide another source of bias.
CONCLUSION
This systematic review and updated meta-analysis revealed no significant association between adherence to the Mediterranean diet and risk of depression when cohort studies were analyzed. However, analysis of cross-sectional studies showed an inverse significant association between adherence to the Mediterranean diet and odds of depression.
Acknowledgments
Author contributions. F.S. and A.S.M. contributed to the conception, design, search, statistical analyses, data interpretation, and manuscript drafting. A.M. and B.L. contributed to the design, data interpretation, and manuscript drafting. A.E. contributed to the conception, design, statistical analyses, data interpretation, and manuscript drafting. A.E. supervised the review. All authors approved the final manuscript for submission.
Funding/support. This study was financially supported by Tehran University of Medical Sciences, Tehran, Iran.
Declaration of interest. The authors have no relevant interests to declare.
References
World Health Organization. Depression. World Health Organization website. https://www.who.int/news-room/fact-sheets/detail/depression. Accessed April 7, 2017.
Author notes
Co-first author.
