


Abstract
The microbiological diagnosis of bone and joint infections (BJI) currently relies on cultures, and the relevance of molecular methods is still debated. The aim of this study was to determine whether polymerase chain reaction (PCR) could improve the etiological diagnosis of BJI.
A prospective study was conducted during a 4-year period at Lariboisiere University Hospital (Paris, France), including patients with suspicion of infectious spondylodiscitis, septic arthritis, prosthetic joint infections, and respective noninfected groups. Clinical and radiological data were collected at inclusion and during follow-up. All samples were analyzed by conventional cultures and 16S ribosomal deoxyribonucleic acid (rDNA) gene (16S-PCR). Specific cultures and PCR targeting Mycobacterium tuberculosis were also performed for spondylodiscitis samples. Case records were subsequently analyzed by an independent expert committee to confirm or invalidate the suspicion of infection and definitively classify the patients in a case or control group. The sensitivity of the combination of culture and PCR was compared with culture alone.
After expert committee analysis, 105 cases of BJI cases and 111 control patients were analyzed. The most common pathogens of BJI were staphylococci (30%), M tuberculosis (19%), and streptococci (14%). Adding PCR enhanced the sensitivity compared with culture alone (1) for the diagnosis of M tuberculosis spondylodiscitis (64.4% vs 42.2%; P < .01) and (2) for nonstaphylococci BJI (81.6% vs 71.3%; P < .01). It is interesting to note that 16S-PCR could detect BJI due to uncommon bacteria such as Mycoplasma and fastidious bacteria.
Our study showed the benefit of 16S-PCR and PCR targeting M tuberculosis as add-on tests in cases of suspected BJI.
The management of bone and joint infections (BJIs), including infectious spondylodiscitis (IS), septic arthritis (SA), and prosthetic joint infections (PJIs), relies on a body of evidence based on clinical, radiological, histological, and biological data [1–3]. Infectious and noninfectious causes of bone and joint diseases can be difficult to distinguish [1–3], and microbiological diagnosis is crucial and should display high confidence to contribute to the diagnosis of BJI. Moreover, microbiological diagnosis also determines selection of an adequate antimicrobial treatment able to cure these painful and disabling diseases and to prevent complications [1–3].
Microbiological diagnosis currently relies on cultures, but molecular methods have been suggested to optimize the diagnosis of BJI. These molecular methods often correspond to targeted polymerase chain reaction (PCR) or broad-range PCR, based on amplification and sequencing of 16S ribosomal deoxyribonucleic acid (rDNA) gene (16S-PCR). In the literature, the sensitivity of culture spans a large range: 43%–78% in IS [4], 50% for gonococcal arthritis, 90% for nongonococcal arthritis [3], and 60%–92% in PJIs [5–11]. The same variability is described for sensitivity (50%–94%) and specificity (65%–94%) [5, 8, 9, 12–17] of 16S-PCR. Altogether, the sensitivity of 16S-PCR was reported as equivalent [9], lower [8], or higher [12] than that of culture in previous studies. For tuberculous spondylodiscitis, previous studies displayed various sensitivities of Mycobacterium tuberculosis culture (50%–83%) and targeted PCR (72%–94.7%) [18–20]. It is interesting to note that most previous studies compared sensitivity of culture versus PCR [8, 9]. Bémer et al [8] conducted a prospective multicenter study to assess the relevance of 16S-PCR in the diagnosis of PJI and showed a lack of sensitivity of 16S-PCR (73.3%) versus that of culture (89%), as observed by Marín et al [9]. Only few studies described the interest of a systematic PCR in culture-negative osteoarticular infections. Levy et al [12] described that systematic detection of 16S rDNA in negative-culture samples can lead to an additional 9% diagnosis of BJI; most often for patients previously exposed to antibiotics. Hence, most previous studies compared sensitivity of culture versus PCR [8, 9], and only one compared the performance of culture+PCR versus culture alone [14]. In this study, we conducted a prospective monocentric study over a 4-year period to compare PCR plus culture versus culture alone for the diagnosis of well defined BJI.
MATERIAL AND METHODS
Study Design
A prospective study was conducted during a 4-year period (from November 2007 to October 2011) in Lariboisière University Hospital (Paris, France). For a robust definition of cases (infected patients) and controls (noninfected patients), the following 3-step approach was conducted (Figure 1):
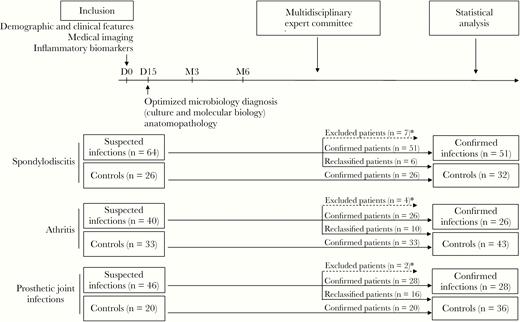
Description of patient groups at inclusion and after the analysis of the expert committee. *, Patients with insufficient data were excluded from the study.
Inclusion of Patients With Suspected Bone and Joint Infection.
Patients with suspicion of IS, SA, and PJI were included by physicians caring for the patients. Inclusion was done following commonly accepted criteria [1–3, 21] based on clinical presentation, medical imaging, and inflammatory biomarkers currently available at day 0 (Figure 1) (for inclusion criteria, see the Supplementary Methods). At this step, physicians did not have access to the results of the culture or the PCR.
Patients with vertebral tumor and osteoarthritis and patients with primitive osteoarthritis undergoing a first prosthesis surgery constituted the respective control groups
Follow-up.
Clinical, demographic, radiological, histological, and microbiological data (including molecular and culture results) were collected in patients’ case report forms (CRFs) at inclusion, after 2 weeks, and after 3 and 6 months. Data concerning other concomitant infections were collected in the CRF for all patients. No other concomitant infections were noticed for all the patients in case or control groups.
Definitive Definition of Infected and Noninfected Patients.
Case report forms were analyzed by an independent expert committee that did not interact with physicians caring for the included patients or with microbiologists involved in molecular and culture results. This committee consisted of French experts of BJI (Dr. Thomas Bauer, orthopedic surgeon; Dr. Valérie Chicheportiche, radiologist; Dr. Nicole Desplaces, microbiologist and infectious diseases specialist; Dr. Fredérique Larousserie, pathologist; Dr. Edouard Pertuiset, rheumatologist). Using international recommendations or accepted criteria [1–3, 21] and a bundle of clinical, radiological. and biological evidence, the expert committee confirmed or invalidated infection. The expert committee reached these conclusions after a consensus of all experts on the basis of CRF data, following international recommendations or accepted criteria [1–3, 21]. It is noteworthy that, for patients with PJI who did not have all data required for classification by Musculoskeletal Infection Society (MSIS) criteria, PJI diagnosis was made using Infectious Diseases Society of America (IDSA) guidelines. Patients with insufficient data were excluded from the study.
Finally, cases were infected patients confirmed by the expert committee. Controls were noninfected patients, including initial control group patients and those reclassified as noninfected by the expert committee (Figure 1).
Ethics Statement
All included cases and controls were aged 18 years or older, covered by social security, and accepted to be included in the study after informed consent. This study was approved by the local institutional review board and was registered on clinicaltrial.gov (NCT01193803). (Polymerase chain reaction must be considered an add-on test in cases of suspected BJIs when cultures remain negative, with performance depending on pathogens.)
Clinical Specimens
Clinical specimens were recovered at bedside, under radiological control, or during surgery, following strict aseptic conditions. The samples consisted of fluids (as puncture aspirations or lavages) and tissue specimens (as discovertebral biopsies, synovial membranes, or periprosthetic tissues) that were subsequently sent to the microbiology laboratory within 4 hours.
Microbiological and Histological Methods
Gram staining was performed on all clinical samples. For fluids, erythrocyte and leukocyte counts were done, with a determination of the polymorphonuclear percentage for any count >1000/mm3. Histological analysis was performed on dedicated specimens after a semiquantitative evaluation of polymorphonuclear leukocyte count in high-power fields on frozen tissue sections.
Tissues were placed in sterile Nalgene vials containing 10 mL sterile water and 5 mL sterile glass beads (1.5-mm diameter) and crushed by the Retsch MM301 Mixer Mill for 3.5 minutes at 30 Hz, as previously described [10]. Crushed tissues and fluids were cultured at 35°C on blood agar plates (aerobically and anaerobically), Polyvitex chocolate agar plate (under 5% CO2), and in Rosenow broth for a 7-day incubation. After 1 week, Rosenow broths were systematically replated on a new set of agar plates and incubated in the same conditions for 7 more days. Bacteria from isolated colonies were identified using MALDI-TOF-MS (Microflex-Bruker Daltonics/BioTyper, Wissembourg, France).
All specimens of the spondylodiscitis group (cases and controls) and fluids of the SA group (cases and controls) with synovial leucocytes count >1000/mm3 were submitted to auramine staining and cultured on Lowenstein-Jensen and Coletsos agar and mycobacterial growth indicator tube (MGIT) media (BD Diagnostic Systems, Le Pont de Claix, France) at 37°C for 3 months for mycobacteria culture. Mycobacterium tuberculosis was identified using GenoType MTBC (Hain Lifescience, Bandol, France).
Molecular Methods
An aliquot of 200 µL fluids and of 2 mL crushed tissues was centrifuged and stored at −80°C for molecular analysis. To optimize the cell wall lysis, a specific procedure was conducted using lysozyme, lysostaphin, and proteinase K, as previously described [22]. Total DNA was extracted using EZ1 DNA Tissue Kit (QIAGEN, Courtaboeuf, France) on the EZ1 apparatus, according to the manufacturer’s instructions. A fragment of the beta-actin gene was amplified to control for the absence of inhibitors and the quality of the sample after extraction. Broad-range 16S rDNA gene amplification (16S-PCR) was done using 536F and 1050R as previously described [5]. Polymerase chain reaction products were purified using the NucleoSpin Extract Kit (Macherey-Nagel, Hoerdt, France) and directly sequenced with the same sets of primers using the BigDye Terminator v3.1 Cycle Sequencing Kit on an ABI PRISM 3100 automatic sequencer (Applied Biosystems). Nucleotide sequences were then compared with those present in leBIBI [23] and National Center for Biotechnology Information (NCBI) databases. For all specimens of the spondylodiscitis group (cases and controls), specific detection of M tuberculosis was performed with the Artus M tuberculosis RG PCR kit in a Rotorgene-300 PCR cycler (QIAGEN) according to the manufacturer’s instructions.
Statistical Analysis
Characteristics of the study groups and the performances of microbiological approaches were compared using the Wilcoxon rank-sum or McNemar’s test. P < .05 were considered statistically significant. Analyses were performed using the SAS statistical software package, version 9.1 (SAS Institute, Cary, NC) and R, version 3.1.3.
RESULTS
A total of 229 patients were included with 150 patients suspected of BJI and 79 controls (Figure 1, Supplementary Table 1). The BJI suspected patients were distributed in 64 IS, 40 SA, and 46 PJIs; 26, 33, and 20 patients were included in the corresponding control groups, respectively. After the expert committee analysis, 13 patients were excluded due to insufficient data, and 32 patients initially suspected of infection were reclassified and placed into the control groups, representing 9%, 25%, and 35% of the IS, SA, and PJI groups, respectively. Data concerning reclassified patients are available in Supplementary Table 2. Overall, a definitive diagnosis of infection was confirmed in 105 of 150 suspected infected patients of BJI: 51 IS, 26 SA, and 28 PJIs; 111 noninfected patients were considered controls.
Clinical and Biological Characteristics of Patients With Confirmed Infections
The main patient characteristics are shown in Table 1 and Supplementary Table 3. Patients with confirmed BJI presented fever more frequently than controls (28.2% vs 4.5% for IS, 41.7% vs 9.5% for SA, 25% vs 0% for PJI patients). Local inflammation was more frequently observed in BJI patients compared with controls (76.9% vs 18.6% in SA; 84.6% vs 18.8% in PJI). Local pain was frequent but not significantly different between infected and control patients (95.8% vs 87.1% in IS, 98.6% vs 97.7% in SA, and 84.6 vs 97.1 in PJI). With regards to inflammatory biomarkers, mean C-reactive protein (CRP) and erythrocyte sedimentation rate were significantly higher in BJI patients with IS (respectively 73 vs 32 mg/L and 58 vs 37 mm/hour), with SA (respectively 175 vs 57 mg/L and 69 vs 36 mm/hour) but not with PJI. Blood leukocyte count was higher in infected patients compared with the control group for SA (11.2 vs 7.7 g/L) but not for IS and PJI patients. Synovial fluid leukocyte count was higher for SA patients compared with the control group (60 441 vs 8345 leukocytes/mm3). In Supplementary Table 4, a comparison between tuberculosis and pyogenic spondylodiscitis highlights a significant loss of weight (>5%) in the last 2 months for the tuberculosis subgroup (P = .01) and a significant increase in the CRP rate in the pyogenic subgroup (P < .01).
Clinical Characteristics of Patients With Confirmed Bone and Joint Infections (Infected Patients) and Control Patients
| All Bone and Joint Infections | Infectious Spondylodiscitis | Septic Arthritis | Prosthetic Joint Infections | |||||||||
|---|---|---|---|---|---|---|---|---|---|---|---|---|
| Variable | Infected n = 105 (%) | Controls n = 111 (%) | P Value | Infected n = 51 (%) | Controls n = 32 (%) | P Value | Infected n = 26 (%) | Controls n = 43 (%) | P Value | Infected n = 28 (%) | Controls n = 36 (%) | P Value |
| Clinical Characteristics | ||||||||||||
| Mean age (years, SD) | 58.2 ± 17.0 | 62.2 ± 14.3 | .10 | 55.2 ± 17.5 | 63.8 ± 11.4 | .02 | 55.4 ± 17.9 | 59.7 ± 15.6 | .30 | 65.9 ± 12.6 | 63.8 ± 14.9 | .55 |
| Female gender | 36 (34.3) | 65 (58.6) | <.01 | 16 (31.4) | 15 (46.9) | .15 | 9 (34.6) | 28 (65.1%) | .01 | 11 (39.3) | 22 (61.1) | .08 |
| BMI | 25.6 ± 6.0 | 26.3 ± 4.6 | .08 | 23.4 ± 4.8 | 23.9 ± 3.4 | .67 | 24.1 ± 4.2 | 26.5 ± 4.2 | .04 | 30.1 ± 6.8 | 27.7 ± 5.2 | .27 |
| Fever >38°C | 26 (31.3) | 3 (4.3) | <.01 | 11 (28.2) | 1 (4.5) | .04 | 10 (41.7) | 2 (9.5) | .01 | 5 (25.0) | 0 (0.0) | .01 |
| Pain | 94 (94.0) | 103 (94.5) | 1.00 | 46 (95.8) | 27 (87.1) | .20 | 68 (98.6) | 42 (97.7) | 1.000 | 22 (84.6) | 34 (97.1) | .15 |
| Local inflammation | NA | NA | NA | NA | NA | NA | 20 (76.9) | 8 (18.6) | <.01 | 22 (84.6) | 6 (18.8) | <.01 |
| Neurological deficit | NA | NA | NA | 11 (39.3) | 13 (28.3) | .33 | NA | NA | NA | NA | NA | NA |
| Biology | ||||||||||||
| Mean serum CRPa (mg/L) | 116 ± 103 | 46 ± 63 | <.01 | 73 ± 60 | 32 ± 46 | <.01 | 175 ± 133 | 57 ± 80 | <.01 | 136 ± 98 | 71 ± 58 | .14 |
| Mean ESRb (mm/hour) | 61 ± 30 | 36 ± 34 | <.01 | 58 ± 31 | 37 ± 40 | .01 | 69 ± 27 | 36 ± 26 | <.01 | ID | ID | ID |
| Mean blood leukocyte count (g/L) | 9.2. ± 4.3 | 8.2 ± 2.7 | .65 | 7.6 ± 3.6 | 7.7 ± 2.6 | .50 | 11.2 ± 4.6 | 7.7 ± 2.5 | .03 | 10.0 ± 4.4 | 8.9 ± 2.7 | .36 |
| Mean synovial fluid leukocytes count per mm3 | NA | NA | NA | NA | NA | NA | 60 441 ± 58 508 | 8345 ± 21 758 | <.01 | 72 700 ± 55 578 | 11 670 ± 20 319 | .10 |
| Mean synovial fluid %polymorphonuclear | NA | NA | NA | NA | NA | NA | 89.7 ± 8.0 | 84.8 ± 12.4 | .60 | ID | ID | ID |
Abbreviations: BMI, body mass index; CRP, C-reactive protein; ESR, erythrocyte sedimentation rate; ID, insufficient data; NA, not applicable; SD, standard deviation.
aNormal value <5 mg/L.
bNormal value 5–20 mm/hour.
Causative Microorganisms of Bone and Joint Infections
Microorganisms involved in BJI according to the expert committee are shown in Table 2. Of 105 BJI cases, the first etiology was staphylococci (n = 32; 30%), in particular Staphylococcus aureus (n = 24; 75% of staphylococci). Staphylococci represented the most common cause of SA (n = 10; 38%) and PJI (n = 12; 43%), whereas they were the second most common cause for IS (n = 10; 20%).
Microorganisms Involved in Bone and Joint Infections According to the Expert Committee
| Microorganism | All BJI (%) (n = 105) | IS (%) (n = 51) | SA (%) (n = 26) | PJI (%) (n = 28) |
|---|---|---|---|---|
| Staphylococci | 32 (30) | 10 (20) | 10 (38) | 12 (43) |
| Staphylococcus aureus | 24 | 8 | 9 | 7 |
| Staphylococcus epidermidis | 7 | 2 | 5 | |
| Staphylococcus lugdunensis | 1 | 1 | ||
| Streptococci | 15 (14) | 7 (14) | 3 (12) | 5 (18) |
| Streptococcus pneumoniae | 4 | 1 | 2 | 1 |
| Streptococcus agalactiae | 3 | 2 | 1 | |
| Streptococcus anginosus | 2 | 1 | 1 | |
| Aerococcus urinae | 1 | 1 | ||
| Granulicatella adiacens | 1 | 1 | ||
| Streptococcus bovis | 1 | 1 | ||
| Streptococcus crispatus | 1 | 1 | ||
| Streptococcus equisimilis | 1 | 1 | ||
| Streptococcus gordonae | 1 | 1 | ||
| Enterobacteriaceae | 8 (8) | 2 (4) | 2 (8) | 4 (14) |
| Proteus mirabilis | 1 | 1 | ||
| Salmonella Typhimurium | 1 | 1 | ||
| Enterobacter cloacae | 2 | 1 | 1 | |
| Escherichia coli | 4 | 2 | 2 | |
| Mycoplasma | 4 (4) | 2 (8) | 2 (7) | |
| Mycoplasma hominis | 2 | 2 | ||
| Mycoplasma penetrans | 1 | 1 | ||
| Ureaplasma spp | 1 | 1 | ||
| Anaerobic | 5 (5) | 4 (8) | 1 (4) | |
| Propionibacterium acnes | 2 | 2 | ||
| Micromonas micros | 2 | 2 | ||
| Bacteroides vulgatus | 1 | 1 | ||
| Candida albicans | 3 (3) | 3 (6) | ||
| Miscellaneous | 9 (9) | 5 (10) | 2 (8) | 2 (7) |
| Neisseria gonorrhoeae | 2 | 2 | ||
| Pseudomonas aeruginosa | 1 | 1 | ||
| Haemophilus aphrophilus | 1 | 1 | ||
| Brucella melitensis | 1 | 1 | ||
| Enterococcus spp | 1 | 1 | ||
| Corynebacterium striatum | 1 | 1 | ||
| Enterococcus faecalis + E coli | 1 | 1 | ||
| E faecalis + S epidermidis | 1 | 1 | ||
| Unknown | 9 (9) | 4 (8) | 3 (12) | 2 (7) |
| Total pyogenic microorganisms | 85 (81) | 35 (69) | 22 (85) | 28 (100) |
| Mycobacterium tuberculosis | 20 (19) | 16 (31) | 4 (15) | 0 |
The bold text corresponds to sums per general/group.
Abbreviations: BJI, bone and joint infections; IS, infectious spondylodiscitis; PJI, prosthesis joint infection; SA, septic arthritis.
The second etiology was M tuberculosis (n = 20; 19%), with 16 cases of spinal tuberculosis and 4 cases of tuberculous arthritis. For 2 of 20 patients, neither PCR nor cultures were positive, and the diagnosis of M tuberculosis IS was based on clinical, magnetic resonance imaging, and histological arguments.
Streptococci (n = 15; 14%) were the third cause of all BJI and the second etiology of PJI (18%), with the majority being Streptococcus pneumoniae (n = 4; 26.6% of streptococci). According to the expert committee, microbiological etiology was unknown for 9 cases, as observed in 8%, 12%, and 7% of IS, SA, and PJI, respectively.
Enterobacteriaceae infections (n = 8; 8%) accounted for the third etiology of PJI (n = 4; 14%), and 2 polymicrobial PJIs were due to Staphylococcus epidermidis + Enterococcus faecalis and Escherichia coli + E faecalis. It is noteworthy to mention that we found 4 cases of BJIs due to Mycoplasma spp (2 SA and 2 PJI) and 2 SA due to Neisseria gonorrhoeae.
Performances of Culture Versus Culture+16S: Per-Sample Analysis
We obtained 308 samples for the 105 BJI patients (2.9 ± 1.3 samples per patient) and 245 samples for the 111 controls (2.2 ± 1.3 samples per patient) (Supplementary Table 1). The performances of culture alone, 16S-PCR, and culture+16S-PCR were assessed considering each sample individually for diagnosis of infection, and results are shown in Table 3, Table 4, and Table 5. No PCR inhibitor was detected in any samples tested.
Performances of culture, PCR and culture+PCR for staphylococci, considering each sample independently
| Test | Sensitivity (%)a | Specificity (%)a | n |
|---|---|---|---|
| Culture | 80.6% (71.1%–88.1%) | 95.9% (94.0%–97.7%) | 528 |
| 16S-PCR | 54.8% (44.2%–65.2%) | 99.5% (98.9%–100.0%) | 528 |
| Culture + 16S-PCR | 83.9% (74.8%–90.7%) | 95.4% (93.4%–97.4%) | 528 |
| P valueb | .08 | .16 |
| Test | Sensitivity (%)a | Specificity (%)a | n |
|---|---|---|---|
| Culture | 80.6% (71.1%–88.1%) | 95.9% (94.0%–97.7%) | 528 |
| 16S-PCR | 54.8% (44.2%–65.2%) | 99.5% (98.9%–100.0%) | 528 |
| Culture + 16S-PCR | 83.9% (74.8%–90.7%) | 95.4% (93.4%–97.4%) | 528 |
| P valueb | .08 | .16 |
Abbreviation: PCR, polymerase chain reaction.
aThe values in parentheses are 95% confidence intervals.
bThe P value is from McNemar’s test for culture versus culture+PCR.
Performances of culture, PCR and culture+PCR for nonstaphylococci, considering each sample independently
| Test | Sensitivity (%)a | Specificity (%)a | n |
|---|---|---|---|
| Culture | 71.3% (63.7%–78.9%) | 96.0% (94.0%–97.9%) | 533 |
| 16S-PCR | 66.7% (58.3%–75.0%) | 98.3% (97.0%–99.5%) | 529 |
| Culture + 16S-PCR | 81.6% (75.1%–88.1%) | 94.5% (92.2%–96.7%) | 533 |
| P valueb | < .01 | .01 |
| Test | Sensitivity (%)a | Specificity (%)a | n |
|---|---|---|---|
| Culture | 71.3% (63.7%–78.9%) | 96.0% (94.0%–97.9%) | 533 |
| 16S-PCR | 66.7% (58.3%–75.0%) | 98.3% (97.0%–99.5%) | 529 |
| Culture + 16S-PCR | 81.6% (75.1%–88.1%) | 94.5% (92.2%–96.7%) | 533 |
| P valueb | < .01 | .01 |
Abbreviation: PCR, polymerase chain reaction.
aThe values in parentheses are 95% confidence intervals.
bThe P value is from McNemar’s test for culture versus culture+PCR.
Performances of culture, PCR and culture+PCR for Mycobacterium tuberculosis, considering each sample independently
| Test | Sensitivity (%)a | Specificity (%)a | nb |
|---|---|---|---|
| Culture | 42.2% (27.8%–56.7%) | 100.0% (98.2%–100.0%) | 244 |
| PCR | 42.3% (28.9%–55.7%) | 100.0% (98.2%–100.0%) | 251 |
| Culture + PCR | 64.4% (50.5%–78.4%) | 100.0% (98.2%–100.0%) | 244 |
| P valuec | < .01 | NA |
| Test | Sensitivity (%)a | Specificity (%)a | nb |
|---|---|---|---|
| Culture | 42.2% (27.8%–56.7%) | 100.0% (98.2%–100.0%) | 244 |
| PCR | 42.3% (28.9%–55.7%) | 100.0% (98.2%–100.0%) | 251 |
| Culture + PCR | 64.4% (50.5%–78.4%) | 100.0% (98.2%–100.0%) | 244 |
| P valuec | < .01 | NA |
Abbreviations: NA, not applicable; PCR, polymerase chain reaction.
aThe values in parentheses are 95% confidence intervals.
bThis subset corresponds to patients with spondylodiscitis, for which specific cultures and PCR have been performed systematically.
cThe P value is from McNemar’s test for culture versus culture+PCR.
For staphylococci, sensitivity was 80.6%, 54.8%, and 83.9%, and specificity was 95.9%, 99.5%, and 95.4% for culture alone, 16S-PCR, and culture+16S-PCR, respectively. The sensitivity and specificity of culture alone versus culture+16S were not significantly different (80.6% vs 83.9%, P = .08; 95.9% vs 95.4%, P = .16).
For nonstaphylococci, sensitivity was 71.3%, 66.7%, and 81.6%, and specificity was 96.0%, 98.3%, and 94.5% for culture, 16S-PCR, and culture+16S-PCR, respectively. The sensitivity of culture+16S-PCR was higher than that of culture alone (81.6% vs 71.3%, P < .01), and the specificity of culture+16S-PCR was lower than that of culture alone (94.5% vs 96%, P = .01). The decrease in specificity of culture+16S-PCR compared with that of culture alone was mainly associated with commensal bacteria easily considered contaminants by the expert committee (data not shown).
Specific cultures (multiplexed-tandem [MT] cultures) and PCR (MT-PCR) were systematically performed to detect M tuberculosis in the IS subgroup, and they constituted 174 samples from 51 infected patients (3.4 ± 0.9 samples per patient) and 77 samples from 32 control patients (2.3 ± 1.1 samples per patient) (Supplementary Table 1). Sensitivity was 42.2%, 42.3% and 64.4%, for MT-culture, MT-PCR, and MT-culture+MT-PCR, respectively, and specificity was 100% for all approaches. It is interesting to note that the sensitivity of MT-culture+MT-PCR was significantly higher than that of MT-culture alone (64.4% vs 42.2%, P < .01).
Performances of Culture Versus Culture+16S: Per-Patient Analysis
Next, a per-patient analysis was conducted for the diagnosis of BJI. Performances of culture, 16S-PCR, and culture+16S-PCR are described in Table 6, Table 7, and Table 8. Microorganisms identified by culture and/or PCR are detailed in Supplementary Table 5.
Performances of culture, PCR and culture+PCR for staphylococci, per patient
| Test | Sensitivity (%)a | Specificity (%)a | n |
|---|---|---|---|
| Culture | 97.0% (84.2%–99.9%) | 92.0% (87.9%–96.0%) | 207 |
| 16S-PCR | 66.7% (48.2%–82.0%) | 98.9% (97.3%–100.0%) | 207 |
| Culture + 16S-PCR | 97.0% (84.2%–99.9%) | 90.8% (86.5%–95.1%) | 207 |
| P valueb | NA | .16 |
| Test | Sensitivity (%)a | Specificity (%)a | n |
|---|---|---|---|
| Culture | 97.0% (84.2%–99.9%) | 92.0% (87.9%–96.0%) | 207 |
| 16S-PCR | 66.7% (48.2%–82.0%) | 98.9% (97.3%–100.0%) | 207 |
| Culture + 16S-PCR | 97.0% (84.2%–99.9%) | 90.8% (86.5%–95.1%) | 207 |
| P valueb | NA | .16 |
Abbreviation: NA, not applicable; PCR, polymerase chain reaction.
aThe values in parentheses are 95% confidence intervals.
bThe P value is from McNemar’s test for culture versus culture+PCR.
Performances of culture, PCR and culture+PCR for nonstaphylococci, per patient
| Test | Sensitivity (%)a | Specificity (%)a | n |
|---|---|---|---|
| Culture | 81.8% (70.4%–93.2%) | 93.3% (89.4%–97.1%) | 207 |
| 16S-PCR | 85.4% (74.5%–96.2%) | 96.4% (93.5%–99.2%) | 207 |
| Culture + 16S-PCR | 95.5% (89.3%–100.0%) | 90.2% (85.6%–94.8%) | 207 |
| P valueb | .01 | .03 |
| Test | Sensitivity (%)a | Specificity (%)a | n |
|---|---|---|---|
| Culture | 81.8% (70.4%–93.2%) | 93.3% (89.4%–97.1%) | 207 |
| 16S-PCR | 85.4% (74.5%–96.2%) | 96.4% (93.5%–99.2%) | 207 |
| Culture + 16S-PCR | 95.5% (89.3%–100.0%) | 90.2% (85.6%–94.8%) | 207 |
| P valueb | .01 | .03 |
Abbreviation: PCR, polymerase chain reaction.
aThe values in parentheses are 95% confidence intervals.
bThe P value is from McNemar’s test for culture versus culture+PCR.
Performances of culture, PCR and culture+PCR for Mycobacterium tuberculosis, per patient
| Test | Sensitivity (%)a | Specificity (%)a | Nb |
|---|---|---|---|
| Culture | 50.0% (24.7%–75.3%) | 100.0% (94.6%–100.0%) | 83 |
| PCR | 68.8% (41.3%–89.0%) | 100.0% (94.6%–100.0%) | 83 |
| Culture + PCR | 87.5% (61.7%–98.4%) | 100.0% (94.6%–100.0%) | 83 |
| P valuec | .01 | NA |
| Test | Sensitivity (%)a | Specificity (%)a | Nb |
|---|---|---|---|
| Culture | 50.0% (24.7%–75.3%) | 100.0% (94.6%–100.0%) | 83 |
| PCR | 68.8% (41.3%–89.0%) | 100.0% (94.6%–100.0%) | 83 |
| Culture + PCR | 87.5% (61.7%–98.4%) | 100.0% (94.6%–100.0%) | 83 |
| P valuec | .01 | NA |
Abbreviations: NA, not applicable; PCR, polymerase chain reaction.
aThe values in parentheses are 95% confidence intervals.
bThis subset corresponds to patients with spondylodiscitis, for which specific cultures and PCR have been performed systematically.
cThe P value is from McNemar’s test for culture versus culture+PCR.
For staphylococci, sensitivity was 97.0%, 66.7%, and 97.0%, and specificity was 92.0%, 98.9%, and 90.8% for culture, 16S-PCR, and culture+16S-PCR, respectively. As observed for per-sample analysis, the sensitivity and specificity of culture+16S-PCR versus culture alone were not significantly different (97.0% vs 97.0%, P = NA and 92.0% vs 90.8%, P = .16), but the specificity of the PCR was very high.
For nonstaphylococci, sensitivity was 81.8%, 85.4%, and 95.5%, and specificity was 93.3%, 96.4%, and 90.2% for culture, 16S-PCR, and culture+16S-PCR, respectively. The sensitivity of culture+16S-PCR was higher than that of culture alone (95.5% vs 81.8%, P < .01), and the specificity of culture+16S-PCR was lower than that of culture alone (90.2% vs 93.3%, P = .03).
Concerning M tuberculosis detection for the 83 patients of the spondylodiscitis group, sensitivity of MT-culture, MT-PCR, and MT-culture+MT-PCR was 50.0%, 68.8%, and 87.5%, respectively, with a specificity of 100% for all approaches. It is interesting to note that the sensitivity of MT-culture+MT-PCR was higher than that of MT-culture alone (87.5% vs 50%, P < .01).
DISCUSSION
In this prospective study, we evaluated the benefit of molecular methods for the diagnosis of BJI established by an expert committee. We showed that (1) adding a specific PCR enhanced the sensitivity compared with culture alone for the diagnosis of M tuberculosis spondylodiscitis and (2) adding 16S-PCR enhanced the sensitivity for nonstaphylococci BJI, but not for staphylococcal BJI.
The diagnosis of BJI often relies on a body of evidence [1–3], and some signs can mislead the physicians. Hence, the differential diagnosis between infectious and noninfectious causes of bone and joint diseases can be difficult. Although this was not the main objective of our study, our results showed that fever >38°C and CRP were major elements in the diagnosis of SA and pyogenic IS but not of PJI and tuberculous IS [3, 11, 24].
Although numerous reviews are available for the management of native SA [3, 25], no recommendations have been published, emphasizing the complexity of this diagnosis. For PJI, 2 recommendations published by IDSA and MSIS are currently available, underlining the complexity in defining a consensus [1, 21]. In our prospective study, an independent expert committee, consisting of experts in infectious diseases and microbiology, pathology, radiology, rheumatology, and orthopedics, analyzed clinical, demographic, microbiological, and radiological data to confirm or invalidate case and control patients, in accordance with current recommendations or accepted criteria [1–3, 21]. This board reclassified 25% (n = 10), 9% (n = 6) and 35% (n = 16) of suspected IS, SA, and PJI as controls in the corresponding groups. Misclassified patients suspected of SA and IS were mainly affected by inflammatory pathologies and evolved favorably with anti-inflammatory drugs. Misclassified patients suspected of prosthetic infections suffered mainly of prosthetic loosening and evolved favorably in the absence of antibiotic therapy. Altogether, this high rate of reclassification stresses (1) the difficulty of diagnosis of those BJIs on clinical and radiological signs and inflammatory biomarkers and (2) the need for a multidisciplinary team to manage BJIs.
This robust classification of infected and noninfected cases allowed us to assess the benefit of 16S-PCR and MT-PCR for the diagnosis of BJI. In our study, the performance of PCR and cultures depended on the pathogens. This helped to explain why the sensitivity of 16S-PCR was surprisingly reported as equivalent [9], lower [8], or higher [12] than that of culture in previous studies. For staphylococci infections, we did not observe a significant gain of sensitivity with culture+16S-PCR versus culture (83.9% vs 80.9%; P = .08), considering each sample independently. This result is attributable to a low sensitivity of 16S-PCR for staphylococci, probably due to a poor lysis of staphylococci cell walls at the DNA extraction step, as mentioned by Cazanave et al [16]. It is interesting to note that, with a median of 2.9 samples per patient, the sensitivity per patient was increased to 97% for cultures of staphylococci. This result underlines that our culture-based strategy is quite optimal for staphylococci detection.
Considering nonstaphylococci infections, we showed a higher sensitivity by combining 16S-PCR and cultures versus cultures alone (81.6% vs 71.3%, P < .01) and considering each sample independently. This benefit is due to the gain in sensitivity of PCR for diagnosis of pneumococcal, enterococcal, and mycoplasma infections found in our study. Because mycoplasma are not covered by usual empiric antibiotic treatment in BJI, a rapid real-time PCR targeting mycoplasma could be interesting to implement, particularly for patients with risk factors of mycoplasma extragenital infections [26].
It is interesting to note that, even in per-patient analysis, sensitivity of culture+PCR is higher than that of culture alone (95.5% vs 81.8%, P < .01). This result underlines that our culture-based strategy is improved by adding 16S-PCR for the detection of pyogenic microorganisms other than staphylococci.
For tuberculous spondylodiscitis, previous studies displayed various sensitivities of cultures (50%–83%) and PCR (72%–94.7%) [18–20] without demonstrating an advantage in combining culture and PCR. In our study, the sensitivity of MT-culture combined with MT-PCR was significantly higher than that of MT-culture alone in the per-sample analysis (64.4% vs 42.2%, P < .01). It is interesting to note that, with a median of 3.4 samples per patient in the IS group (Supplementary Table 1), sensitivity rose up to 50% and 87.5% for MT-culture and MT-culture+MT-PCR (P < .01), respectively, in the per-patient analysis. This result underlines that our culture-based strategy is improved by adding MT-PCR.
This study is subject to few limitations. (1) The single-center design of our study and number of patients could be an obstacle to the generalization of our results. Nevertheless, this approach allowed us to control technical biases, and the local epidemiology of PJI we diagnosed was equivalent to those found in the literature [11]. In addition, the high proportion of M tuberculosis infections in the IS group allowed us to demonstrate the utility of specific MT-PCR in this indication. (2) Antibiotic exposure was often missed in the CRFs, limiting analysis of the added value of PCR after previous antibiotic exposure. However, recent work suggests that the use of antibiotics before sampling could also reduce the sensitivity of the 16S-PCR [8]. Nevertheless, the results of the sensitivity of culture in our study were comparable to those found in the literature [4, 9].
CONCLUSIONS
In conclusion, our prospective study shows that MT-PCR is clearly beneficial in case of high suspicion of IS. In case of high suspicion of bone and joint infection, 16S-PCR must be considered, particularly when cultures remain negative, keeping in mind that performance depends on the pathogens involved. New technologies, such as microarrays and next-generation sequencing, are promising approaches for the diagnosis of BJI [27, 28] and must be assessed with similar clinical definitions of infected patients and controlled trials.
Supplementary Data
Supplementary materials are available at Open Forum Infectious Diseases online. Consisting of data provided by the authors to benefit the reader, the posted materials are not copyedited and are the sole responsibility of the authors, so questions or comments should be addressed to the corresponding author.
Acknowledgments
Financial support. This study was funded by a grant from Assistance Publique des Hôpitaux de Paris (Direction de la Recherche Clinique et du Développement; CRC 06 057).
Potential conflicts of interest. All authors: no reported conflicts of interest. All authors have submitted the ICMJE Form for Disclosure of Potential Conflicts of Interest.
The MOLOS study Group is composed of Nicole Desplaces (La Croix Saint Simon Hospital), Thomas Bauer (A. Paré Hospital), Fréderique Larousserie (Cochin Hospital), Edouard Pertuisset (Pontoise Hospital), Valérie Chicheportiche (La Croix Saint Simon Hospital), and Martin Rottman (Raymond Poincaré Hospital) and the collaborators of the study in Saint-Louis–Lariboisière-Fernand Widal University Hospital (Laurent Sedel, Philippe Orcel, Thomas Bardin, Anne Allard, Jérémy Ora, Hang-Korng Ea, Olivier Peyr, Olivia Tran, Abdourahmane Diallo, Laurence Guery, Véronique Jouis, Laurent Raskine, Faiza Mougari, Gauthier de Ponfilly, Hanaa Benmansour, Emmanuel Lecorche, Marie-José Sanson-Le-Pors, Jacques Riahi, François Camelena, Thibault Poncin, Bassam Hamze, Jean-François Bergmann, Anne-Lise Munier, and Amanda Lopes).
References
Author notes
H. J. and V. F. contributed equally to this work.


Comments