


Abstract
Kindergarten-entry vaccination requirements have played an important role in controlling vaccine-preventable diseases in the United States. Forty-eight states and the District of Colombia offer nonmedical exemptions to vaccines, ranging in stringency.
We analyzed state-level exemption data from 2011 to 2012 through 2015 to 2016 school years. States were categorized by exemption ease and type of exemption allowed. We calculated nonmedical exemption rates for each year in the sample and stratified by exemption ease, type, and 2 trend categories: 2011–12 through 2012–13 and 2013–14 through 2015–16 school years. Using generalized estimating equations, we created regression models estimating (1) the average annual change in nonmedical exemption rates and (2) relative differences in rates by state classification.
The nonmedical exemption rate was higher during the 2013–2014 through 2015–2016 period (2.25%) compared to 2011–2012 through 2012–2013 (1.75%); more importantly, the average annual change in the latter period plateaued. The nonmedical exemption rate in states allowing philosophical and religious exemptions was 2.41 times as high as in states allowing only religious exemptions (incidence rate ratio = 2.41; 95% confidence interval, 1.71–3.41).
There was an increase in nonmedical exemption rates through the 2012–2013 school year; however, rates stabilized through the 2015–2016 school year, showing an important shift in trend.
School entry vaccine mandates have played an important role in controlling childhood communicable diseases in the United States [1]. Moreover, data on exemptions to these mandates are collected at least once a year in schools and reported to state health departments throughout the country, hence providing a direct annual measure of vaccine refusal [2].
Since the late 1990s, there has been an increase in nonmedical exemptions [3, 4]. Although this increase is likely to have multiple causes, it was preceded by substantial declines in vaccine-preventable diseases and coincided with publication of a now retracted case series linking the measles, mumps, and rubella (MMR) vaccine with autism [5]. The study was subsequently found to be fraudulent, and the lead author was deprived of his medical license by the UK General Medical Council [6].
High rates of nonmedical exemptions have been associated with higher rates of vaccine-preventable diseases [3, 7]. Local clusters of vaccine exemptions geographically overlap with outbreaks of pertussis [7, 8]. Moreover, nonmedical vaccine exemptions have played an important role in measles outbreaks after elimination of endemic measles transmission in the United States [9]. Recently, a large measles outbreak—first identified among visitors to Disneyland California—was associated with a large proportion of cases among individuals with nonmedical exemptions [10].
There have been 2 multiyear assessments of longitudinal trends in nonmedical exemption rates in the United States. Both of these analyses—which included data from 1993 through 2004 [3] and 2006 through 2011 [4]—found an increase in nonmedical exemptions. In fact, the rate of increase was higher in the 2006 through 2011 period compared to the 1993 through 2004 period [3, 4]. Moreover, there was an association between the administrative ease of obtaining nonmedical exemptions and rates on nonmedical exemptions and pertussis [3].
In recent years, the efforts to address the increase in nonmedical exemptions have intensified. Professional medical associations such as American Academy of Pediatrics, the Centers of Disease Control Prevention and Control, and state and local health departments have developed and disseminated resources to address vaccine hesitancy and refusal. The 2014–2015 measles outbreak that started in California, the so-called “Disneyland outbreak,” received considerable media attention, focusing on the individual and community risk of vaccine refusal [10]. Moreover, several states have enacted legislation to increase administrative scrutiny of requests to obtain nonmedical exemptions.
Although there have been a few recent reports of nonmedical exemption rates in various states, we are not aware of a longitudinal analysis of recent national trends in nonmedical exemption rates accounting for administrative ease of nonmedical exemptions. In this study, we evaluated secular trends in nonmedical exemptions in the United States between the 2011–2012 and 2015–2016 school years (inclusive) and evaluated the association between exemption rates and ease of obtaining nonmedical exemptions and types of exemptions permitted.
METHODS
In the United States, during the 2011–2012 through 2015–2016 school years, 48 states (excluding West Virginia and Mississippi) and the District of Colombia (DC) permitted nonmedical exemptions to vaccination requirements for school entry to kindergarten (California passed a law in 2016 removing all nonmedical exemptions, which went into effect after the study period). These state-level laws vary by administrative ease of obtaining nonmedical exemptions. For this analysis, we obtained data compiled yearly by the Centers for Disease Control and Prevention (CDC) on the number of exemptions filed for incoming kindergarteners [11–15]. We used publicly available documentation on state-level vaccine policies for this analysis [16]. A secondary reviewer verified each state’s vaccine exemption policy through state legislative and health department websites.
We categorized states by the type of nonmedical exemption allowed—only religious exemptions or allowing religious and philosophical exemptions—in addition to medical exemptions. We also categorized states by ease of obtaining a nonmedical exemption, using categories easy, medium, and difficult, adapted from Omer et al [3] (Table 1). This method of classification was chosen because ease of exemption has been shown to be associated with higher rates of disease [17]. In addition, we wanted our work to be comparable with other studies in this field, which have used the Omer et al [3] ease classifications, published in 2012. After initial analysis of the data by school year, we chose to stratify the data into year trend categories: one category including years 2011–2012 and 2012–2013, and another category including years 2013–2014 through 2015–2016 (Table 2).
Ease of Exemption Classification Standardsa
| Type of Requirement | Easyb | Mediumc | Difficultd |
|---|---|---|---|
| Form with parent signature required | x | X | x |
| Form available at school | x | ||
| Form available online | x | ||
| Form available at health department only | x | x | |
| Parent personal statement required | x | x | |
| Parent visit to health department required | x | x | |
| Form must be notarized | x | ||
| Signature of state official or religious leader required | x | ||
| Yearly recertification required | x |
aAdapted from Omer SB, Pan WK, Halsey NA, et al. Nonmedical exemptions to school immunization requirements: secular trends and association of state policies with pertussis incidence. JAMA 2006;296:1757–63.
bStates were classified as easy if they required at least 1 standard from the easy list and nothing from the medium or difficult list.
cStates were classified as medium if they required at least 2 standards from the medium list in addition to things from the easy list. These states did not have requirements from the difficult list.
dStates were classified as difficult if they required at least 3 standards from the difficult list in addition to anything from the medium or easy list.
State Nonmedical Exemption Rates, 2011–2012 and 2013–2015, Overall and Stratified in Two Trend Categories: Type of Exemption Permitted and Ease of Obtaining an Exemption
| Type of Exemption Permitted by States For Kindergarten | State-Years (N)a | Average Nonmedical Exemption Rate (%) | Annual Change in Exemption Rate Incidence Rate Ratio (95% CI) | Incidence Rate Ratio, by Ease of State Policy or Type of Exemption Permitted (95% CI) | ||
|---|---|---|---|---|---|---|
| Unadjusted | Adjustedb | Unadjusted | Adjustedb | |||
| Overall | 245 | 2.04% | 1.09 (1.05–1.14) | 1.11 (1.04–1.18) | - | - |
| Years 2011–2012 | 98 | 1.75% | 1.29 (1.07–1.55) | 1.45 (1.15–1.83) | - | - |
| Years 2013–2015 | 147 | 2.25% | 0.98 (0.95–1.02) | 1.00 (0.96, 1.05) | - | - |
| Type of Exemption Permitted by States For Kindergartenc | ||||||
| Overall | ||||||
| Only religious exemption | 149 | 1.27% | 1.20 (1.13–1.27) | 1.12 (1.02–1.24) | Reference | Reference |
| Philosophical exemption | 96 | 3.25% | 1.03 (1.00–1.08) | 1.07 (1.00–1.15) | 2.41 (1.71–3.41) | 2.15 (1.68–2.76) |
| Years 2011–2012 | ||||||
| Only religious exemption | 60 | 1.01% | 1.52 (1.56–2.01) | 1.72 (1.27–2.34) | Reference | Reference |
| Philosophical exemption | 38 | 2.94% | 1.17 (0.93–1.47) | 1.17 (0.88–1.56) | 2.91 (1.90–4.46) | 2.53 (1.75–3.68) |
| Years 2013–2015 | ||||||
| Only religious exemption | 90 | 1.45% | 1.04 (1.00–1.07) | 1.05 (1.01–1.11) | Reference | Reference |
| Philosophical exemption | 57 | 3.45% | 0.95 (0.91–0.99) | 0.99 (0.93–1.07) | 2.38 (1.70–3.32) | 2.06 (1.65–2.56) |
| Exemption Ease Categoried | ||||||
| Overall | ||||||
| Difficult | 97 | 1.84% | 1.10 (1.03–1.17) | 1.38 (1.21–1.58) | Reference | Reference |
| Medium | 100 | 1.77% | 1.08 (1.05–1.12) | 0.94 (0.86–1.03) | 0.86 (0.40–1.85) | 1.08 (0.67–1.74) |
| Easy | 48 | 2.97% | 1.16 (1.06–1.25) | 1.26 (1.11–1.44) | 1.08 (0.86–1.38) | 1.22 (0.90–1.66) |
| Years 2011–2012 | ||||||
| Difficult | 35 | 1.37% | 0.99 (0.80–1.23) | 1.07 (0.76–1.51) | Reference | Reference |
| Medium | 42 | 1.71% | 1.32 (1.04–1.67) | 1.51 (1.00–2.29) | 1.12 (0.65–1.93) | 2.24 (1.28–3.93) |
| Easy | 21 | 2.44% | 1.59 (0.97–2.59) | k | 1.37 (0.72–2.65) | 1.26 (0.90–1.77) |
| Years 2013–2015 | ||||||
| Difficult | 62 | 2.11% | 1.04 (1.00–1.08) | 1.16 (1.04–1.28) | Reference | Reference |
| Medium | 58 | 1.83% | 0.99 (0.95–1.02) | 1.05 (0.96–1.15) | 1.33 (0.92–1.93) | 1.29 (0.85–1.98) |
| Easy | 27 | 3.36% | 0.95 (0.89–1.01) | 0.89 (0.80–0.98) | 1.15 (0.97–1.37) | 1.15 (0.96–1.39) |
Abbreviation: CI, confidence interval.
aFor unadjusted estimates.
bAdjusted for income (10 categories), race (9 categories), education (5 categories), and population density.
cStates permitting only religious exemptions: AL, AK, CT, DE, DC, FL, GA, HI, IL, IN, IA, KS, KY, MD, MA, MO, MT, NE, NV, NH, NJ, NM, NY, NC, RI, SC, SD, TN, VA, WY. States permitting philosophical exemptions: AZ, AR, CA, CO, ID, LA, MA, MI, ND, OH, OK, OR, PA, TX, UT, VT, WA, WI.
dStates with easy exemption policies: AZ, CO, HI, MD, ND, RI, VT, WI. States with medium exemption policies: DC, FL, ID, IN, KS, LA, ME, MA, MO, NV, NJ, NY, NC, OH, OK, PA, SD, TN. States with difficult exemption policies: AL, AKe, AR, CAf, CTg, DE, GA, ILh, IA, KY, MIi, MN, MT, NE, NH, NM, ORj, SC, TX, UT, VA, WA, WY.
eMedium exemption policy from 2011 to 2102.
fEasy exemption policy in 2011–2012.
gEasy exemption policy from 2011 to 2014.
hMedium exemption policy from 2011 to 2014.
iMedium exemption policy from 2011 to 2014.
jEasy exemption policy from 2011 to 2013.
kThere is insufficient data to run a fully adjusted model. However, sufficient data exist to run the unadjusted model.
Over the course of the study period, 7 notable legislative changes went into effect. Each legislative change during the study period led to nonmedical exemptions being more difficult to obtain (Table 3). All changes in exemption ease classification were reflected in the dataset by coding each individual year with the corresponding ease classification. California and Vermont passed vaccine exemption legislation in 2016: California removed all nonmedical exemptions, and Vermont removed philosophical exemptions. Both of these bills went into effect on July 1, 2016, which fell just outside of our study period.
Legislative Changes from 2011 to 2016 That Impacted Nonmedical Exemption Ease Classifications
| State | Year of Change | Previous Classification | New Classification | Description |
|---|---|---|---|---|
| California | 2011 | Easy | Difficult | New law requires signature from healthcare provider and counseling about vaccine benefits before exemption is granted |
| Alaska | 2013 | Medium | Difficult | New law requires notarization of exemption form, and yearly recertification |
| Oregon | 2014 | Easy | Difficult | New law requires education from healthcare provider or through online portal to receive exemption forms |
| Illinois | 2015 | Medium | Difficult | Signature of healthcare provider is required on exemption form, with a parent personal statement |
| Connecticut | 2015 | Medium | Difficult | Exemption form requires notarization |
| Missouri | 2015 | Easy | Medium | Exemption form can only be obtained in person at the county or district health department |
| Michigan | 2015 | Medium | Difficult | New law requires parent or guardian to attend education session at health department before exemption waiver is granted |
We calculated nonmedical exemption rates using the number of exemptions reported per year by states in the numerator and dividing by the total number of reported enrolled kindergarteners per year, by state. We then stratified the sample by type of exemption allowed in states per year and ease of exemption category in states per year (Figure 1). For the 7 states that enacted new legislation in the study period, we changed ease and/or type of exemption category for subsequent years to reflect the provisions of the new law. We used t tests to compare mean nonmedical exemption rates between states by exemption type and policy.
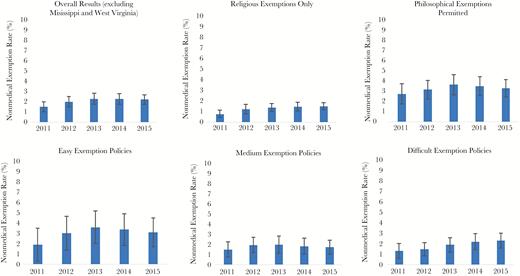
Overall means (and 95% confidence intervals) for the rate of nonmedical exemptions in the United States (excluding Mississippi and West Virginia, including the District of Columbia) by year from the 2011–2012 school year through the 2015–2016 school year, stratified by states that allow only religious exemptions, and by states that allow for both religious and philosophical exemptions, ease of exemption category.
Using generalized estimating equations, we created negative binomial regression models to estimate (1) the average annual change in nonmedical exemption rates and (2) relative differences in rates by state classification (ie, type of exemption allowed; difficulty of exemption policy). All estimates were generated as incidence rate ratios (IRRs), and they were computed for the full time period as well as stratified into 2 temporal periods of 2011–2012 through 2012–2013 school years and 2013–2014 through 2015–2016 school years. The models accounted for correlations among repeated state-level measures during the study period, with state used as the clustering term and assumed independence between states. In addition to unadjusted models, we generated models adjusted for potential confounding variables of income (10 categories), race (9 categories), education (5 categories), and population density. For adjusted models, data for all covariates for each state and year of this analysis came from the US Census Bureau [18–23]. All data analyses were conducted using SAS 9.4 (Cary, NC).
To estimate the average annual change in nonmedical exemption rates, we estimated the IRR considering school year as the primary predictor. Because we used state-level data in this analysis, institutional review board approval was not required.
RESULTS
Over the full study period, a total of 245 state-years were included in the analysis. From 2011–2012 through 2015–2016, 29 states and DC allowed for exemptions based on religious beliefs, and 19 states allowed for both exemptions based on religious beliefs and philosophical or personal belief reasons. During the study period, 8 states were classified as having easy exemption policies, 18 states were classified as having medium exemption policies, and 23 states were classified as having difficult exemption policies during at least 1 year of the analysis (Table 1). Over the course of the study period, 10 states enacted new legislative changes, leading to the states exemption policy to be reclassified. Of these 10 states, all but 1 enacted policy changes to make nonmedical exemptions harder to obtain.
From 2011–2012 through 2015–2016, the average nonmedical exemption rate increased to 2.04%, from the average of 1.58% reported in a similar analysis conducted in 2011 [4]. The nonmedical exemption rate in states allowing philosophical and religious exemptions was 2.41 times as high as in states allowing only religious exemptions (IRR = 2.41; 95% confidence interval [CI], 1.71–3.41). Although the overall average nonmedical exemption rate was higher for the states allowing philosophical exemptions than for the states allowing only religious exemptions (3.25% to 1.27%, respectively), the average annual rate increase for states allowing only religious exemptions (IRR = 1.20; 95% CI, 1.13–1.27) was higher than the average annual rate increase for states allowing religious and philosophical exemptions (IRR = 1.03; 95% CI, 1.00–1.08) (Table 1).
States classified as having an easy exemption policy had an overall average nonmedical exemption rate of 2.97%, compared to medium exemption policy states (1.77% nonmedical exemption rate) and difficult exemption policy states (1.84% nonmedical exemption rate). However, the differences in state-level nonmedical exemption rates by exemption ease were not significant (Table 1).
Although the overall nonmedical exemption rate was higher in the later years of the study period (2.25% during 2013–2014 through 2015–2016 compared to 1.75% during 2011–2012 through 2012–2013), the average annual change in exemption rates leveled off to a null change in the later years.
DISCUSSION
Our study shows an increase in nonmedical exemptions through the 2012–13 school year, which then plateaued. This is the first time since the late 1990s that we have seen such stabilization. There are many potential explanations as to why this leveling off has occurred, including considerable efforts by medical and public health authorities to address vaccine hesitancy and media attention focused on outbreaks of disease involving vaccine refusals and nonmedical exemptions. The slight increase between medium and difficult policy states could be attributed to the lag-time in enacting new laws to enforcing those laws on the school level. However, like other studies evaluating national phenomena, this study is not able to directly assess the specific factors that have affected changes in exemption rates. The risk of vaccine refusal and exemptions remains an important issue in many localities where much higher exemption rates are seen. These clusters of exemptions have been associated with outbreaks of pertussis and remain an important threat to the public’s health [7].
We found that states allowing philosophical and easy-to-obtain exemptions continue to be associated with higher rates of exemptions [3, 4, 24]. In the wake of the recent Disneyland measles outbreak, California eliminated all nonmedical exemptions. The impact of this policy, including its implementation, is not yet apparent, because it will take many years of data to evaluate postimplementation trends. The majority of states have not gone as far as to eliminate exemptions, because there is evidence pointing to successes in curbing nonmedical exemptions by restricting exemptions rather than fully eliminating them [3, 4]. Our study suggests that eliminating philosophical exemptions and making the exemption procedures more stringent may be useful policy approaches in states that are waiting to learn from the California experience of eliminating nonmedical exemptions or where such a policy approach is not politically feasible.
Although ours is the largest recent evaluation of national secular trends in nonmedical exemptions, there are a few limitations to our study. State exemption rates are based upon school reporting, and there is variability among states in how schools report exemption rates. For example, in the 2015–16 school year, 32 states collected data from all schools, 10 states used a random sample, 3 states relied on voluntary response, and 6 states relied on a mix of sampling methods to obtain exemption rates [15]. A breakdown of reporting for each state by year can be found in the yearly MMWR [11–15] report that details vaccine coverage among children in kindergarten across the United States, by school year. In some states, all schools report data and there are regular audits. Other states base their exemption rates on a random sample of schools. However, 74% of states estimate vaccine exemption rates using data from each school (and, therefore, from each child). The US Census Bureau data indicate that 86% of the US population resides in these states [25]. Therefore, we believe our overall results to be generalizable to the US population. As already mentioned, we are not able to quantitatively explore the causes for changes in exemption rates and most particularly the leveling off we have identified. However, our comparisons of exemption rates between states based upon the type of nonmedical exemption and administrative procedures for granting exemptions provides vaccine policy approaches that are associated with exemption rates.
CONCLUSIONS
Continued monitoring of exemption rates is critically important to ensure that the plateau in rates identified by our study is sustained. Improvements can also be made to within-state collection of exemption data to improve this surveillance system moving forward. States will be well served by enacting legislation that changes the balance of convenience in favor of vaccination and away from nonmedical exemptions [26].
Acknowledgments
Disclaimer. The funder had no role in the design and conduct of the study; collection, management, analysis, or interpretation of the data; or preparation, review, or approval of the manuscript.
Financial support. This work was funded in part by National Institutes of Health grant K01AI106961 (to R. A. B.).
Potential conflicts of interest. In the past, D. A. S. has served as a consultant for Merck and conducted sponsored research for Crucell and Pfizer. All authors have submitted the ICMJE Form for Disclosure of Potential Conflicts of Interest. Conflicts that the editors consider relevant to the content of the manuscript have been disclosed.
References


Comments