


Abstract
We conducted a retrospective analysis of 38 children and youth with human immunodeficiency virus (aged 0–19 years) in the United States and report an increased rate of change of BMI-for-age z score after initiating integrase strand transfer inhibitors (+0.19 z score units/year [95% confidence interval, .01–.37]; P = .036) for a median follow-up of 527.5 days.
Integrase strand transfer inhibitor (INSTI) use has become widespread for pediatric and adolescent antiretroviral treatment (ART). The INSTI dolutegravir (DTG) is recommended as the preferred first- and second-line antiretroviral drug by the World Health Organization (WHO) for adults and children with human immunodeficiency virus (HIV) [1, 2], following recent approval of DTG for infants and young children weighing ≥3 kg starting at 4 weeks of age [3].
Several large cohort studies in adults with HIV have shown that INSTI-based regimens, particularly with DTG, are associated with weight gain and metabolic complications [4–9], while other studies have shown no overall change in weight gain on INSTI-based regimens [10–12]. The mechanisms for weight gain for individuals on ART are likely multifactorial including ART regimen, sex, race, baseline HIV RNA viral load (VL) and CD4 cell count, inflammation, reduction in metabolic requirements, diet, and physical activity [13, 14].
To date, 2 studies have reported an increase in body mass index (BMI) in children and adolescents living with HIV up to 96 weeks after switching to DTG-based ART in Africa, Asia, and Europe [15, 16]. BMI-for-age z score (BMI relative to the population median BMI in z score units) [17] measures relative weight change adjusted for age and sex, and is the optimal tool to evaluate annual adiposity changes for children [18]. In this study, we examined individual BMI-for-age z score trajectories following initiation of an INSTI-based regimen in children and youth, defined as young persons living with HIV (YPHIV), within an observational clinical cohort in the United States (US).
METHODS
Study Population
The DC Cohort study is an observational longitudinal clinical cohort of persons with HIV who receive their HIV care within 15 clinics in Washington, District of Columbia [19]. The protocol was approved by the George Washington University Institutional Review Board (IRB number 071029), which serves as the IRB of record for the majority of the sites in the study.
For this retrospective analysis, data were collected between January 2011 and March 2019. YPHIV were included if they were aged 2–19 years at the time of INSTI initiation and initiated an INSTI-based regimen (raltegravir [RAL], elvitegravir [EVG], DTG, or bictegravir [BIC]) while enrolled in the cohort. YPHIV were included if they had ≥2 weights recorded ≥6 months apart within the 2 years both pre– and post–INSTI initiation. Weights were considered only if there was a height measurement within 6 months before the weight measurement.
Measures
“INSTI initiation” was defined as new prescription data for RAL, EVG, DTG, or BIC with no evidence of prior use of any INSTI. “Post-INSTI” describes the time after INSTI initiation while still receiving INSTIs. We used all available BMI-for-age z score measurements within 2 years pre–/post–INSTI initiation. The covariates of interest included age and BMI at INSTI initiation, sex, race/ethnicity, mode of HIV acquisition, most recent CD4 cell count and HIV VL within 6 months of INSTI initiation, smoking history, and current prescription for weight-influencing medication (including hormones, anti-lipemics, and appetite stimulants/suppressants).
Statistical Analysis
Descriptive statistics were summarized using median and interquartile range (IQR) for continuous variables, and frequency and percentage for categorical variables. We compared the slopes of BMI-for-age z score trajectories post– vs pre–INSTI initiation using piecewise linear mixed-effects models with an unstructured correlation matrix. The random effects in the model were a random intercept and the slopes pre– and post–INSTI initiation. We adjusted for BMI-for-age z score at INSTI initiation and all covariates listed in the “Measures” section. P values < .05 were considered statistically significant. Analyses were conducted using SAS version 9.4 software (SAS Institute, Cary, North Carolina).
RESULTS
Participant Characteristics
Table 1 describes the characteristics of the 38 participants who were included in this analysis. Participants had a median age of 15 (IQR, 11–16) years and the majority (61%) were 13–19 years of age. One-third of the participants were male (37%), and the majority were non-Hispanic black (95%) and had perinatally acquired HIV (92%). Only 1 participant was ART naive. At INSTI initiation, 42% of participants had an undetectable HIV VL and a median CD4 count of 697 (IQR, 503–862) cells/µL. More than half of the participants (55%) had a normal BMI (18.5–24.9 kg/m2) at INSTI initiation. Twenty-eight participants were initiated on DTG (74%), 7 on EVG (18%), 3 on RAL (8%), none on BIC, and 9 (24%) on tenofovir alafenamide fumarate (TAF). Two participants were on weight-influencing medications.
Characteristics of Participants Aged 2–19 Years Who Newly Initiated Integrase Strand Inhibitor–Based Regimens, January 2011 to March 2019 (N = 38)
| Characteristic | No. (%) |
|---|---|
| Demographic characteristics | |
| Age, y, median (IQR) | 15 (11–16) |
| Age category, y | |
| 2–12 | 15 (39) |
| 13–19 | 23 (61) |
| Male sex | 14 (37) |
| Non–Hispanic black | 36 (95) |
| HIV infection and ART characteristics | |
| Perinatally acquired HIV | 35 (92) |
| Undetectable HIV VL (<20 copies/mL) at INSTI initiation | 16 (42) |
| Nadir CD4 count, cells/µL, median (IQR) | 225 (54–376) |
| CD4 count at INSTI initiation, cells/µL, median (IQR) | 697.5 (503–862) |
| CD4 %, median (IQR) | 30.5 (19–34) |
| Follow-up time on INSTIs, d, median (IQR) | 527.5 (477–625) |
| Prior ART regimen | |
| PI based | 26 (68) |
| NNRTI based | 6 (16) |
| EFV | 3 (8) |
| NVP | 3 (8) |
| NRTI only | 4 (10) |
| NNRTI/PI based | 1 (3) |
| ART naive | 1 (3) |
| Initiated INSTI | |
| DTG | 28 (74) |
| EVG | 7 (18) |
| RAL | 3 (8) |
| Regimen with TAF | 9 (24) |
| Anthropometric characteristics | |
| Height, m, median (IQR) | 1.60 (1.52–1.65) |
| Height-for-age z score, median (IQR) | –0.50 (–1.21 to –0.05) |
| Weight, kg, median (IQR) | 57.61 (49.44–64.86) |
| Weight-for-age z score, median (IQR) | 0.41 (–0.47 to 1.11) |
| BMI-for-age z score, median (IQR) | 0.86 (–0.06 to 1.26) |
| BMI, kg/m2, median (IQR) | 22.68 (20.11–25.80) |
| BMI category, kg/m2 | |
| Underweight (<18.5) | 3 (8) |
| Normal (18.5–<24.9) | 21 (55) |
| Overweight (25–29.9) | 13 (34) |
| Obese (≥30) | 1 (3) |
| Prescription for weight-influencing medication | 2 (5) |
Data are presented as No. (%) unless otherwise indicated.
Abbreviations: ART, antiretroviral therapy; BMI, body mass index; DTG, dolutegravir; EFV, efavirenz; EVG, elvitegravir; HIV, human immunodeficiency virus; INSTI, integrase strand transfer inhibitor; IQR, interquartile range; NNRTI, nonnucleoside reverse transcriptase inhibitor; NRTI, nucleoside reverse transcriptase inhibitor; NVP, nevirapine; PI, protease inhibitor; RAL, raltegravir; TAF, tenofovir alafenamide fumarate; VL, viral load.
Trajectory of BMI-for-Age z Score Change Pre-/Post-INSTI
This analysis included 446 BMI-for-age z score measurements among 38 participants. The median follow-up time on INSTIs was 527.5 (IQR, 477–625) days. Adjusting for all covariates of interest, the mean rate of change in BMI-for-age z score was stable during the period pre–INSTI initiation (+0.02 z score units/year [95% confidence interval {CI}, –.09 to .13]; P = .72); however, mean BMI-for-age z score increased +0.21 z score units/year during the period post–INSTI initiation (95% CI, .08–.35, P = .0027; +0.15 z score units/year [95% CI, .0004–.31], P = .0049 excluding participants on TAF) (data not shown). The adjusted difference in the mean rate of change in BMI-for-age z score post– vs pre–INSTI initiation was +0.19 z score units/year (95% CI, .01–.37, P = .036; +0.14 z score units/year [95% CI, –.06 to .34], P = .17 excluding participants on TAF) (Figure 1). Preswitch regimen with a protease inhibitor (PI) or nonnucleoside reverse transcriptase inhibitor (NNRTI) was not associated with change in BMI (P ≤ .27).
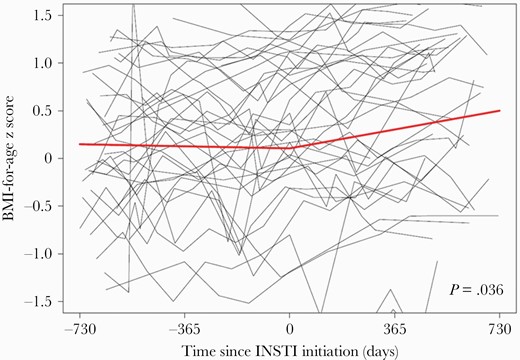
Spaghetti plot of all body mass index (BMI)–for-age z score measurements, with piecewise linear regression line, pre– and post–integrase strand transfer inhibitor (INSTI) initiation among DC Cohort participants aged 2–19 years (446 BMI-for-age z score measurements among 38 participants). The P value represents a test of a difference in slope between the 2 years pre– and post–INSTI initiation, adjusting for BMI at INSTI initiation, age at INSTI initiation, sex, race/ethnicity, mode of human immunodeficiency virus (HIV) acquisition, most recent CD4 count (cells/µL; time-updated), and most recent HIV viral load (time-updated), smoking status, and current prescription for weight-influencing medication (time-updated).
DISCUSSION
This study contributes to a knowledge gap regarding weight changes related to INSTI use in YPHIV and suggests that, similar to adults with HIV, predominantly treatment-experienced YPHIV have evidence of higher BMI-for-age z score trend following INSTI initiation. Despite this increased trajectory of BMI-for-age z score after INSTI initiation, the average BMI-for-age z score at the end of the study period was reassuringly between 0 and 1, where 1 is the cutoff used to categorize children at risk for being overweight by the WHO [20]. Additionally, differences in weight gain between ART regimens may be associated with a return-to-health phenomenon, seen in advanced HIV [7, 21, 22]. However, the increased BMI-for-age z score trajectory seen in treatment-experienced YPHIV post-INSTI was adjusted for multiple covariates including CD4 count and VL, and may not represent a mere return to health.
Although weight gain on ART may be beneficial, there might be a tipping point at which excessive weight is associated with negative health outcomes [14]. It has been well documented in large population studies that even slight BMI increases in childhood can be associated with cardiovascular disease and metabolic disease in adulthood [23, 24]. Our participants were predominantly black, a population that is disproportionately affected by cardiovascular disease [25]. Most YPHIV in this analysis had perinatally acquired HIV, and represent a population that may be at higher risk for INSTI-associated changes in BMI [10, 26]. Youth with perinatally acquired HIV are known to have higher rates of metabolic and vascular comorbidities compared to their uninfected peers, those with horizontally acquired HIV or HIV-exposed uninfected youth [27–29]. Despite adjusting our analysis for variables that are known to be associated with weight gain in adults with HIV including sex, race, baseline BMI, and smoking history [30–32], the persistent increase in BMI-for-age z score observed in YPHIV is concerning. Our study represents US children and youth who are already burdened by high rates of obesity and metabolic disease [33].
Data on randomized trials in YPHIV on INSTI in resource-limited settings are lacking; however, recent results from ODYSSEY, an open-label randomized clinical trial among YPHIV from predominantly African countries, suggested a slight but significant increase in BMI at week 96 among YPHIV on DTG-based ART compared to those on PI- or NNRTI-based ART [16]. In adults, history of being on PIs [34] and TAF [6, 35] has been associated with a higher risk of weight gain. After excluding participants on TAF, there was still a significant increase in BMI-for-age z score post–INSTI initiation. In future analyses, we plan to further examine the association between TAF-based regimens and BMI trajectory among YPHIV.
Our study had limitations. First, due to the small number of participants, we were underpowered to detect differences based on sex or race. We did not have information on medication adherence; however, we used VL as a surrogate marker. We were unable to adjust for sexual maturity, the type of weight gain (fat vs lean mass), and different regional fat distribution (truncal vs peripheral), as these measures were not collected. We did not have a control group of YPHIV with non-INSTI regimens due to limited number of YPHIV on non-INSTI regimens in the DC Cohort during the study period. However, our study showed similar trends in BMI-for-age z score to European and North American studies in children and youth living with HIV, which reported increased BMI-for-age z score after 2–4 years on ART, suggesting that our findings may be consistent with expected anthropometric changes in YPHIV receiving ART [36, 37]. Despite these limitations, a major strength of this study is the longitudinal cohort with reliable anthropometric data, which allowed us to evaluate BMI trajectory pre- and post-INSTI in YPHIV in the US.
CONCLUSIONS
Predominantly perinatally infected YPHIV in this US cohort had an increased trajectory of weight gain after initiating INSTIs compared to weight gain before INSTI initiation. The increased rate of change in BMI-for-age z score may be multifactorial, including use of INSTIs. This study highlights the importance of BMI monitoring in YPHIV and the need for better understanding of the implications of ART choice on BMI in YPHIV.
Notes
Acknowledgments. Data in this manuscript were collected by the DC Cohort Study Group with investigators and research staff located at Children’s National Hospital Adolescent (Lawrence D’Angelo) and Pediatric (Natella Rakhmanina) clinics; the Senior Deputy Director of the DC Department of Health HIV/AIDS, Hepatitis, STD and TB Administration (Michael Kharfen); Family and Medical Counseling Service (Michael Serlin); Georgetown University (Princy Kumar); The George Washington University Biostatistics Center (Aria Bamdad, Tsedenia Bezabeh, Pamela Katzen Burrows, Susan Reamer, Alla Sapozhnikova, Marinella Temprosa and Naji Younes); The George Washington University Department of Epidemiology (Morgan Byrne, Amanda Castel, Alan Greenberg, Maria Jaurretche, Matthew Levy, Anne Monroe, James Peterson, Lindsey Powers Happ, Brittany Wilbourn) and Department of Biostatistics and Bioinformatics (Yan Ma); The George Washington University Medical Faculty Associates (Hana Akselrod); Howard University Adult Infectious Disease Clinic (Ronald Wilcox) and Pediatric Clinic (Sohail Rana); Kaiser Permanente Mid-Atlantic States (Michael Horberg); La Clinica Del Pueblo (Ricardo Fernandez); MetroHealth (Annick Hebou); National Institutes of Health (Carl Dieffenbach, Henry Masur); Washington Health Institute, formerly Providence Hospital (Jose Bordon); Unity Health Care (Gebeyehu Teferi); Veterans Affairs Medical Center (Debra Benator); Washington Hospital Center (Maria Elena Ruiz); and Whitman-Walker Health (Stephen Abbott).
Author contributions. S. D.-F. and W. L. A. K. contributed equally to this manuscript. All authors have read, reviewed, edited, and approved the final manuscript. All authors contributed to the conceptualization and methodology of this study. S. D.-F. and W. L. A. K. developed the original draft of this paper. M. E. L. and P. K. analyzed the data for this study. N. Y. R. supervised the study.
Patient consent statement. All participants in this analysis provided written consent in order to be included in the DC Cohort, which is an observational longitudinal clinical cohort of persons with HIV who receive their HIV care within 15 clinics in Washington, DC.
Financial support. This work was supported by the National Institute of Allergy and Infectious Diseases (NIAID) (grant numbers 5UM1AI069503–14 and 1R24AI152598–01). This publication was facilitated in part by the infrastructure and services provided by the DC Center for AIDS Research, a National Institutes of Health (NIH)–funded program (grant number P30AI117970), which is supported by the following NIH Co–Funding and Participating Institutes and Centers: NIAID; National Cancer Institute; Eunice Kennedy Shriver National Institute of Child Health and Human Development; National Heart, Lung and Blood Institute; National Institute on Drug Abuse; National Institute of Mental Health; National Institute on Aging; Fogarty International Center; National Institute of General Medical Sciences; National Institute of Diabetes and Digestive and Kidney Diseases and Office of AIDS Research.
Potential conflicts of interest. All authors: No reported conflicts of interest.
All authors have submitted the ICMJE Form for Disclosure of Potential Conflicts of Interest. Conflicts that the editors consider relevant to the content of the manuscript have been disclosed.
References
US


Comments