


Abstract
No study has evaluated the relationship between contrast dispersion patterns and outcomes after fluoroscopically guided cervical transforaminal epidural steroid injection (CTFESI).
Determine whether contrast dispersion patterns predict pain and functional outcomes after CTFESI.
Secondary analysis of data collected during two prospective studies of CTFESI for the treatment of refractory radicular pain. Contrast dispersion patterns visualized by true anteroposterior (AP) projections during CTFESIs were categorized by flow: 1) completely external to the lateral border of the neuroforamen (zone 1); 2) within the neuroforamen but without entry into the lateral epidural space (zone 2); and 3) with extension into the lateral epidural space (zone 3). At baseline and at 1 month post-CTFESI, neck pain, arm pain, and “dominant index pain” (the greater of arm or neck pain) were evaluated using a numeric rating scale (NRS); physical function was assessed using the Five-Item Version of the Neck Disability Index (NDI-5).
One-month post-CTFESI, neck pain, arm pain, and “dominant index pain” reductions of ≥50% were observed in 39.4% (95% confidence interval [CI], 28.2–51.8), 55.6% (95% CI, 43.0–67.5), and 44.1% (95% CI, 32.7–56.2) of participants, respectively. Regarding “dominant index pain,” 72.7% (95% CI, 40.8–91.2), 39.4% (95% CI, 24.2–57.0), and 37.5% (95% CI, 20.5–58.2) of participants reported ≥50% pain reduction when zone 1, zone 2, and zone 3 contrast flow patterns were observed. Contrast dispersion zone was not significantly associated with subgroup differences in neck pain, arm pain, or NDI-5 scores (P>0.05).
Improvements in pain and function 1 month after treatment with CTFESI did not differ significantly based on the contrast dispersion pattern. Future study is needed to confirm or refute these findings in other procedural settings, in broader patient populations, and with longer-term outcome assessment.
Introduction
Cervical radiculopathy is a common and painful disorder, with an annual incidence between 18.6 and 58.5 per 100,000 persons depending on the etiologies considered [1, 2]. Cervical transforaminal epidural steroid injection (CTFESI) is an increasingly performed interventional procedure used to treat cervical radicular pain [3]. Between 2000 and 2011, the use of cervical and thoracic transforaminal epidural steroid injections increased 142% among Medicare beneficiaries [4]. During these same years, 13 cases of catastrophic neurologic injury and/or death emerged following CTFESI, most associated with the use of particulate corticosteroid [5]. Subsequent anatomic studies demonstrated variability of intraforaminal locations of anterior radicular and segmental medullary arteries [6, 7]. With mounting anatomic and safety data demonstrating the risks of particulate corticosteroid use during CTFESI, the U.S. Food and Drug Administration and the Multidisciplinary Working Group concluded that CTFESI should be performed with the use of contrast medium under live fluoroscopy and/or digital subtraction imaging (DSI) and should not include particulate corticosteroid [5].
Safe performance of fluoroscopically guided CTFESI necessitates both appropriate needle placement and use of live fluoroscopy or DSI [8, 9]. With needle placement targeted to the intervertebral depth at the sagittal midline of the articular pillar in an anterior–posterior view, one study detected intravascular uptake in 32.8% of injections [10]. Similarly, a recent computed tomography (CT)–based imaging study has suggested that between 13% and 40% of cervical neuroforamen have periforaminal vessels that are vulnerable to needle trespass during CTFESI [11]. A separate study of CT-guided CTFESI has suggested that an extraforaminal needle position may result in lower rates of intravascular injection, with only 10% uptake detected [12]. Regardless of the true frequency of intravascular injection at these locations, interventionalists should anticipate the need for needle tip repositioning if intravascular injection is detected.
Although many studies have focused on the safe performance of CTFESI with the use of appropriate imaging and contrast media [13, 14], no study to date has been published to evaluate the relationship between contrast dispersion patterns and outcomes after fluoroscopically guided CTFESI. A single study of CT-guided CTFESI has suggested that there may not be a difference in pain outcomes at 2 weeks between CTFESI with contrast dispersion in intraforaminal vs extraforaminal locations [15]. The present study was performed to investigate the relationship between contrast dispersion patterns during fluoroscopically guided CTFESI and associated pain reduction, functional improvement, analgesic medication use, and patient satisfaction.
Methods
Data were acquired from two prospective, institutional review board (IRB)–approved studies conducted at a single academic spine center [16]. Study data from consecutively enrolled patients who received CTFESI between January 18, 2018, and November 21, 2019, were reviewed.
Patient Population
These data originate from two separate prospective studies [16]. The common inclusion criteria were: 1) adult patients aged 18–80; 2) clinical diagnosis of unilateral C4–C8 radicular pain; 3) pathology on magnetic resonance imaging (MRI) consistent with clinical signs and symptoms; 4) pain score greater than 4 on the numeric rating scale (NRS); and 5) duration of pain longer than 6 weeks despite conservative care (including physical therapy, analgesic medications, or chiropractic care). Patients were excluded from participation for any of the following reasons: 1) prior epidural steroid injection within the last 6 months; 2) prior cervical spine surgery; 3) refusal to participate, provide consent, or provide follow-up information; 4) contraindications to treatment (active infection, bleeding disorders, allergy to medications used, or pregnancy); 5) cerebrovascular, demyelinating, or neuromuscular muscular disease; and 6) progressive motor deficit and/or signs of myelopathy.
Data Collection and Outcome Measures
Initial data extraction from study data was performed by Cole W. Cheney and later confirmed for accuracy and eligibility by Aaron Conger and Zachary L. McCormick. Data collected included 1) age; 2) body mass index (BMI); 3) sex; 4) level of injection; 5) baseline 3-day pre-injection average neck and arm NRS scores; 6) baseline Five-Item Version of the Neck Disability Index (NDI-5) scores; 7) 1-month 3-day average neck and arm NRS scores; and 8) 1-month NDI-5 scores. Treatment effect was measured using the NRS, NDI-5 [17], Medication Quantification Scale Version III (MQS-III), and Patient Global Impression of Change (PGIC) scale. The primary outcome was the proportion of participants in each group with ≥50% NRS reduction of “dominant index pain” (the greater of arm or neck pain) at 1 month. Secondary outcomes included the proportion of participants with ≥30% improvement on NDI-5 [18, 19], ≥50% arm NRS reduction, ≥50% neck NRS reduction, PGIC scores of 6–7 (indicating “much improved” or “very much improved”), and MQS-III score reduction of at least 6.8 (equal to 10 morphine equivalents) [20]. Participants who received cervical spine surgery or who were lost to follow-up were considered nonresponders. The associations between different patterns of contrast dispersion and treatment success (as defined previously) were examined through calculation of odds ratios (ORs).
Radiographic Evaluation
Two senior authors (Zachary L. McCormick and Richard Kendall) evaluated fluoroscopic images of all participants in the data set. Contrast dispersion patterns visualized by true anterior–posterior projections during CTFESI were categorized by flow that was either completely external to the lateral border of the neuroforamen (zone 1), within the neuroforamen but without entry into the lateral epidural space (zone 2), or with extension into the lateral epidural space (zone 3) (Figure 1). The evaluators first independently graded the contrast dispersion patterns and then resolved any disagreement by consensus discussion.
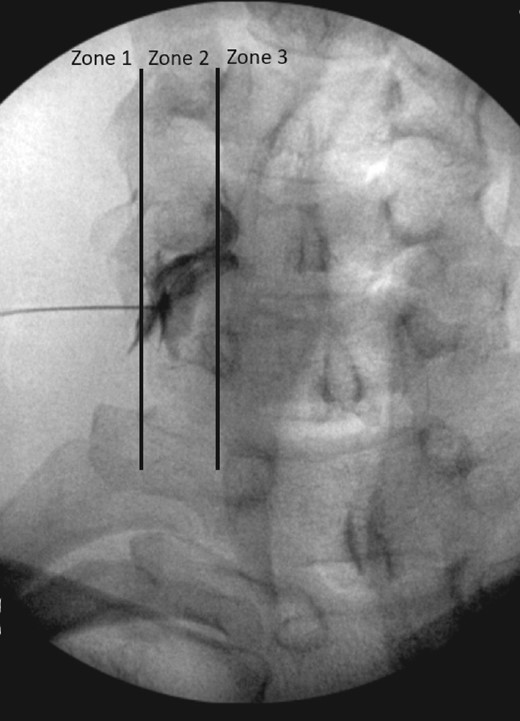
Contrast dispersion patterns characterized by flow that was external to the lateral border of the neuroforamen (zone 1), within the neuroforamen but with entry into the lateral recess (zone 2), or with extension into the lateral recess (zone 3).
Procedures
All CTFESI procedures were performed by three physical medicine and rehabilitation physicians with fellowship training and subspecialty board certification in either pain medicine or sports medicine. After the patient was positioned supine or side-lying on a fluoroscopy table, a blood pressure monitor and pulse oximetry monitor were placed to measure the patient’s vital signs. Betadine or chlorhexidine was used to sterilize the cervical spine region prior to draping in a sterile manner. After administration of 1–2 mL of 1% lidocaine to anesthetize the skin, a 25-gauge spinal needle was advanced to the appropriate neuroforamen under fluoroscopic guidance according to practice guidelines [21]. After the target position was achieved and confirmed in both the oblique and anterior–posterior views, 1 mL of contrast (Omnipaque-240, GE Healthcare, Princeton, NJ) was injected under live fluoroscopic observation followed by DSI to evaluate for vascular uptake and to confirm position per established practice guidelines [21]. Upon confirmed exclusion of vascular uptake, the injectate was delivered: dexamethasone sodium phosphate 1 mL (10 mg/mL) and 0.5–1.0 mL of 1–2% preservative-free lidocaine (total volume 1.5–2.0 mL).
Statistical Analysis
Descriptive statistics were calculated for participants’ demographic and clinical characteristics, including dominant NRS pain score, neck NRS pain score, arm NRS pain score, NDI-5 score, and MQS-III score. PGIC was measured only at a 1-month follow-up. Fisher’s exact tests (for categorical variables) and one-way analysis of variance (for continuous variables) were used to compare the aforementioned variables using different contrast dispersion patterns (zones 1–3). Contingency table analysis was conducted to examine the associations between contrast dispersion zones and dichotomous outcome variables, including ≥50% reduction in dominant NRS score from baseline to a 1-month follow-up, ≥50% reduction in neck NRS score from baseline to a 1-month follow-up, ≥50% reduction in arm NRS score from baseline to a 1-month follow-up, ≥30% reduction in NDI-5 score from baseline to a 1-month follow-up, ≥6.8 reduction in MQS-III score from baseline to a 1-month follow-up, and 6 or 7 in PGIC at a 1-month follow-up. If participants underwent surgery during the study or were lost to follow-up, they were considered a treatment failure and were assigned “no” to all the dichotomous outcome variables. A 95% confidence interval (CI) was calculated for the percentages of these dichotomous outcome variables. Further, logistic regression models were fit to the dichotomous outcome variables, with contrast dispersal zone as a predictor. An OR with 95% CI and a predicted probability by each dispersal zone were calculated in the models. Another series of logistic regression models were examined, including age, sex, and BMI as covariates. Lastly, tornado plot diagrams were constructed to visualize the percentage changes in the dominant NRS scores and NDI-5 score at a 1-month follow-up for each individual study participant.
Results
A total of 483 patients were screened for eligibility for the two studies from which these data originated. Ultimately, 68 patients (62% female; mean age, 51.8 ± 12.8, mean BMI, 28.9 ± 6.1) were analyzed in the study; details are shown in Figure 2. Participants’ baseline demographic and clinical characteristics are shown in Table 1. There were no significant between-group baseline differences with regard to any demographic or clinical characteristic when stratified by contrast dispersion pattern (P>0.05). All outcomes were measured at 1 month after injection. Overall, 44.1% (95% CI, 32.7–56.2), 39.4% (95% CI, 28.2–51.8), and 55.6% (95% CI, 43.0–67.5) of the participants experienced ≥50% reduction in dominant, neck, and arm NRS pain scores, respectively. Further, 55.2% (95% CI, 43.0–66.8) of participants experienced ≥30% reduction in NDI-5 scores, and 16.2% (95% CI, 9.1–27.1) demonstrated a ≥6.8-point reduction in the MQS-III score. Lastly, 51.6% (95% CI, 39.2–63.7) of the participants reported a PGIC score of 6 or 7, indicating that their pain was at least “much improved.”
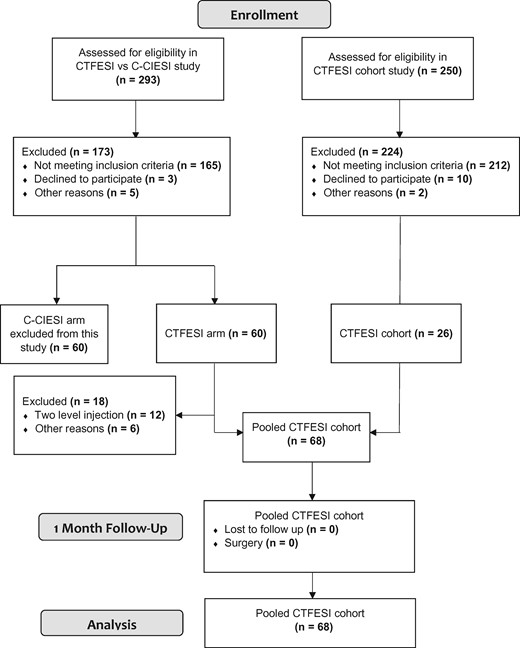
Study flow diagram.
Baseline participant demographic and clinical characteristics
| Variable | Zone 1 (n = 11) | Zone 2 (n = 33) | Zone 3 (n = 24) | P |
|---|---|---|---|---|
| Gender | ||||
| Male | 2 (18.2) | 13 (39.4) | 11 (45.8) | 0.296* |
| Female | 9 (81.8) | 20 (60.6) | 13 (54.2) | |
| Radicular pain level | ||||
| C4 | 2 (18.2) | 0 (0.0) | 0 (0.0) | 0.077* |
| C5 | 1 (9.1) | 8 (24.2) | 1 (4.4) | |
| C6 | 5 (45.4) | 16 (48.5) | 13 (56.5) | |
| C7 | 3 (27.3) | 9 (27.3) | 9 (39.1) | |
| Dominant pain† | ||||
| Neck predominant | 5 (45.4) | 9 (27.3) | 11 (45.8) | 0.470* |
| Arm predominant | 4 (36.4) | 10 (30.3) | 6 (25.0) | |
| Equal | 2 (18.2) | 14 (42.4) | 7 (29.2) | |
| Age in years, mean (SD) | 55.1 (10.7) | 51.5 (13.0) | 50.7 (13.5) | 0.639‡ |
| Body mass index in kg/m2, mean (SD) | 29.4 (5.3) | 29.6 (7.0) | 27.7 (5.1) | 0.494‡ |
| Dominant NRS at baseline, mean (SD) | 5.5 (2.1) | 6.4 (2.1) | 6.4 (2.1) | 0.481‡ |
| Neck NRS at baseline, mean (SD) | 4.5 (2.7) | 5.3 (2.6) | 5.1 (2.2) | 0.636‡ |
| Arm NRS baseline, mean (SD) | 4.5 (2.5) | 5.5 (2.6) | 4.7 (3.3) | 0.416‡ |
| NDI-5 at baseline, mean (SD) | 7.1 (4.8) | 8.8 (3.8) | 8.5 (2.7) | 0.380‡ |
| MQS-III at baseline, mean (SD) | 6.5 (3.6) | 5.2 (4.4) | 4.8 (6.4) | 0.685‡ |
SD = standard deviation; NRS = numeric rating scale; NDI-5 = Five-Item Version of the Neck Disability Index; MQS-III = Medication Quantification Scale Version III.
N = 68.
Values are frequency (%) unless specified otherwise.
From Fisher’s exact test.
“Dominant” pain: the greater of arm or neck NRS score.
From one-way analysis of variance.
Figures 3(A) and 3(B) show the individual participant responses for “dominant” NRS pain score reduction and functional improvement measured by the NDI-5 score. Tables 2–7 summarize the results of the contingency table analysis. Improvement in “dominant” NRS pain scores was not significantly different between groups at 1 month; for zones 1, 2, and 3, 72.7% (95% CI, 40.8–91.2), 39.4% (95% CI, 24.2–57.0), and 37.5% (95% CI, 20.5–58.2) of the participants achieved ≥50% reduction in “dominant” pain (P>0.05), respectively. Similarly, success rates for neck pain reduction, arm pain reduction, medication use, functional improvement, and PGIC were not related to the observed zone of contrast spread (P>0.05).
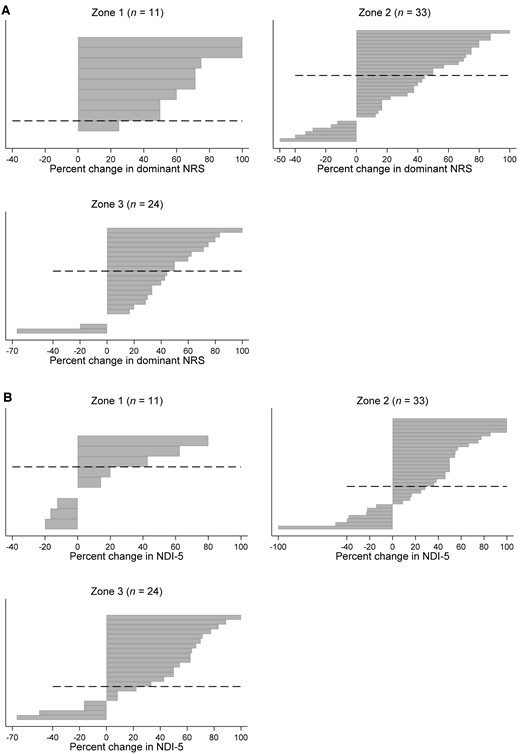
(A) Tornado diagram for different zones of contrast dispersion. Each bar represents an individual participant. Percentage change in “dominant” NRS score (the greater of arm or neck pain) is shown on the x-axis by zone of contrast dispersion at 1-month follow-up. *No change in pain score; zone 1, n = 2, zone 2, n = 2, zone 3, n = 2. (B) Tornado diagram for different zones of contrast dispersion. Each bar represents an individual participant. Percentage change in NDI-5 score is shown on the x-axis by zone of contrast dispersion at 1-month follow-up. *No change in NDI-5 score; zone 1, n = 2, zone 2, n = 1, zone 3, n = 2. †One patient in the zone 2 group had a percent negative change of greater than 100 (not shown in the diagram). NRS = numeric rating scale; NDI-5 = Five-Item Version of the Neck Disability Index.
Greater than or equal to 50% reduction in dominant numeric rating scale (NRS) score by zone of contrast dispersion
| ≥50% Reduction in Dominant NRS Score | |||
|---|---|---|---|
| Yes | No | P | |
| Zone 1 | 8 (72.7) | 3 (27.3) | 0.125* |
| Zone 2 | 13 (39.4) | 20 (60.6) | |
| Zone 3 | 9 (37.5) | 15 (62.5) | |
| ≥50% Reduction in Dominant NRS Score | |||
|---|---|---|---|
| Yes | No | P | |
| Zone 1 | 8 (72.7) | 3 (27.3) | 0.125* |
| Zone 2 | 13 (39.4) | 20 (60.6) | |
| Zone 3 | 9 (37.5) | 15 (62.5) | |
Values are frequency (%).
P values from Fisher’s exact tests.
Greater than or equal to 50% reduction in neck numeric rating scale (NRS) score by zone of contrast dispersion
| ≥50% Reduction in Neck NRS Score | |||
|---|---|---|---|
| Yes | No | P | |
| Zone 1 | 5 (50.0) | 5 (50.0) | 0.742* |
| Zone 2 | 12 (36.4) | 21 (63.6) | |
| Zone 3 | 9 (39.1) | 14 (60.9) | |
| ≥50% Reduction in Neck NRS Score | |||
|---|---|---|---|
| Yes | No | P | |
| Zone 1 | 5 (50.0) | 5 (50.0) | 0.742* |
| Zone 2 | 12 (36.4) | 21 (63.6) | |
| Zone 3 | 9 (39.1) | 14 (60.9) | |
Values are frequency (%).
P values from Fisher’s exact tests.
Greater than or equal to 50% reduction in arm numeric rating scale (NRS) score by zone of contrast dispersion
| ≥50% Reduction in Arm NRS Score | |||
|---|---|---|---|
| Yes | No | P | |
| Zone 1 | 8 (72.7) | 3 (27.3) | 0.438* |
| Zone 2 | 16 (50.0) | 16 (50.0) | |
| Zone 3 | 11 (55.0) | 9 (45.0) | |
| ≥50% Reduction in Arm NRS Score | |||
|---|---|---|---|
| Yes | No | P | |
| Zone 1 | 8 (72.7) | 3 (27.3) | 0.438* |
| Zone 2 | 16 (50.0) | 16 (50.0) | |
| Zone 3 | 11 (55.0) | 9 (45.0) | |
Values are frequency (%).
P values from Fisher’s exact tests.
Greater than or equal to 30% reduction in Five-Item Version of the Neck Disability Index (NDI-5) score by zone of contrast dispersion
| ≥30% Reduction in NDI-5 Score | |||
|---|---|---|---|
| Yes | No | P | |
| Zone 1 | 3 (30.0) | 7 (70.0) | 0.212* |
| Zone 2 | 19 (57.6) | 14 (42.4) | |
| Zone 3 | 15 (62.5) | 9 (37.5) | |
| ≥30% Reduction in NDI-5 Score | |||
|---|---|---|---|
| Yes | No | P | |
| Zone 1 | 3 (30.0) | 7 (70.0) | 0.212* |
| Zone 2 | 19 (57.6) | 14 (42.4) | |
| Zone 3 | 15 (62.5) | 9 (37.5) | |
Values are frequency (%).
P values from Fisher’s exact tests.
Greater than or equal to 6.8-point reduction in Medication Quantification Scale Version III (MQS-III) score by zone of contrast dispersion
| ≥6.8-point reduction in MQS-III Score | |||
|---|---|---|---|
| Yes | No | P | |
| Zone 1 | 2 (18.2) | 9 (81.8) | 0.449* |
| Zone 2 | 7 (21.2) | 26 (78.8) | |
| Zone 3 | 2 (8.3) | 22 (91.7) | |
| ≥6.8-point reduction in MQS-III Score | |||
|---|---|---|---|
| Yes | No | P | |
| Zone 1 | 2 (18.2) | 9 (81.8) | 0.449* |
| Zone 2 | 7 (21.2) | 26 (78.8) | |
| Zone 3 | 2 (8.3) | 22 (91.7) | |
Values are frequency (%).
On the MQS-III, 6.8 points is equal to 10 morphine equivalents.
P values from Fisher’s exact tests.
Patient Global Impression of Change (PGIC) score of 6 or 7 by zone of contrast dispersion
| PGIC Score (6 or 7) | |||
|---|---|---|---|
| Yes | No | P | |
| Zone 1 | 5 (50.0) | 5 (50.0) | 0.391* |
| Zone 2 | 14 (43.8) | 18 (56.2) | |
| Zone 3 | 14 (63.6) | 31 (48.4) | |
| PGIC Score (6 or 7) | |||
|---|---|---|---|
| Yes | No | P | |
| Zone 1 | 5 (50.0) | 5 (50.0) | 0.391* |
| Zone 2 | 14 (43.8) | 18 (56.2) | |
| Zone 3 | 14 (63.6) | 31 (48.4) | |
Values are frequency (%).
PGIC scores of 6–7 indicate that the pain is at least “much improved.”
P values from Fisher’s exact tests.
The logistic regression models showed that the zone of contrast dispersion was not significantly associated with any dichotomous outcome variable (P>0.05; Table 8; Figures 4(A)–4(F)). The odds of achieving ≥50% reduction in the “dominant” NRS pain score were lower for zone 2 and zone 3 compared with zone 1, although this did not reach statistical significance (zone 2: OR = 0.24; 95% CI, 0.05–1.09; P = 0.065; zone 3: OR = 0.23; 95% CI, 0.05–1.07; P = 0.061).
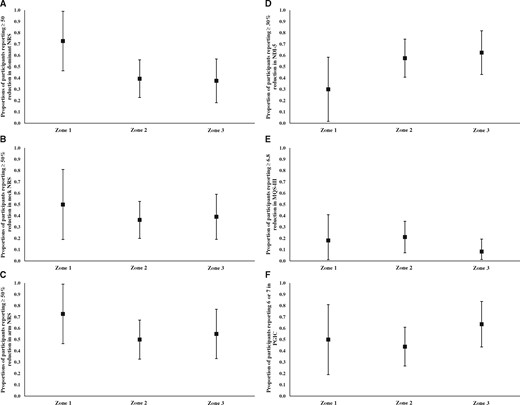
(A) Proportions of participants reporting ≥50% reduction in “dominant” NRS score (the greater of arm or neck pain) by zone of contrast dispersion calculated from logistic regression model. Whiskers represent 95% confidence intervals around the proportion represented by the square. (B) Proportions of participants reporting ≥50% reduction in neck NRS score by zone of contrast dispersion calculated from logistic regression model. Whiskers represent 95% confidence intervals around the proportion represented by the square. (C) Proportions of participants reporting ≥50% reduction in arm NRS by zone of contrast dispersion calculated from logistic regression model. Whiskers represent 95% confidence intervals around the proportion represented by the square. (D) Proportions of participants reporting ≥30% reduction in NDI-5 score by zone of contrast dispersion calculated from logistic regression model. Whiskers represent 95% confidence intervals around the proportion represented by the square. (E) Proportions of participants reporting ≥6.8-point reduction in MQS-III score by zone of contrast dispersion calculated from logistic regression model. Whiskers represent 95% confidence intervals around the proportion represented by the square. A 6.8-point reduction in MQS-III score is equal to 10 daily morphine equivalents. (F) Proportions of participants reporting 6 or 7 (“much improved” or “very much improved”) in PGIC by zone of contrast dispersion calculated from logistic regression model. Whiskers represent 95% confidence intervals around the proportion represented by the square. NRS = numeric rating scale; NDI-5 = Five-Item Version of the Neck Disability Index; MQS-III = Medication Quantification Scale Version III; PGIC = Patient Global Impression of Change.
Logistic regression model for dichotomous outcome variables
| Outcome Variable | Predictor | OR | 95% CI | P | |
|---|---|---|---|---|---|
| ≥50% reduction in dominant NRS | Zone (reference = 1) | Zone 2 | 0.24 | 0.05–1.09 | 0.065 |
| Zone 3 | 0.23 | 0.05–1.07 | 0.061 | ||
| ≥50% reduction in neck NRS | Zone (reference = 1) | Zone 2 | 0.57 | 0.14–2.38 | 0.442 |
| Zone 3 | 0.64 | 0.14–2.87 | 0.563 | ||
| ≥50% reduction in arm NRS | Zone (reference = 1) | Zone 2 | 0.38 | 0.08–1.68 | 0.199 |
| Zone 3 | 0.46 | 0.09–2.25 | 0.337 | ||
| ≥30% reduction in NDI-5 | Zone (reference = 1) | Zone 2 | 3.17 | 0.69–14.46 | 0.137 |
| Zone 3 | 3.89 | 0.80–18.97 | 0.093 | ||
| ≥6.8-point reduction in MQS-III | Zone (reference = 1) | Zone 2 | 1.21 | 0.21–6.94 | 0.829 |
| Zone 3 | 0.41 | 0.05–3.37 | 0.406 | ||
| PGIC (6 or 7) | Zone (reference = 1) | Zone 2 | 0.78 | 0.19–3.23 | 0.729 |
| Zone 3 | 1.75 | 0.39–7.95 | 0.469 | ||
OR = odds ratio; CI = confidence interval; NRS = numeric rating scale; NDI-5 = Five-Item Version of the Neck Disability Index; MQS-III = Medication Quantification Scale Version III; PGIC = Patient Global Impression of Change.
On the MQS-III, 6.8 points is equal to 10 morphine equivalents.
PGIC scores of 6–7 indicate that the pain is at least “much improved.”
There were no serious adverse effects or complications related to CTFESI.
Discussion
This study reports the first described associations between the observed contrast flow pattern during fluoroscopically guided CTFESI for the treatment of cervical radicular pain and short-term treatment outcomes. We observed similar results for pain relief, functional improvement, and analgesic use after CTFESI regardless of contrast dispersion pattern. There was a trend toward greater pain reduction in participants whose contrast dispersion pattern was located external to the lateral border of the neuroforamen (zone 1), but this did not reach statistical significance. This trend was not seen in NDI-5 scores, MQS-III scores, or patient-perceived improvement measured by PGIC.
There are several biologically plausible explanations for these somewhat surprising findings. Variable degrees of foraminal vs canal stenosis might influence how patients responded to injectate delivered to these different areas. For example, a patient with severe neuroforaminal stenosis may have responded better to zone 1 injectate dispersion, whereas a patient with a central-to-lateral disc extrusion may have fared better with corticosteroid concentrated in zone 3. Although patients in the present study were strictly selected based on clinical signs and symptoms of single-level radiculopathy, those with a component of adjacent-level radicular pain might have experienced analgesia secondary to reflux of injectate onto the brachial plexus after observed zone 1 contrast dispersion. We must also consider the possibility that observed contrast dispersion may not accurately estimate the extent of injectate diffusion—for example, injectate delivered to zone 1 that ultimately spreads proximally into zone 2 or zone 3. Alternatively, assuming that contrast dispersion is a reasonably accurate surrogate for injectate placement, then we must also consider the possibility that location is less important than previously thought.
Apart from the results of contrast zone analysis, the overall success rate seen in this study provides further evidence for the effectiveness of CTFESI. The evidence base for fluoroscopically guided CTFESI is based largely on multiple single-group cohort studies. A recently published systematic review and meta-analysis suggested that approximately 64% of patients may experience ≥50% pain reduction for at least 3 months after CTFESI with nonparticulate steroid [14]. In the present study, 56% of participants experienced >50% arm pain reduction, with lower proportions reporting significant neck pain relief. Although the success rate in this study was slightly lower, it represents a conservative estimate, as participants who were lost to follow-up or who underwent surgery were considered nonresponders in the analysis. The prespecified threshold for a clinically important reduction in analgesic medication use (>6.8-point reduction on the MQS-III scale) was met in only 16% of participants. This is likely because baseline MQS-III scores were between 4.8 and 6.5 on average in the three groups, and therefore achieving a 6.8-point reduction was not possible for many participants.
Although studies have been performed in the lumbar spine to investigate the prognostic value of different contrast patterns [22–25], little has been published on the association of CTFESI contrast dispersion patterns and treatment success in the cervical spine. Park and Lee [15] described outcomes of 67 patients with cervical radicular pain undergoing CT-guided CTFESI stratified by contrast dispersion into either an intraforaminal or extraforaminal location. These categories were delineated by drawing an oblique line from the anterolateral vertebral body to the lateral margin of the facet, dividing the foraminal and extraforaminal space. At 2 weeks, treatment success did not differ based on contrast pattern: 56% (95% CI, 42–70) compared with 53% (95% CI, 29–77) experienced significant pain relief in the extraforaminal vs intraforaminal groups, respectively. This is an indirect comparison to fluoroscopic epidurography, but these results, taken with the findings of the present study, suggest that needle repositioning to achieve a particular contrast dispersal pattern may not be necessary for treatment success. Hypothetically, this could lead to less patient discomfort through less needle manipulation, decreased patient and provider radiation exposure, and increased procedural efficiency and could possibly decrease the rate of inadvertent injection into the vertebral artery. Further studies are needed to investigate these possibilities and to confirm or refute the findings of the present study prior to consideration of implementation in routine practice.
This study has several strengths. The zones of contrast dispersion are based on readily identifiable bony landmarks that all appropriately trained spine interventionalists should be able to identify. The described associations are based on high-fidelity data from two prospective studies with appropriate patient selection, strict technical performance of CTFESI, robust outcome measurement, and low rates of attrition. Some limitations must be recognized. Strictly speaking, the results of this study cannot establish causation due to its observational nature. However, because random assignment to a particular flow pattern is impractical, if not impossible, the results of this study provide us with the best estimate of any true relationship between contrast dispersion and treatment success. This study describes the associations between contrast dispersal and outcomes at 1 month. Short-term outcome assessment was chosen out of a desire to examine consecutive patients without excluding for multiple injections in order to reduce the risk of confounding from repeated CTFESI. The results of this study are based on the experience of providers from a single academic center in a strictly selected research population (only 15% of patients were ultimately eligible for this study). Prior to widespread acceptance, these results should be replicated in other procedural settings, in less strictly selected patients, and with longer-term outcome assessment.
Lastly, we caution the reader to appropriately interpret the findings of this study within the context of the statistical uncertainty associated with the results and with all effect and association estimates. Sweeping, absolute claims based on “significant” P values and CIs have frequently led to incorrect assumptions about the results of studies [26–28]. Similarly, a large effect size with a “nonsignificant” P value or wide CI should not be ignored. Therefore, we cautiously present these findings with the disclaimer that future study will be required to confirm or refute these observations.
Conclusions
The present data demonstrate similar rates of improvement in patients with cervical radicular pain, across multiple outcome domains, regardless of the contrast dispersion pattern. Future study is needed to confirm or refute these findings in other procedural settings, in broader patient populations, and with longer-term outcome assessment.
Acknowledgments
The authors wish to thank Marilou Oh, PA-C, Eric Leach, PA-C, and Sara McEvoy, PA-C, for their assistance with patient treatment and clinical follow-up.
Funding sources: There were no direct sources of funding for this secondary analysis. The data originated from an ongoing study funded by the Spine Intervention Society and from a separate study funded by Epimed International. All research funds were paid directly to the first and last authors’ institution, and neither study provided any financial support to the study investigators.
Conflicts of interest and disclosure: Zachary L. McCormick, MD, serves on the Board of Directors of the Spine Intervention Society. There are no other potential conflicts of interest to disclose on the part of any of the other authors.
