


Abstract
Indigenous populations are disproportionately affected by kidney failure at younger ages than other ethnic groups in Canada. As symptoms do not occur until disease is advanced, early kidney disease risk is often unrecognized.
We sought to evaluate the yield of community-based screening for early risk factors for kidney disease in youth from rural Indigenous communities in Canada.
The FINISHED project screened 11 rural First Nations communities in Manitoba, Canada after community and school engagement. The results for the 10- to 17-year olds are reported here. Body mass index (BMI), blood pressure, estimated glomerular filtration rate (eGFR), hemoglobin A1c’s (HbA1c) and urine albumin-to-creatinine ratios (ACR) were assessed. All children were triaged and referred to either primary or tertiary care, depending on risk.
A total of 353 were screened (estimated 22.4% of population). The median age was 12 years (IQR 10 to 13), 55% were female and 55% were overweight or obese. Overall, 21.8% of children had at least one abnormality. Hypertension was identified in 5.4% and 11.9% had prehypertension. None of the children had an eGFR < 60 ml/min/1.73 m2 however 10.5% had an ACR > 3 mg/mmol and 6.2% had an eGFR < 90 ml/min/1.73 m2 suggestive of early kidney disease. Diabetes was identified in 1.4%, and 1.4% had HbA1c’s between 6.1% and 6.49%.
Risk factors for chronic kidney disease are highly prevalent in rural Indigenous children. More research is required to confirm the persistence of these findings, and to evaluate the efficacy of screening children to prevent or delay progression to kidney failure.
Chronic kidney disease (CKD) is well known to disproportionately affect Indigenous populations around the world (1,2). Rates of CKD are two- to threefold higher in adults of Indigenous ethnicity (3), with three- to fourfold higher rates of progression to kidney failure (4,5). Adults are on average 8 years younger when they require dialysis than non-Indigenous populations in Canada (6). Compounding the health problem is the geographic isolation of many Indigenous people, and the inequities that exist with respect to access to primary and specialty care services (7,8). Early disease that has the potential to be modified with evidence-based chronic disease management (9–11) can go undiagnosed until disease has progressed. Screening is a potential strategy to breakdown jurisdictional barriers and improve health outcomes in rural First Nations populations (12).
Although kidney failure is a rare disease in children, higher rates have been identified in Canadian Indigenous children than in other ethnicities (13). Rates of earlier stages of CKD are however unknown, as population-based screening studies in Indigenous children in North America have never been published. Therefore, the timing of risk factor development, and the overall prevalence of CKD in Indigenous children in North America in fact remains unknown. What is known however is that risk factors for CKD, such as obesity (14), hypertension (15) and type 2 diabetes (16,17) are becoming increasingly common in children, with a predominance in Indigenous youth (16). Immune-mediated diseases are an additional risk factor for CKD that are also more common in Indigenous populations (13).
As children live longer than adults, they have a much higher total lifetime probability for developing kidney failure because of early onset obesity, hypertension and diabetes (18,19). Early identification with screening, tied to a treatment intervention has the potential for significant benefit. However, prior to evaluating the efficacy of screening in youth in preventing kidney failure, an understanding of the true burden of disease risk is required. We therefore sought to determine the yield of community based screening for chronic disease risk factors in Indigenous youth from the FINISHED (First Nations Community Based Screening to Improve Kidney Health and Prevent Dialysis) project.
METHODS
The project methods have been previously described in detail (20). In brief, this project was approved by the Health Research Ethics Board at the University of Manitoba (HS16070), as well as the Diabetes Integration Project Board of Directors, relevant Tribal Council Leaders, and the local governments of each participating community. Every effort was made to ensure communities were comfortable with study protocols, and that OCAP (Ownership, Control, Access and Possession) principles were followed.
Study Design (Screen, Triage and Treat Program)
This study had a cross sectional cohort design. Screening took place at nursing stations, community centres and schools in seven communities with road access, and four remote communities. All members ages 10 to 80 years were invited to participate. To avoid any stigma associated with screening, there were no exclusion criteria. The results for children aged 10 to 17 years are reported here.
A community engagement approach was utilized in eight communities and an additional targeted school engagement in three communities. Written informed consent by the legal guardian, as well as assent by the child was obtained.
Procedures
Screening included collection of the following:
Demographics: age, sex and community of residence (deidentified to respect community privacy).
Clinical data: height, weight, body mass index and blood pressure. A mean of six blood pressures were taken according to practices outlined by the Canadian Hypertension Education Program (CHEP) using the BPTru Medical Device (Coquitlam, BC).
Laboratory values using point of care testing: serum creatinine to calculate an estimated glomerular filtration rate (eGFR using the CKiD Schwartz equation (21), hemoglobin A1C (HbA1C), and a urine albumin:creatinine ratio (ACR). Details of quality control of diagnostic tests were previously published (20). Serum creatinine was measured using the Piccolo Xpress© (Abaxis, Union City, CA) with daily quality assurance performed by Canadian External Quality Assurance Laboratories (CEQAL) to ensure IDMS traceability. HbA1C and urine ACR were analyzed using the DCA Vantage Analyzer© (Siemens, Erlangen, Germany).
Outcome Definitions
Abnormal kidney function = eGFR < 90 ml/min/1.73 m2 and/or albuminuria = urine ACR ≥ 3 mg/mmol. Prehypertension = average blood pressure > 90th%ile and hypertension ≥ 95th%ile for age, sex and height (22). Diabetes = HbA1c ≥ 6.5 and prediabetes = 6.1–6.49 (23). Overweight = BMI >+1 standard deviation (SD) for age and sex, and obesity = BMI >+2SD (24).
Algorithms were developed to stratify youth by risk category for the purposes of triage to treatment (Figure 1). Children were stratified based on their most abnormal tests. For example, if they met any high-risk criteria they were categorized at high risk. Evidence-based thresholds for each clinical parameter were based on K-DIGO (25) and Canadian Diabetes Association (26) guidelines. Automated referrals to Paediatric Nephrology were made for intermediate and high-risk youth. Children with HbA1c’s ≥6.5% were referred to Paediatric Endocrinology (27). Low-risk youth were referred to their primary care provider for further evaluation and care. A treatment recommendation protocol was provided, which included recommended additional workup and thresholds for referrals back to subspecialty care.
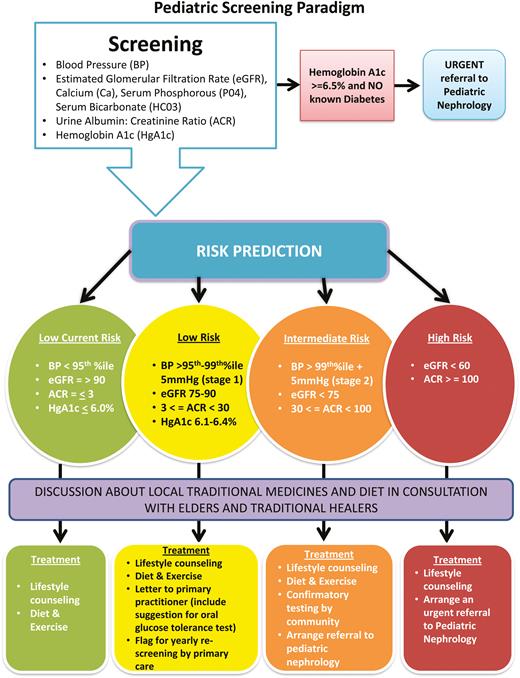
Screening Algorithm for 10–17-year olds.
Data analysis
Screening rates were analyzed by community and by road access versus remote (lack of year-round road access to the community). Screening site and engagement strategy (general versus targeted school engagement) are also presented. The prevalence of each risk factor in the screened cohort was determined utilizing the publicly available registered population for each community (28).
Summary statistics were expressed as mean ± SD for normally distributed continuous, median and interquartile range for non-normally distributed, and percentages for categorical variables.
Categorical variables were compared using Chi-square and Fisher’s Exact statistics and continuous variables using the unpaired t-test or ANOVA for normally distributed variables or Mann–Whitney U-test (Wilcoxon rank-sum test) and Kruskal–Wallis test for non-normally distributed variables when appropriate. Degree of overlap between risk factors was evaluated in a Venn diagram. This was done to evaluate the proportion of risk factors attributable to overweight/obesity in the population.
RESULTS
Screening rates
A total of 353 children aged 10 to 17 years of age were screened. Forty per cent of children were screened from communities with road access (n=141) and the remainder were from remote communities (n=211) with screening rates of 36.9%; 95% CI 32.1% to 41.8% and 17.7%; 95% CI 15.5% to 20.0%, respectively (P<0.0001). The proportion of children screened varied by community (Table 1), with an overall average screening rate of 22.4%. Targeted school engagement and screening had a significant impact on youth screening rates, as 33.2% of children were screened with this approach, compared to only 13.9% of children screened without the intensified approach.
Screening rates for children in the FINISHED study by community*
| Community number | Fly in or road access | Screening site (health centre, school, both) | Engagement strategy (general vs. targeted school engagement) | Days spent screening in community | Total estimated paediatric population (10–17 years) | Number of children screened | Proportion of children screened |
|---|---|---|---|---|---|---|---|
| 1 | Road Access | Health Centre | School | 21 | 133 (90–162) | 57 | 0.43 |
| 2 | Road Access | Health Centre | General | 4 | 3 (2–4) | 2 | 0.67 |
| 3 | Road Access | Health Centre | General | 28 | 37 (23–47) | 17 | 0.46 |
| 4 | Road Access | Health Centre | General | 9 | 36 (23–45) | 23 | 0.64 |
| 5 | Road Access | Health Centre | General | 14 | 85 (54–106) | 24 | 0.28 |
| 6 | Road Access | Health Centre | General | 22 | 38 (23–48) | 3 | 0.08 |
| 7 | Road Access | Health Centre | General | 14 | 50 (32–63) | 15 | 0.30 |
| 8 | Fly In | Nursing Station | General | 58 | 460 (311–560) | 35 | 0.08 |
| 9 | Fly In | School | School | 18 | 117 (71–148) | 56 | 0.48 |
| 10 | Fly In | Nursing Station/Elementary School | School | 60 | 439 (292–538) | 116 | 0.26 |
| 11 | Fly In | Day Care | General | 12 | 177 (115–229) | 4 | 0.02 |
*One child was screened outside of community screening stations (total n=353).
Demographic characteristics
The median age of the children screened was 12 years (interquartile range [IQR] 10 to 13) and 55.5% were female. Only 45.1% of children screened had a normal weight whereas 33.4% per cent were overweight and 21.4% were obese.
Differences by community remoteness
Children screened in the remote communities were younger (median 11 [10 to 13] versus 12 [11 to 14] years; P=0.004), and had a higher average ACR (median 1.3 [0.6 to 1.9] versus 0.8 [0.6 to 1.9] mg/mmol; P=0.02). No other significant differences were seen between groups (Table 2).
Demographic characteristics of children screened and comparison of road access and remote communities (age 10–17 years)
| All | Road access | Remote | P-value | |
|---|---|---|---|---|
| N=353 | n=142 | n=211 | ||
| Age (years) | 12 (10–13) | 12 (11–14) | 11 (10–13) | 0.0043 |
| Sex (% female) | 55.5 | 52.1 | 57.8 | 0.2900 |
| HbA1C (%) | 5.4 + 0.6 | 5.4 + 0.7 | 5.4 ± 0.6 | 0.1797 |
| HbA1C category (%) | ||||
| ≤6.1% | 1.4% | 97.2% | 97.2% | 0.0606 |
| 6.1–6.49% | 1.4% | 2.1% | 1.0% | |
| ≥6.5% | 97.2% | 0.7% | 1.9% | |
| eGFR category (ml/min per 1.73 m2) | ||||
| ≥90 | 93.8% | 90.8% | 95.7% | 0.0624 |
| <90 | 6.2% | 9.2% | 4.3% | |
| Urine ACR (mg/mmol) | 1 (0.6–1.9) | 0.8 (0.6–1.9) | 1.3 (0.6–1.9) | 0.0173 |
| Urine ACR category (mg/mmol) | ||||
| <3 | 89.5% | 91.6% | 88.2% | 0.6854 |
| 3–29.9 | 10.2% | 8.5% | 11.4% | |
| ≥30 | 0.3% | 0% | 0.5% | |
| Blood Pressure | ||||
| <90th%ile | 82.7% | 84.5% | 81.5% | 0.6220 |
| 90–<95th%ile | 11.9% | 9.9% | 13.3% | |
| >95th%ile | 5.4% | 5.6% | 5.2% | |
| BMI category | ||||
| Normal weight | 45.1% | 46.4% | 44.3% | 0.9045 |
| Overweight (2–3 Z Score) | 33.4% | 32.1% | 34.3% | |
| Obese (≥3 Z Score) | 21.4% | 21.4% | 21.4% | |
| Waist-Hip Ratio | ||||
| Female > 0.85 | 88.5% | 88.7% | 88.4% | 0.9493 |
| Male > 0.90 | 75.8% | 77.3% | 74.7% | 0.7142 |
| Risk for CKD | ||||
| No Risk | 78.2% | 75.4% | 80.1% | 0.5528 |
| Low Risk | 20.4% | 23.2% | 18.5% | |
| Int. Risk | 1.4% | 1.4% | 1.4% | |
| High Risk | 0.0% | 0% | 0% | |
BMI Body mass index; CKD Chronic kidney disease; eGFR Estimated glomerular filtration rate
Yield of CKD risk factors in screened children
Overall, 80.8% of children screened were categorized as no (current) risk, 18.1% were low risk and 1.2% were intermediate risk as per the utilized risk stratification paradigm. No high-risk children were identified. A total of 15% had abnormalities in eGFR or albuminuria including 10.5% with an ACR>3 mg/mmol and 6.2% with an eGFR<90 ml/min/1.73 m2. Only one child had an ACR>30 mg/mmol, and none of the children screened had an eGFR<60 ml/min/1.73 m2. In addition, 5.4% had hypertension and 11.9% had prehypertension, based on an average of six blood pressure readings. Diabetes was identified in 1.4%, and an additional 1.4% had HbA1c’s between 6.1% and 6.49%.
Intersection of risk factors
Figure 2a describes the intersection of obesity, hypertension, low eGFR and albuminuria. There was little overlap between outcomes. However, when the Venn diagram was expanded to include prehypertension and overweight status (Figure 2b), more overlap was manifested. For example, 22.9% of the overweight/obese group had prehypertension/ hypertension and 9.9% had low eGFR or albuminuria. Conversely, only 10.1% of children with a normal weight had prehypertension/hypertension and 21.5% had low eGFR or albuminuria. Importantly, in addition to these findings, 61% of the group with albuminuria had no other risk factors.
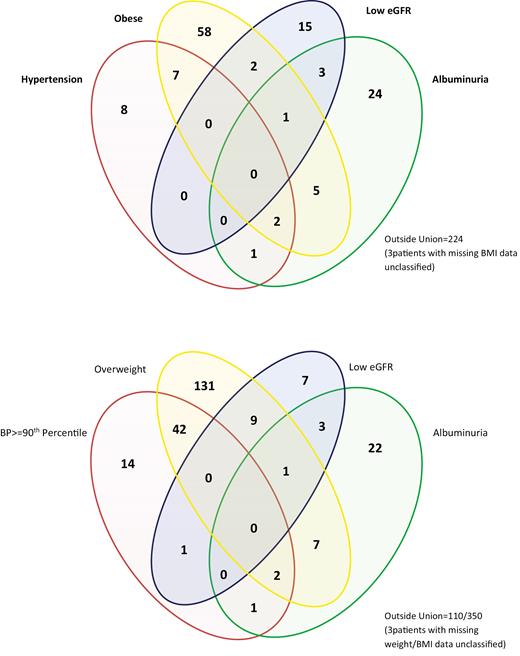
(a) Intersection of Diagnostic Criteria Venn Diagram. (b) Intersection of Diagnostic Criteria Venn Diagram (Overweight/Pre Hypertension included).
DISCUSSION
This screening study for CKD risk factors in Canadian rural Indigenous communities has identified a high proportion of children at risk for long-term health consequences. Over half of the children screened were overweight or obese, 15% had evidence of early kidney disease, 17.3% had prehypertension or hypertension and 3.8% were at risk for, or had, overt diabetes. Although overweight/obesity status was associated with prehypertension/hypertension, most children with albuminuria and decreased eGFR in fact had a normal weight, suggesting other pathogenic mechanisms also contribute to CKD in Indigenous children.
The ability to compare the prevalence of CKD risk factors in Manitoba Indigenous children with other countries, or international rates is challenged by limited data on paediatric predialysis CKD (29,30), and the methodological differences in screening techniques across studies. The most relevant previous study was from Australia, which included an evaluation of obesity, blood pressure and albuminuria in 1248 Indigenous and 1018 non-Indigenous children with a mean age of 8.9 ± 2.0 years (31). At baseline, 7.3% of the cohort had albuminuria, 7.2% had systolic and 5.8% had diastolic hypertension. This cohort identified significantly less obesity (7.1%) and eGFR was not evaluated. After adjustment of covariates, no differences were seen between Indigenous and non-Indigenous children in this study (32). Another recent screening initiative of 240 children (mean age 8.9 ± 4.1 years) performed in Mexico found persistent urinary abnormalities in 15.8% of children including significant proteinuria >500 mg/day in 5%. They also identified CKD with an eGFR<60 ml/min/1.73 m2 in 1.7% and a decreased eGFR between 60 and 90 ml/min/1.73 m2 in another 5.1% (33). Systolic hypertension was identified in 12.7%. These results were more in keeping with our findings, perhaps due to the higher obesity rates in this study (15% with BMI>95th%ile). The only American data available is from the National Health and Nutrition Examination Survey which reported that 9.9% of the 6 to 19-year-old population had albuminuria between 1988 and 1994 (34). Countries with established ongoing mass screening initiatives include Japan, Taiwan and Korea (35) with much lower rates of proteinuria in school age children ranging between 0.3% and 0.6% (36). Even lower rates of paediatric CKD are seen in other countries including a rate of 56 to 74.7 per million age-related population (pmarp) (GFR<75 ml/min/1.73 m2) in Europe, 42.5 pmarp in Latin America and 188 to 329 pmarp in Middle and South East Asia (25).
The higher rates of CKD in Indigenous adults have been primarily attributed to the high rates of diabetes in Indigenous populations (2). In keeping with this, the results from the FINISHED adult screening identified CKD in 25.5% of the 18 to 80-year olds in these same communities, associated with increased HbA1c and hypertension in 72% of cases (37). We identified diabetes in 1.4% of youth, which is in keeping with results from previous screening initiatives in First Nations paediatric populations (38), and notably higher than general population North American rates (16,39). Early onset type 2 diabetes is an important evolving risk factor in youth previously shown by our group and others to be associated with significant risk for kidney failure in early adulthood (17,18). There are also other important risk factors for CKD in Indigenous children including immune-mediated glomerular diseases (2,13) and higher rates of in utero exposures to diabetes and obesity (40) known to influence glomerular size and number as well as overt congenital anomalies of the kidney and urinary tract (30,41,42). The isolated albuminuria in this cohort may therefore be attributed to either glomerular hyperfiltration secondary to decreased nephron mass, or secondary to subclinical immune-mediated glomerular injury.
Screening for CKD in children is controversial. Although universally adopted in Japan, with some evidence that progression to kidney failure in childhood has decreased (174 children in 1984 versus 108 in 2002) (36) and a fourfold lower incidence of patients less than 20 years of age with kidney failure as compared with the United States (35), screening has not been universally recommended by guideline committees. Longitudinal follow-up on the screened Australian cohort has also put into question the persistence of risk factors in young children. After 4 years, albuminuria was only seen in 2.4% of youth (down from 7.3% at baseline), and systolic and diastolic hypertension was only seen in 1.5% and 0.2% of children available for follow-up (43). These findings are quite surprising based on the burden of early risk markers at baseline and high rates of adult disease. The findings do highlight the need for more evidence that screening can impact long-term outcomes in children. An important consideration is the potential benefit that the children may have received from the baseline screening initiative. There was no mention of treatment in these studies, however the possibility that the risk factors may have worsened in the absence of screening should be considered.
The main strength of this study is the comprehensive chronic disease screening in a Canadian population that has not previously been evaluated, and provides important insight into the early risk factors that exist in Indigenous children. The screen/triage/treat model also served to break-down jurisdictional barriers to ensure at-risk youth received care. The initiative was First Nations led, culturally safe and abided by OCAP principles. Certain limitations do warrant discussion. First, low screening rates occurred in some communities, therefore it is unknown if the sampled population reflects the general population. It is also unknown whether unscreened children may be at higher risk or lower risk of subclinical disease. Screening rates were improved by targeted school engagement, which is an important lesson learned. Second, the young age of screened children highlights the lower screening rates in older adolescents. Future screening initiatives require targeted engagement strategies to increase the number of adolescents screened as their attendance at school is lower in Indigenous communities. As testing occurred at one-time interval, follow-up testing is required to confirm the persistence of abnormalities (25). First morning urine samples are required to rule out the presence of orthostatic proteinuria (44) and blood pressures need to be repeated to ensure that white coat hypertension was not a factor. Creatinine which is utilized to calculate eGFR can also be impacted by hydration, muscles mass and other factors (45), however is the current clinical standard for assessment of kidney function utilizing a validated estimating equation (21). As most children were referred to primary care follow-up based on developed pathways, these follow-up tests are not currently available for analysis. Recommendations were made to primary care providers and follow-up work by our group will include an assessment of adherence to recommendations and the results of follow up testing by linking participants to provincial administrative data sources which include laboratory data. A randomized trial is also underway to evaluate the efficacy of screening to improve outcomes. While the screening pathways advance the use of traditional interventions and other local Indigenous diets, this presented a challenge in the context of community and family beliefs systems. Indeed, this intervention requires community knowledge, extensive engagement with parents and/or caregivers and respect of spiritual beliefs and an understanding of the impact of colonization upon Indigenous cultural practices (46).
CONCLUSION
This study has identified high rates of early risk factors for kidney disease in rural Indigenous youth. These findings support the need for more research into the persistence of these findings, and the efficacy of screening and treatment strategies to improve long-term outcomes. Early intervention has the potential for significant, long-lasting positive impact on this high-risk population and should be prioritized in future research.
Financial Disclosure
NT receives honoraria from Takeda Inc. and serves on the Advisory Board for Takeda Inc. and Otsuka. PK is on the Advisory Board for NxStage Medical.
Note: All authors contributed equally to the contents in this manuscript. Presented on behalf of the FINISHED investigators – First Nations Community Based Screening to Improve Kidney Health and Prevent Dialysis
Contributors’ Statements
AD conceptualized and designed the study elements relevant to paediatrics, drafted the initial manuscript, revised it and approved the final manuscript as submitted. BL, CC and LM ensured the study adhered to OCAP principles, developed community engagement strategies, coordinated data collection, reviewed and revised the manuscript and approved the final manuscript as submitted. TF carried out the analyses, reviewed and revised the manuscript and approved the final manuscript as submitted. NT, TB-H and CR reviewed and revised the manuscript, and approved the final manuscript as submitted. AG managed the project, and approved the final manuscript as submitted. PK designed the screening protocol, reviewed and revised the manuscript and approved the final manuscript as submitted. All authors approved the final manuscript as submitted and agree to be accountable for all aspects of the work.
Funding Source
Health Services Integration Fund grant from Health Canada (http://www.hc-sc.gc.ca/fniah-spnia/services/acces/hsif-fiss-goals-principes-eng.php).
Conflicts of Interest
NT has received honoraria from Otsuka Inc, Tricida Inc. and Astra Zeneca Inc. He has also received research support from Astra Zeneca Inc. There are no other conflicts of interest.
References
De Onis M, Onyango AW, Borghi E, Siyam A, Nishida C, Siekmann J: Development of a WHO growth reference for school-aged children and adolescents. Bull World Health Organ. 2007; 85: 660-667. doi:10.2471/BLT.07.043497

