


Abstract
The photosynthetic rate may be strongly limited by internal conductance from the intercellular airspace to the chloroplast stroma ( gi ). However, the effects of growth and leaf temperature on gi are still unclarified. In this work, we determined the temperature dependence of gi in spinach leaves grown at 30/25°C (high temperature; HT) and 15/10°C (low temperature; LT), using the concurrent measurements of the gas exchange rate and stable carbon isotope ratio. Moreover, we quantified the effects of gi on the temperature dependence of the photosynthetic rate. We measured gi and the photosynthetic rate at a CO 2 concentration of 360 μl l −1 under saturating light ( A360 ) at different leaf temperatures. The optimum temperature for A360 was 28.5°C in HT leaves and 22.9°C in LT leaves. The optimum temperatures for gi were almost similar to those of A360 in both HT and LT leaves. There was a strong linear relationship between A360 and gi . The photosynthetic rates predicted from the C 3 photosynthesis model taking account of gi agreed well with A360 in both HT and LT leaves. The temperature coefficients (Q 10 ) of gi between 10 and 20°C were 2.0 and 1.8 in HT and LT leaves, respectively. This suggests that gi was determined not only by physical diffusion but by processes facilitated by protein(s). The limitation of the photosynthetic rate imposed by gi increased with leaf temperature and was greater than the limitation of the stomatal conductance at any temperature, in both HT and LT leaves. This study suggests that gi substantially limits the photosynthetic rate, especially at higher temperatures.
Introduction
Alteration of plant growth temperature results in the change in the temperature dependence of the leaf photosynthetic rate (Berry and Björkman 1980 , Yamori et al. 2005 , Yamori et al. 2006 ). The temperature dependence of the photosynthetic rate is affected by the intercellular CO 2 concentration ( Ci , Berry and Björkman 1980 , Farquhar et al. 1980 , Kirschbaum and Farquhar 1984 , Hikosaka et al. 2006 ). The effects of growth temperature on Ci are different among species. In some studies, Ci was found to decrease when plants were grown at low temperatures (Ferrar et al. 1989 , Williams and Black 1993 , Hikosaka et al. 1999 , Hikosaka et al. 2005 ), but in others, Ci did not change (Ferrar et al. 1989 , Hendrickson et al. 2004 ). In Quercus myrsinaefolia, Ci was markedly lower in leaves grown at a low temperature due to low stomatal conductance, and the average Ci were 230 and 300 μl l −1 for leaves grown at the low and high temperatures, respectively (Hikosaka et al. 1999 ). The authors claimed that such differences in Ci might cause a shift of the optimum temperature of the photosynthetic rate by approximately 3°C.
It was assumed that the CO 2 concentration in the chloroplast stroma ( Cc ) was equal to the Ci (Farquhar et al. 1980 ). However, it is now clear that this assumption is incorrect. Recent studies showed that Cc is significantly lower than Ci due to the finite internal conductance from the intercellular airspace to the chloroplast stroma ( gi ) and that this drawdown in CO 2 concentration from Ci to Cc significantly limits photosynthesis (Loreto et al. 2003 , Warren et al. 2003 , Hanba et al. 2004 , Warren et al. 2004 , Niinemets et al. 2005 , Terashima et al. 2006 ). Both stomatal conductance ( gs ) and gi correlate with the photosynthetic rate and are of the similar magnitude (for a review, see Evans and Loreto 2000 ). Therefore, the effect of leaf and growth temperatures on gi may partly explain the temperature dependence of the photosynthetic rate.
Some authors reported that the magnitude of gi is determined by leaf anatomical features such as cell wall thickness (Nobel 1991 , Kogami et al. 2001 , Miyazawa and Terashima 2001 ) and the surface areas of mesophyll cells ( Smes ) and chloroplasts ( Sc ) exposed to intercellular air spaces (Nobel 1991 , von Caemmerer and Evans 1991 , Evans et al. 1994 , Syvertsen et al. 1995 , Evans 1998 , Evans and Loreto 2000 , Evans 2004 ). On the other hand, those leaf anatomical features failed to explain the rapid response of gi to environmental conditions (Delfine et al. 1998 , Delfine et al. 1999 , Flexas et al. 2002 , Bernacchi et al. 2002 , Centritto et al. 2003 ). Therefore, it has been suggested that gi is closely associated with proteins, such as aquaporins (Terashima and Ono 2002 , Uehlein et al. 2003 , Flexas et al. 2004 , Hanba et al. 2004 ) and/or carbonic anhydrase (Makino et al. 1992 , Sasaki et al. 1996 , Gillon and Yakir 2000 ).
Makino et al. ( 1994 ) suggested that gi is affected by the growth temperature in rice leaves ( Oryza sativa ). They found a decreased photosynthetic rate per unit Rubisco content at low Ci in leaves grown at low temperature, and argued that this effect was the result of a decrease in Cc because Rubisco was not inactivated at these temperatures. On the other hand, in leaves of Nerium oleander , simultaneous measurements of gas exchange and Chl fluorescence suggested that Cc was not different between the growth temperatures (Hikosaka and Hirose 2001 ). There is only one report on the temperature dependence of gi . Bernacchi et al. ( 2002 ) determined the temperature dependence of gi by simultaneous measurements of gas exchange and Chl fluorescence in tobacco leaves ( Nicotiana tabacum ) grown at 25/18°C (day/night). They showed that gi strongly depended on the leaf temperature, with an optimum temperature at 35–37.5°C, and progressively limited the photosynthetic rate at higher temperatures. However, gi obtained by the simultaneous measurements of gas exchange and Chl fluorescence may not be reliable, because the method is based on a simple assumption that the difference between the electron transport rates estimated from gas exchange and that from Chl fluorescence is fully explained by gi . There are many reports that alternative pathways, such as the water–water cycle and cyclic electron flow, are stimulated under conditions under which photosynthetic rates are limited, such as low and high temperatures (for reviews, see Arnon 1995 , Asada 2000 , Heber 2002 , Öquist and Huner 2003 , Sharkey 2005 ). Therefore, the method employing the concurrent measurements of the gas exchange rate and stable carbon isotope ratio has been widely regarded to be more reliable (for a review, see Evans and Loreto 2000 ). Thus, the dependence of gi on measurement and growth temperatures should be evaluated by the latter method.
In this study, we determined the temperature dependences of gi and the photosynthetic rate at a CO 2 concentration of 360 μl l −1 under saturating light conditions in spinach leaves grown at 30/25 (high temperature; HT) and 15/10°C (low temperature; LT). The value of gi was estimated for intact leaves by the concurrent measurements of the gas exchange rate and stable carbon isotope ratio. Based on the results of these measurements, we addressed several key questions. (i) Does gi strongly depend on the leaf temperature? This could indicate whether the processes concerned with gi are controlled by proteins which facilitate CO 2 diffusion. (ii) Does the temperature dependence of gi change depending on the growth temperature? (iii) To what extent do such changes in gi contribute to the changes in the temperature dependence of the photosynthetic rate depending on the growth temperature?
Results
Temperature dependences of photosynthetic rate, g s and g i
The temperature dependences of the net photosynthetic rate at an ambient CO 2 concentration ( Ca ) of 360 μl l −1 under saturating light were different depending on the growth temperature ( Fig. 1 a), as has been previously reported (Yamori et al. 2005 , Yamori et al. 2006 ).
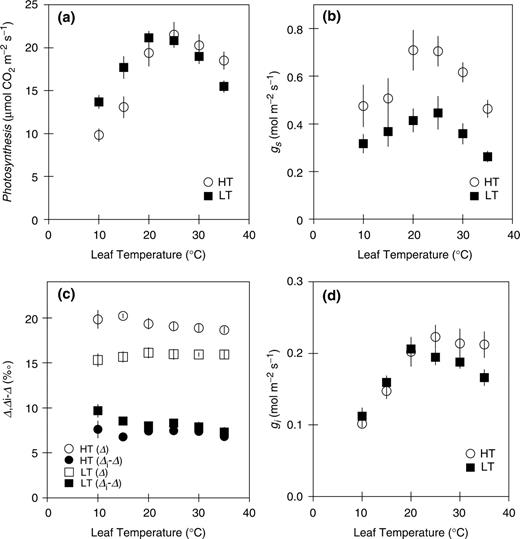
Temperature dependences of net photosynthetic rate (a), stomatal conductance (b; gs ), the actual carbon isotope discrimination (Δ) and the differences between the expected carbon isotope discrimination (Δ i ) and Δ (c), and internal conductance (d; gi ). HT (circles) and LT (squares) denote the leaves grown at day/night air temperature of 30/25 and 15/10°C, respectively. Gas exchange was measured at an ambient CO 2 concentration of 360 μl l −1 under a saturating light intensity of 1,500 μmol m −2 s −1 . Internal conductance was estimated by the concurrent measurements of the gas exchange rate and stable carbon isotope ratio. Data represent means ± SE, n = 5.
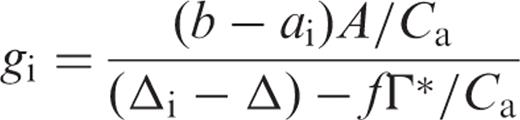
The optimum temperatures for the photosynthetic rate were 28.5°C in HT leaves and 22.9°C in LT leaves, when the temperature dependences of the photosynthetic rates were fitted by cubic curves. gs in HT leaves was greater than that in LT leaves at any temperature, and the optimum temperatures for gs were 20–25°C in both HT and LT leaves ( Fig. 1 b). Temperature dependences of the actual carbon isotope discrimination (Δ) and the differences between the expected carbon isotope discrimination (Δ i ) and Δ were almost constant in both HT and LT leaves, except for somewhat greater Δ in HT leaves and Δ i − Δ in LT leaves at low temperatures ( Fig. 1 c). Δ in HT leaves was greater than that in LT leaves at any temperature, while, Δ i − Δ values were almost similar between HT and LT leaves except for at the lowest temperatures. Using Δ i − Δ, gi was calculated by Equation 1 (see Materials and Methods). The gi were different depending on the growth temperature ( Fig. 1 d). The optimum temperatures for gi were almost similar to those of the photosynthetic rate in both HT and LT leaves. The values for gi at the respective optimum temperatures were 0.22 mol m −2 s −1 in HT leaves and 0.21 mol m −2 s −1 in LT leaves. At higher temperatures, we found a decrease in gi in the LT leaves, but this effect was not clear in HT leaves. At lower temperatures, the effect of temperature on gi was very similar in HT and in LT leaves. The temperature coefficients (Q 10 ) for gi between 10 and 20°C were 1.99 in HT leaves and 1.84 in LT leaves, respectively.
When the data of HT and LT leaves were pooled separately, the relationships between the photosynthetic rate and gs were barely observed ( Fig. 2 a; HT, R2 = 0.51; LT, R2 = 0.74). On the other hand, there were strong linear regressions between the photosynthetic rate and gi , in both HT and LT leaves ( Fig. 2 b; HT, R2 = 0.97; LT, R2 = 0.86). The temperature dependences of gi / gs were different depending on the growth temperature ( Fig. 2 c). The values of gi / gs showed similar values at the respective growth temperatures in HT and LT leaves.
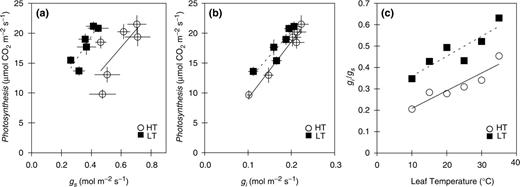
Relationships between photosynthetic rate and stomatal conductance (a; gs ) or internal conductance (b; gi ). The regression lines shown are: (a) HT (solid line), y = 29.14 x + 0.214 ( R2 = 0.51); LT (dotted line), y = 38.64 x + 4.016 ( R2 = 0.74), (b) HT (solid line), y = 93.96 x – 0.144 ( R2 = 0.97); LT (dotted line), y = 81.28 x + 4.065 ( R2 = 0.86). Temperature dependence of the ratio between internal conductance and stomatal conductance (c). The regression lines shown are: HT (solid line), y = 0.0081 x + 0.136 ( R2 = 0.87); LT (dotted line), y = 0.0092x + 0.273 ( R2 = 0.81). Abbreviations and symbols are the same as those in Fig. 1 . Data represent means ± SE, n = 5.
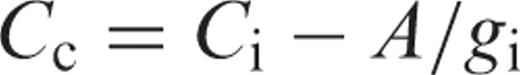
The Ci tended to decrease with increasing temperature, in both HT and LT leaves ( Fig. 3 a). Ci in HT leaves was approximately 30 μl l −1 greater than that in LT leaves ( Fig. 3 a). The Cc were almost constant at any temperature in both HT and LT leaves ( Fig. 3 b). Cc in HT leaves was approximately 50 μl l −1 higher than that in LT leaves ( Fig. 3 b). The Ci / Ca ratio decreased with increasing temperature ( Fig. 3 c), whereas, Cc / Ci and Cc / Ca were almost constant at any temperature in both HT and LT leaves ( Fig. 3 d, e). Cc / Ci was considerably lower than Ci / Ca in both HT and LT leaves. The CO 2 drawdowns caused by low gs (the difference between the ambient and intercellular CO 2 concentrations, Ca − Ci ) at 25°C were 43.2 and 75.1 μl l −1 in HT and LT leaves, respectively. On the other hand, the CO 2 drawdowns caused by low gi (the difference between intercellular and chloroplast CO 2 concentrations, Ci − Cc ) at 25°C were 96.8 and 108 μl l −1 in HT and LT leaves, respectively. The reduction in both gs and gi caused the CO 2 drawdowns from ambient air to the chloroplast stroma in both HT and LT leaves.
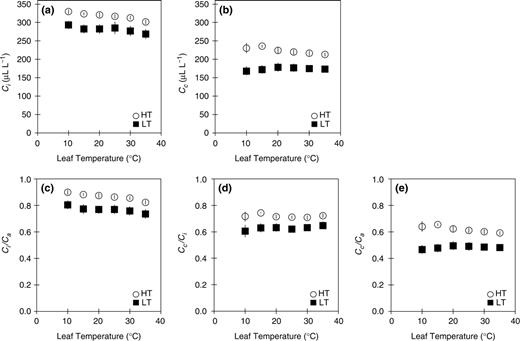
The temperature dependence of the CO 2 concentration in the intercellular air space (a; Ci ) and in the chloroplast (b; Cc ), and the temperature dependence of the ratio between intercellular and ambient CO 2 concentration (c; Ci / Ca ), the ratio of chloroplast to intercellular CO 2 concentration (d; Cc / Ci ) and the ratio of chloroplast to ambient CO 2 concentration (e; Cc / Ca ). Abbreviations and symbols are the same as those in Fig. 1 . Data represent means ± SE, n = 5.
Effects of g s and g i on the temperature dependence of the photosynthetic rate
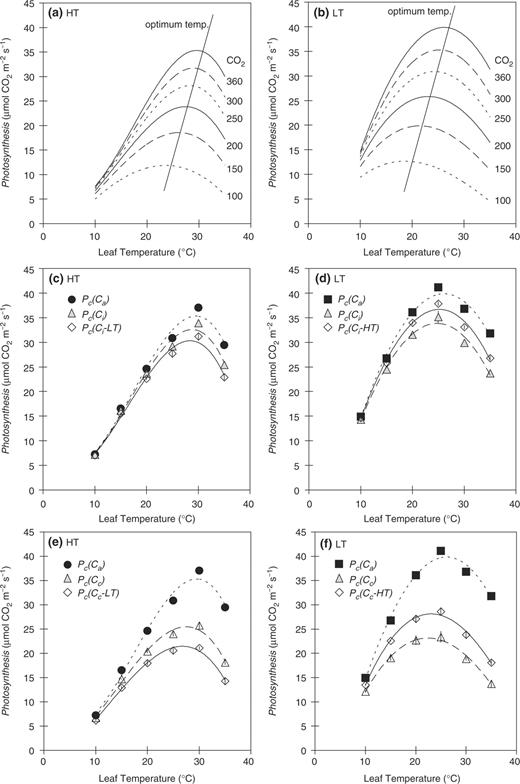
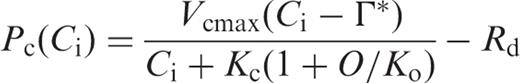
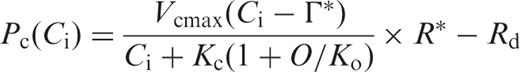
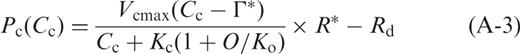
We evaluated the effects of gs and gi on the temperature dependence of the photosynthetic rate ( Fig. 4 ). As described in model A in Materials and Methods, Pc ( Ca ) was calculated assuming infinite values for gs and gi , Pc ( Ci ) was calculated assuming a finite value for gs and an infinite value for gi , and Pc ( Cc ) was calculated using finite values for gs and gi . The values for the measured photosynthetic rates were taken from the data set presented in Fig. 1 a. At low temperatures, Pc ( Ca ), Pc ( Ci ) and Pc ( Cc ) nearly matched the measured photosynthetic rate, both in HT and in LT leaves ( Fig. 4 a, b). The extents of the decrease in all of the calculated photosynthetic rates at low temperatures in the HT leaf were greater than those in the LT leaf. At moderately high temperatures, Pc ( Ca ) and Pc ( Ci ) were much higher than the measured photosynthetic rates in both HT and LT leaves. However, Pc ( Cc ) agreed well with the measured photosynthetic rates in both HT and LT leaves at high temperatures.
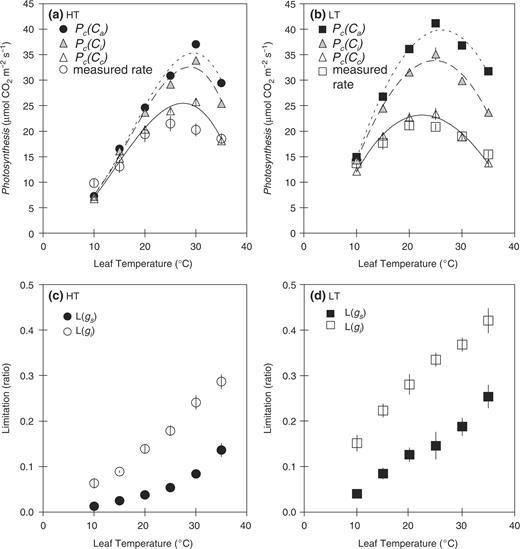
Effects of stomatal conductance ( gs ) and internal conductance ( gi ) on the temperature dependence of the photosynthetic rate in HT (a) and LT leaves (b). Pc ( Ca ) was calculated from the photosynthetic rate at Ca = Ci = Cc = 360 μl l −1 assuming that both gs and gi were infinite (HT; filled circle, LT; filled square). Pc ( Ci ) was calculated from the photosynthetic rate at Cc = Ci assuming values for gs obtained in this study, while gi was assumed to be infinite (HT, LT; gray triangle). Pc ( Cc ) was calculated from the photosynthetic rate assuming values for gs and gi obtained from measurements in this study (HT, LT; open triangle). The data were fitted by cubic curves. The values of the measured photosynthetic rates were equal to those presented in Fig. 1 (HT, open circle; LT, open square). The limitation of the photosynthetic rate by gs ( Lgs , HT; filled circle, LT; filled square) and gi ( Lgi , HT; open circle, LT; open square) in HT (c) and LT leaves (d). Data represent means ± SE, n = 5.
When the temperature dependences of the photosynthetic rates were fitted by cubic curves, the optimum temperatures for Pc ( Ca ), Pc ( Ci ), Pc ( Cc ) and the measured photosynthetic rate were 29.3, 28.8, 28.4 and 28.5°C in HT leaves ( Fig. 4 a). In contrast, in LT leaves, the optimum temperatures of Pc ( Ca ), Pc ( Ci ), Pc ( Cc ) and the measured photosynthetic rate were 25.7, 24.7, 22.9 and 22.9°C ( Fig. 4 b). For both leaf types, we found that the optimum temperatures for the calculated photosynthetic rate Pc ( Cc ) were very similar to those of the measured photosynthetic rate in both HT and LT leaves ( Fig. 4 a, b). The temperature dependences of Pc ( Cc ) were closely related to those of the measured photosynthetic rates over the entire temperature range. We analyzed the relationship between the measured photosynthetic rate and Pc ( Cc ) in both HT and LT leaves. The measured photosynthetic rate ( y ) agreed with Pc ( Cc ) ( x ), when the data of HT and LT leaves were pooled ( y = 0.95 x, R2 = 0.70).
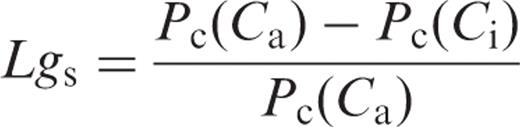
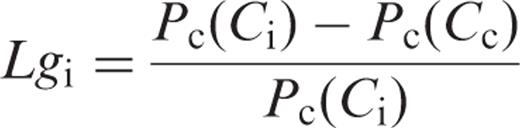
We evaluated the limitation of the photosynthetic rate by gs and gi in HT and LT leaves ( Fig. 4 c, d). The limitations of the photosynthetic rate by gs ( Lgs ) and gi ( Lgi ) are expressed as the proportionate decreases in the photosynthetic rate, compared with the rates calculated by assuming infinite gs and gi , respectively ( Equations 3 and 4) . Lgs and Lgi increased with leaf temperature in both HT and LT leaves. Lgs in HT leaves increased from 0.013 at 10°C to 0.136 at 35°C ( Fig. 4 c), and from 0.040 to 0.254 in LT leaves ( Fig. 4 d). On the other hand, Lgi in HT leaves increased from 0.063 at 10°C to 0.287 at 35°C ( Fig. 4 c), and from 0.151 to 0.421 in LT leaves ( Fig. 4 d). At all temperatures examined, Lgi was greater than Lgs , in both HT and LT leaves. In addition, Lgs and Lgi in LT leaves were always greater than those in HT leaves at any temperature.
Effects of differences in g s and g i on the temperature dependence of the photosynthetic rate
Figure 5 a, b show the temperature dependences of the predicted photosynthetic rates at various Cc using Equation A-3 in HT and LT leaves, respectively (see Appendix ). In these predictions, it is assumed that Cc were constant for the overall temperature range. Temperature dependences of the predicted photosynthetic rates differed depending on Cc in both HT and LT leaves. The optimum temperature of the photosynthetic rate shifted towards lower temperatures with the decrease in Cc . These findings indicate that the optimum temperature in LT leaves was lower than that in HT leaves if Cc in LT leaves was lower than that in HT leaves. It is obvious that the optimum temperatures of the photosynthetic rate do not change very much if the differences in Cc between HT and LT leaves are small. On the other hand, the optimum temperatures of the photosynthetic rate change greatly if the differences in Cc between HT and LT leaves are large.
Temperature dependence of the predicted photosynthetic rate at different Cc in HT (a) and LT leaves (b). It is assumed that Cc was constant for the overall temperature range. The effects of differences in stomatal conductance ( gs ) and internal conductance ( gi ) on the temperature dependence of the photosynthetic rate in HT (c, e) and LT leaves (d, f). Abbreviations and symbols for Pc ( Ca ), Pc ( Ci ) and Pc ( Cc ) in HT and LT leaves are the same as those in Fig. 4 . Pc ( Ci – LT) in (c) HT was calculated from the photosynthetic rate in HT leaves at Ci obtained for LT leaves. Pc ( Ci – HT) in (d) LT was calculated from the photosynthetic rate in LT leaves at Ci obtained for HT leaves. Pc ( Cc – LT) in (e) HT was calculated from the photosynthetic rate in HT leaves at Cc obtained for LT leaves. Pc ( Cc – HT) in (f) LT was calculated from the photosynthetic rate in LT leaves at Cc obtained for HT leaves. The data were fitted by cubic curves. Data represent means ± SE, n = 5.
Ci and Cc were different between different growth temperatures by approximately 30 and 50 μl l −1 , respectively ( Fig. 3 a, b). We examined the effects of the differences in gs and gi on the temperature dependence of the photosynthetic rate, since the temperature dependence of the photosynthetic rate is thought to be affected by Cc (Hikosaka et al. 2006 ). Fig. 5 c, d showed the effects of differences in Ci on the temperature dependence of the photosynthetic rate in HT and LT leaves, respectively. We estimated the temperature dependence of the photosynthetic rate in HT leaves at values for Ci obtained for LT leaves ( Fig. 5 c) and, similarly, we estimated the temperature dependence in LT leaves at values for Ci obtained for HT leaves ( Fig. 5 d). A change in Ci hardly affected the temperature dependence of the photosynthetic rate ( Fig. 5 c, d). The effect of Ci on the optimum temperature was small, and produced a difference of only 0.7–1.0°C.
Figure 5 e, f showed the effects of differences in Cc on the temperature dependence of the photosynthetic rate in HT and LT leaves, respectively. We estimated the temperature dependence of the photosynthetic rate in HT leaves at values for Cc obtained for LT leaves ( Fig. 5 e) and, similarly, we estimated the temperature dependence in LT leaves at values for Cc obtained for HT leaves ( Fig. 5 f). A change in Cc affected the temperature dependence of the photosynthetic rate ( Fig. 5 e, f). The effect of a different Cc on the optimum temperature of the photosynthetic rate was larger than that of Ci , and produced shifts of 1.5–1.8°C.
Discussion
Temperature dependences of the photosynthetic rate and g i
We clearly showed that the temperature dependences of gi were different depending on the growth temperature, particularly at high temperatures ( Fig. 1 d). The optimum temperatures of gi were very similar to those of the photosynthetic rate, in both HT and LT leaves ( Fig. 1 a, d). We also showed that the photosynthetic rate positively depended on gi , in both HT and LT leaves ( Fig. 2 b; HT, R2 = 0.97; LT, R2 = 0.86). Using the method based on the simultaneous measurements of gas exchange and Chl fluorescence, Bernacchi et al. ( 2002 ) showed that gi was strongly dependent on the leaf temperature, with a sharp peak at 35–37.5°C in tobacco leaves grown at 25/18°C (day/night). The temperature dependence of gi , as presented in this work, differed from the data shown by Bernacchi et al. ( 2002 ), especially at higher leaf temperatures. It is possible that the discrepancy between our results and the previously published data for the temperature dependence of gi resulted from differences in plant species and/or in growth conditions. Alternatively, it is also probable that the discrepancy is due to the difference in the method. The measurement of gi by the combination of gas exchange and Chl fluorescence is based on the assumption that the difference between the electron transport rates estimated from gas exchange and estimated from Chl fluorescence is fully explained by gi . However, it has been reported that alternative pathways, such as the water–water cycle and cyclic electron flow, are stimulated under conditions in which photosynthetic rates are limited, such as low and high temperature (for a review, see Arnon 1995 , Asada 2000 , Heber 2002 , Öquist and Huner 2003 , Sharkey 2005 ). If such alternative pathways are actually enhanced in tobacco leaves at temperatures higher and lower than the optimum temperature, the sharp peak in gi reported by Bernacchi et al. ( 2002 ) may be due to the underestimation of gi at such temperatures.
The Q 10 value between 10 and 20°C for the diffusivity of CO 2 in pure water was determined to be around 1.4 (Hesketh et al. 1983 ). If gi is partly determined by proteins, it is thought that the Q 10 for gi should be approximately 2 or higher (Nobel 1999). The observed Q 10 between 10 and 20°C was approximately 2 for gi both in HT and in LT leaves ( Fig. 1 d), suggesting that the determinants of gi were not only physical diffusion, but processes facilitated by proteins, such as aquaporin (Terashima and Ono 2002 , Uehlein et al. 2003 , Flexas et al. 2004 , Hanba et al. 2004 ) and carbonic anhydrase (Makino et al. 1992 , Sasaki et al. 1996 , Gillon and Yakir 2000 ). Moreover, the temperature dependence of gi was affected by the growth temperature ( Fig. 1 d). This also strongly suggests the involvement of protein(s) in CO 2 diffusion. If this is the case, the difference in the decrease in gi at higher temperatures can be attributed to the differences in the thermal stability and/or the suppressed enzyme activities involved in CO 2 diffusion ( Fig. 1 d).
Recently, the role of aquaporins in CO 2 diffusion has received much interest. Aquaporins increase the CO 2 permeability of plant cell membranes (Terashima and Ono 2002 , Uehlein et al. 2003 , Flexas et al. 2004 , Hanba et al. 2004 ). Hanba et al. ( 2004 ) overexpressed an aquaporin 2 of Hordeum vulgare L. (HvPIP2;1; an aquaporin in the plasma membrane-type subfamily) in rice ( Oryza sativa L.). They demonstrated that the overexpression of HvPIP2;1, which increased the level of aquaporins detected by an antibody raised against HvPIP2;1 by 135%, enhanced gi in intact rice leaves by 40%. Terashima et al. ( 2006 ) roughly estimated that more than two-thirds of CO 2 transported across the plasma membrane is via aquaporins. Carbonic anhydrase is also thought to be involved in CO 2 diffusion (Makino et al. 1992 , Sasaki et al. 1996 , Gillon and Yakir 2000 ). However, Price et al. ( 1994 ) showed that the antisense reduction of carbonic anhydrase activity to 2% of wild-type levels did not reduce the light-saturated photosynthetic rate at an ambient CO 2 concentration of 360 μl l −1 at 25°C. Therefore, the role of carbonic anhydrase in internal conductance is still unclear.
Several authors have argued that gi is largely constitutive and determined by leaf structural traits such as the surface area of chloroplasts exposed to intercellular air spaces ( Sc ) and cell wall thickness (for a recent review, see Terashima et al. 2006 ). There is no doubt that gi is proportional to Sc and inversely related to cell wall thickness, since Sc represents the effective area for CO 2 diffusion and cell wall thickness affects the path length for CO 2 diffusion in the liquid phase. LT leaves in spinach had thick palisade tissue comprising approximately three cell layers, while HT leaves had thin palisade tissue comprising approximately two cell layers (unpublished data). Therefore, it is possible that LT leaves have a greater Sc than HT leaves. However, Park and Tsunoda ( 1979 ) observed that rice plants grown at low temperature had swollen chloroplasts filled with excess starch. Large starch grains might significantly reduce Sc and disturb CO 2 diffusion in the chloroplast. Starch accumulation was also observed in spinach leaves grown at low temperature (Guy et al. 1992 ). In addition, changes in cell wall thickness and lipid properties of the membranes depending on the growth temperature might affect the CO 2 permeability. If this is the case, it may counteract the effect of the increased number of palisade cell layers on Sc in LT leaves. This may be the explanation for the observation that we found little difference in gi between HT and LT leaves, compared with maximum values at the respective optimum temperature for gi ( Fig. 1 d).
Effects of g s and g i on the temperature dependence of the photosynthetic rate
We evaluated the effects of gs and gi on the temperature dependence of the photosynthetic rate ( Fig. 4 a, b). The photosynthetic rate calculated assuming an infinite value for gi [ Pc ( Ca ) and Pc ( Ci )] deviated from the measured photosynthetic rate at high temperatures, in both HT and LT leaves. However, the photosynthetic rate calculated using finite values for gs and gi [ Pc ( Cc )] agreed well with the measured photosynthetic rates at high temperature, and properly reproduced the shift in the optimum temperature for the photosynthetic rate in both HT and LT leaves ( Fig. 4 a, b).
The limitation of the photosynthetic rate by gs ( Lgs ) and gi ( Lgi ) was estimated by Equations 3 and 4 . Both gs and gi became increasingly limiting to the photosynthetic rate as the temperature increased ( Fig. 4 c, d). The CO 2 drawdowns caused by finite gs and gi (the difference between ambient and chloroplast CO 2 concentration, Ca − Cc ) were mainly the result of the limitation by gi rather than that by gs , because Lgi was greater than Lgs at all temperatures in both HT and LT leaves ( Fig. 4 c, d). This clearly showed that gi imposed a very substantial limitation to the photosynthetic rate, irrespective of the growth temperatures, especially at high temperatures. In our previous study, we showed that the photosynthetic performance is largely determined by Rubisco kinetics at low temperatures, but by the Rubisco kinetics and Rubisco activation state at high temperatures (Yamori et al. 2006 ). In this study, we showed that, at high temperature, the photosynthetic performance is determined not only by the Rubisco kinetics and Rubisco activation state but also by gi .
The temperature dependence of the photosynthetic rate is thought to be affected by Ci and Cc (Hikosaka et al. 2006 ). The values for Ci and Cc in LT leaves were less than those in HT leaves by approximately 30 and 50 μl l −1 , respectively ( Fig. 3 a, b). As a sensitivity analysis, we estimated the temperature dependence of the photosynthetic rate in HT leaves at the Cc obtained for LT leaves ( Fig. 5 e) and, similarly, that in LT leaves at the Cc obtained for HT leaves ( Fig. 5 f). The difference in Cc affected the temperature dependence and the optimum temperature of the photosynthetic rate by 1.5–1.8°C. Therefore, we conclude that the differences in Cc contribute to the change in the temperature dependence of the photosynthetic rate and may partly explain the shift in the optimum temperature.
In many plants, gi is relatively low (for a review, see Evans and Loreto 2000 , Ethier and Livingstone 2004 , Terashima et al. 2006 ). These impose a significant limitation to photosynthesis. Furthermore, gi was strongly dependent on the leaf temperature and became increasingly limiting to the photosynthetic rate as the temperature increased. Under such conditions, it is impossible to evaluate the photosynthetic rate accurately, if gi is not taken into account for the C 3 photosynthesis model (Farquhar et al. 1980 ). When the temperature dependences of Rubisco kinetic parameters and the Rubisco activation state provided in the previous study (Yamori et al. 2006 ), and gi provided in this study were all taken into account, the C 3 photosynthesis model will be much improved for estimation of the photosynthetic rate over a wide range of temperatures.
We clearly showed that gi was strongly dependent on the leaf temperature and had an optimum temperature. Moreover, the temperature dependences of gi changed depending on the growth temperature. The temperature dependence of gi provided evidence for the view that CO 2 transfer from the leaf intercellular airspace into the chloroplast would be controlled by processes facilitated by proteins, such as aquaporins and carbonic anhydrase. We also found that gi became more limiting to the photosynthetic rate as the temperature increased, in both HT and LT leaves. The limitation by gi was larger than that by gs at any temperature, in both HT and LT leaves. These results showed that the photosynthetic rate is significantly limited by gi at any temperature, but especially at higher temperatures. Together with our previous study (Yamori et al. 2006 ), we can be fairly certain that, at low temperatures, the photosynthetic performance is largely determined by Rubisco kinetics, while at high temperatures, it is determined by the Rubisco kinetics, Rubisco activation state and gi .
Materials and Methods
Plant growth conditions
Spinach ( Spinacia oleracea L. cv. Torai) plants were grown in vermiculite, as described in Yamori et al. ( 2005 ). The day/night lengths were 8 and 16 h, respectively. Photosynthetically active photon flux density (PPFD) in the daytime was 230 μmol photons m −2 s −1 . The day/night air temperatures were either 30/25 or 15/10°C. These are referred to as high temperature (HT) and low temperature (LT) conditions, respectively. The leaves grown at HT and LT are called HT and LT leaves, respectively. The plants were watered once a week and fertilized with 200 ml of a nutrient solution containing 2 mM KNO 3 , 2 mM Ca(NO 3 ) 2 , 0.75 mM MgSO 4 , 0.665 mM NaH 2 PO 4 , 25 μM Fe-EDTA, 5 μM MnSO 4 , 0.5 μM ZnSO 4 , 0.5 μM CuSO 4 , 25 μM H 3 BO 4 , 0.25 μM Na 2 MoO 4 , 50 μM NaCl and 0.1 μM CoSO 4 once a week.
Gas exchange measurements and estimation of internal conductance
Models
A. Effects of g s and g i on the temperature dependence of the photosynthetic rate. .
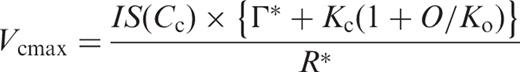
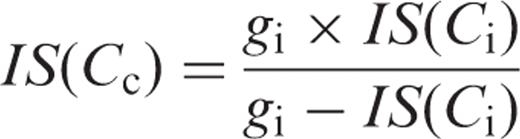
We compared the measured photosynthetic rates and the predicted photosynthetic rates in HT and LT leaves, respectively ( Fig. 4 ). The predicted photosynthetic rates in HT and LT leaves were calculated for three conditions. For condition (A), we calculated the temperature dependence of Pc ( Ca ) at Ca = Ci = Cc = 360 μl l −1 assuming that both gs and gi were infinite, using Equation A-2 (see Appendix ). For condition (B), we calculated the temperature dependence of Pc ( Ci ) at Cc = Ci assuming that gs was the value obtained in this study, while gi was infinite, using Equation A-2 . For condition (C), we calculated the temperature dependence of Pc ( Cc ) assuming that both gs and gi were the values obtained in this study, using Equation A-3 (see Appendix ). To obtain these predicted photosynthetic rates, we assumed that day respiration rates ( Rd ) were half the respective dark respiration rates that were reported for HT and LT leaves in our previous studies (Yamori et al. 2005 , Yamori et al. 2006 ). We first calculated the temperature dependence of Kc (1 + O / Ko ) values, using Equation A-4 (see Appendix ). The temperature dependences of the Rubisco activation state ( R *), the maximum rate of ribulose-1,5-bisphosphate (RuBP) carboxylation ( Vcmax ) and the CO 2 compensation point in the absence of day respiration (Γ*) were obtained from spinach leaves grown under the conditions identical to the present experiment (Yamori et al. 2006 ). IS ( Cc ) in Equation A-4 was determined from gi obtained in this study and IS ( C i ) obtained for spinach leaves (Yamori et al. 2005 ), using Equation A-5 (see Appendix ). The data for these parameters at intervals of 5°C from 10 to 35°C were obtained by fitting cubic curves. The resultant temperature dependences of Kc (1 + O / Ko ) were generally similar to those reported by Jordan and Ogren ( 1984 ) who determined temperature dependences of Kc and Ko values in Rubisco purified from spinach leaves grown at 23/18°C (day/night).
Next, we calculated absolute values of Vcmax (μmol m −2 s −1 ) to match the Rubisco contents between the measured photosynthetic rates in this study and the estimated photosynthetic rates. Vcmax on a leaf area basis was estimated from Equation A-3, at each temperature, using photosynthetic rates and Cc obtained in this study. Then, Vcmax values estimated for each temperature were averaged for the HT and LT leaves, respectively. Vcmax values thus estimated at 25°C were 54.1 and 73.1 μmol m −2 s −1 for HT and LT leaves, respectively.
B. Limitation of photosynthetic rate by g s and g i .
Acknowledgements
We are grateful to Dr. Y. Tazoe (Osaka University, Japan) for instruction in measurements of internal conductance. This work was supported by a grant from JSPS for young research fellows to W.Y.
Appendix
C 3 photosynthesis model
References
- Ca
ambient CO 2 concentration
- Cc
chloroplast CO 2 concentration
- Ci
intercellular CO 2 concentration
- gi
internal conductance
- gs
stomatal conductance
- HT
high temperature (30/25°C)
- Lgi
limitation of the photosynthetic rate by g i
- Lgs
limitation of the photosynthetic rate by g s
- LT
low temperature (15/10°C)
- RuBP
ribulose-1,5-bisphosphate
- Sc
surface area of chloroplasts exposed to intercellular airspace.
Author notes
Present address: Department of Biological Sciences, Graduate School of Science, The University of Tokyo, 7-3-1 Hongo, Bunkyo-ku, Tokyo 113-0033 Japan.
