


Abstract
Boron (B) is an essential micronutrient for the growth and development of plants. Oilseed rape (Brassica napus L.) is a staple oleaginous crop, which is greatly susceptible to B deficiency. Significant differences in tolerance of low-B stresses are observed in rapeseed genotypes, but the underlying mechanism remains unclear, particularly at the single-cell level. Here we provide novel insights into pectin-mediated cell wall (CW) mechanical properties implicated in the differential tolerance of low B in rapeseed genotypes. Under B deficiency, suspension cells of the low-B-sensitive genotype ‘W10’ showed more severely deformed morphology, lower viabilities and a more easily ruptured CW than those of the low-B-tolerant genotype ‘QY10’. Cell rupture was attributed to the weakened CW mechanical strength detected by atomic force microscopy; the CW mechanical strength of ‘QY10’ was reduced by 13.6 and 17.4%, whereas that of ‘W10’ was reduced by 29.0 and 30.4% under 0.25 and 0.10 μM B conditions, respectively. The mechanical strength differences between ‘QY10’ and ‘W10’ were diminished after the removal of pectin. Further, ‘W10’ exhibited significantly higher pectin concentrations with much more rhamnogalacturonan II (RG-II) monomer, and also presented obviously higher mRNA abundances of pectin biosynthesis-related genes than ‘QY10’ under B deficiency. CW regeneration was more difficult for protoplasts of ‘W10’ than for those of ‘QY10’. Taking the results together, we conclude that the variations in pectin-endowed CW mechanical properties play key roles in modulating the differential genotypic tolerance of rapeseed to low-B stresses at both the single-cell and the plant level, and this can potentially be used as a selection trait for low-B-tolerant rapeseed breeding.
Introduction
Since the discovery by Warington (1923) that boron (B) is an essential micronutrient for the growth and development of higher plants, the physiological roles of B have given rise to numerous investigations. B is found in both water-soluble and -insoluble forms in intact plant tissues (Skok and Mcllrath 1958). With the aggravation of B-deficiency stresses, water-soluble B concentrations decrease in plants, and the water-insoluble B is therefore assumed to be functional (Skok and Mcllrath 1958). Subsequent studies have revealed that water-insoluble B exists in pectin and cross-links two pectic polysaccharide rhamnogalacturonan II (RG-II) monomers (mRG-II) to form a RG-II dimer (dRG-II-B) via borate–diester bonding (Kobayashi et al. 1996). Dicots with higher cell wall (CW) pectin contents require greater amounts of B for CW construction compared with monocots (Hu et al. 1996). Tissues with inadequate and excess B often feel ‘brittle’ and ‘rubbery’, respectively (Loomis and Durst 1992, Blevins and Lukaszewski 1998), which indicates a mechanical effect of dRG-II-B on the CW. Initially, pectin was mostly regarded as a filling material for the open spaces in the cellulose/hemicellulose network, whereas recent studies have shown that pectin cross-links play a load-bearing role in the CW (Peaucelle et al. 2011, Peaucelle et al. 2012, Braybrook et al. 2012, Bethke et al. 2016). However, little direct evidence has been obtained to demonstrate the crucial roles of pectin in CW development through mechanical assays, particularly the mechanical role of primary-wall pectin (Chanliaud et al. 2002).
Currently, to address the problem of B deficiency, B fertilizers have been applied in cultivated soils (Hua et al. 2016a), whereas borate rocks are non-renewable resources, the continuous depletion of which severely limits the sustainable development of agricultural industries. It is a feasible solution to improvement of the B efficiency of crops by exploration of the implicated physiological, genetic and molecular mechanisms. A wide range of natural variation in B efficiencies is observed in plants, which is quantitatively governed by polygenic loci (Zhang et al. 2014). Diverse factors, such as absorption, transport, allocation and utilization of B, should be taken into consideration (Takano et al. 2002, Nachiangmai et al. 2004, Miwa et al. 2006, Takano et al. 2006, Miwa et al. 2013, Hua et al. 2016 a, b). Overexpression of B uptake, transport and distribution genes has greatly improved the tolerance of B deficiency in Arabidopsis thaliana, tomato and tobacco (Bellaloui et al. 1999, Kato et al. 2009, Uraguchi et al. 2014). The utilization of B is directly involved in the biosynthesis of CW pectin; in the absence of B, the increase in pectin concentrations exacerbates B-deficiency symptoms of plants, which have been identified in wheat and corn (Yu et al. 2002). It has been reported that glycosyl compositions of cell walls are higher in a B-inefficient rapeseed genotype than in a B-efficient genotype (Pan et al. 2012). However, a direct correlation is still lacking between pectin concentrations, CW mechanical properties and in planta tolerance of low B.
Plant cells are routinely exposed to various environmental stresses that cause CW structure perturbations (Mujahid et al. 2013), which result in abnormal mechanical properties of plant tissues. CWs confer mechanical properties of plant tissues, i.e. their intrinsic mechanical characteristics, interactive responses to turgor pressure, and the way they are attached to their neighbors (Chanliaud et al. 2002). However, research on CW mechanics with micro- or nano-indentation methods was once regarded as intractable (Peaucelle et al. 2012). Recently, exploration of atomic force microscopy (AFM) has made the direct examination of CW mechanics feasible (Radotić et al. 2012, Malgat et al. 2016).
Studies have been performed extensively in plant systems. For instance, the effect of B supply on mechanical strengths was analyzed using the hypocotyl and stem in A. thaliana (Ryden et al. 2003); the assumption that pectin can induce changes in CW mechanics was demonstrated in primordia and incipient organs (Peaucelle et al. 2011). However, the plant system is considerably complex when close communication occurs in the tissues and organs. Thus, it is clearly desirable to determine the responses of the individual cell to diverse biotic and abiotic stresses from the perspective of physiology, genetics and molecular biology. For this purpose, a suspension-cultured cell is an excellent model due to the elimination of inter-tissue and -organ communication (Sasaki et al. 2008). Suspension cells are particularly favorable for the functional study of pectin because suspension-cultured cells only form a primary CW, which contains abundant pectin (O’Neill et al. 2004; Caffall and Mohnen 2009). In addition, plant cells can rapidly re-synthesize CWs after their removal, and thus the protoplast derived from the suspension cell is also an excellent proxy for research into CW regeneration (Cooper et al. 1994, Mujahid et al. 2013). The suspension cell has been widely used as a model in various plant species for cellular studies in recent years, such as tobacco (Nicotiana tabacum) BY-2 cells and suspension cells of rice, A. thaliana and Lolium (Coursol et al. 2015, He et al. 2015, Sello et al. 2016, Yakubov et al. 2016). Nevertheless, suspension-culture systems have not yet been established in oilseed rape (Brassica napus L.), which is highly susceptible to B deficiency (Marschner 1995). Brassica napus is the second leading oil crop species (after soybean) that is widely cultivated (Lee et al. 2016). B deficiency represents a widespread limiting factor for seed yield of rapeseed (Shorrocks 1997). A low-B-tolerant (B-efficient) genotype, ‘Qingyou 10’ (‘QY10’), was found to cope well with low-B stresses compared with the low-B-sensitive (B-inefficient) genotype ‘Westar 10’ (‘W10’) (Zhang et al. 2014). However, the determinants remain elusive despite much effort having been made to reveal the physiological and molecular mechanisms underlying the genotypic differences in low B tolerance.
A requirement for B by cultured plant cells has been reported in some plant species, such as carrot (Durst and Loomis 1984), tobacco (Matoh et al. 2000) and rose (Chormova et al. 2014). However, a comprehensive characterization of the morpho-physiological, biophysical and transcriptional responses of rapeseed suspension cells to B deficiency remains elusive, and none of these studies has focused on low-B tolerance among genotypes. Here, we established a hypocotyl-derived rapeseed suspension cell culture system from the low-B-tolerant genotype ‘QY10’ and the low-B-sensitive genotype ‘W10’ to provide versatile single-cell resources for the future studies. To our knowledge, there has been no experimental effort using biophysical techniques to investigate single cells of rapeseed that directly measure the contributions of pectin to mechanical strength and regeneration. We used in situ atomic force microscopy (AFM) to probe the mechanical properties of the CW and its fraction cell wall without pectin (CW-P); we also used the protoplast as an excellent proxy for the study of cell wall regeneration. We aimed to achieve two objectives in this study: (i) to characterize the morpho-physiological responses to low-B stresses in rapeseed genotypes at the single-cell level and (ii) to reveal the mechanism underlying low-B tolerance. New insights are provided on the function of cell wall pectin concentration in low-B tolerance in this study of contrasting genotypes of Brassica napus. We found that low-B tolerance was at least partly due to the higher mechanical strength of the CW under low-B conditions, and that the variations in CW properties endowed by pectin a key role in genotypic differences in the tolerance of oilseed rape to low-B stresses at both the single-cell and the plant level.
Results
Growth performance of suspension cells in rapeseed genotypes
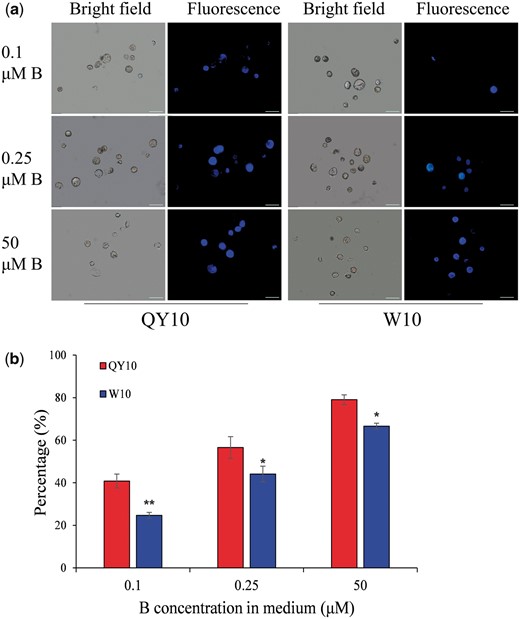
In the presence of 50 μΜ B (12 d), living cells with green fluorescence presented appropriate size and regular spherical morphology (30 ± 10 μm) (Fig. 1a). However, under low-B (0.25 or 0.1 μM, 12 d) conditions, the suspension cells showed severe developmental defects, including malformed morphology and obvious plasmolysis, particularly in the low-B-sensitive genotype ‘W10’ (Fig. 1a, Supplementary Fig. S1). After growth under 50 μM B for 12 d, more than 80% of the suspension cells of both ‘QY10’ and ‘W10’ were viable, exhibiting green fluorescence. However, their cell survival rates decreased to 57.0 and 44.2%, respectively, in 0.25 μM B, which further decreased to 37.3 and 26.4% in 0.1 μM B (Fig. 1b, c). Moreover, the cell numbers of ‘QY10’ and ‘W10’ were also observably reduced under B limitations, particularly of ‘W10’ in 0.1 μM B (Fig. 1b, d). Analysis using inductively coupled plasma mass spectrometry (ICP-MS) showed that B concentrations were higher in ‘QY10’ than in ‘W10’ under low B (Fig. 2a), although the difference was not statistically significant. Additionally, the expression of the boric acid channel gene BnaNIP5;1 s was significantly higher in ‘QY10’ than in ‘W10’ under low-B conditions (Fig. 2b) in qRT-PCR assays. The above results indicated that B conferred suspension cells with normal morphology, high viability and proliferation rates, and morphological characterizations and B concentrations of single cells directly revealed that ‘W10’ was more susceptible to B deficiency than ‘QY10’.
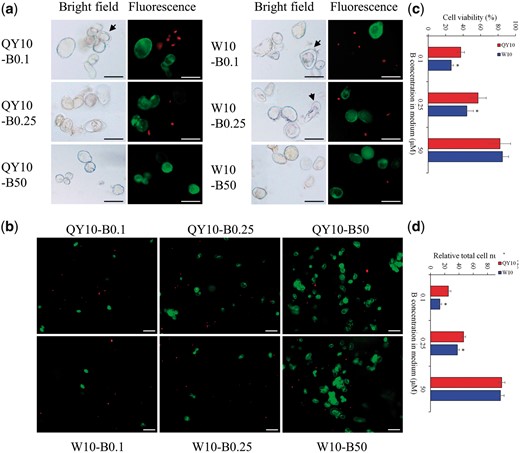
Viability of suspension cells of Brassica napus genotypes ‘QY10’ and ‘W10’ after long-term culture (12 d) in 0.1, 0.25 and 50 μM B. (a) Representative images depict low-B-induced changes in cell morphology and viability. Green staining with fluorescein diacetate denotes live cells, and red staining with propidium iodide indicates dead cells. Arrows indicate plasmolysis. Scale bars, 50 μm. (b) Overview of suspension cell viabilities. Scale bars, 100 μm. (c) Cell viability rate. (d) Total cell number. Values denote the mean (n = 8), and error bars denote the standard error. *Significant difference compared between two genotypes with the same treatment at P < 0.05 (Tukey’s test).
Boron (B) concentrations and expression of BnaNIP5;1s in suspension cells of Brassica napus genotypes ‘QY10’ and ‘W10’. Suspension cells were cultured in 50, 0.25 and 0.1 µM B for 12 d. (a) B concentrations of suspension cells. Values denote the mean (n = 4). (b) Expression of BnaNIP5;1s in suspension cells. Values denote the mean (n = 3) and error bars the standard error. *Significant difference at P < 0.05 (Duncan’s test).
Subsequently, electron microscopic analyses were performed to further characterize the growth performance of suspension cells. After a long period of low-B treatment (0.1 μM, 12 d), both ‘QY10’ and ‘W10’ showed CW rupture (Fig. 3a). The cells had a more severely abnormal appearance in ‘W10’ than in ‘QY10’ under both 0.25 and 0.1 μM B conditions. Transmission electron microscope (TEM) observation showed that the CW became swollen (i.e. loosely packed) under limited B supply, particularly in ‘W10’ (Fig. 3b). Under low B, the more marked swollen and ruptured morphology of CW in ‘W10’ than in ‘QY10’ indicated that CW properties are critical for the differential tolerance of the two genotypes to low B.
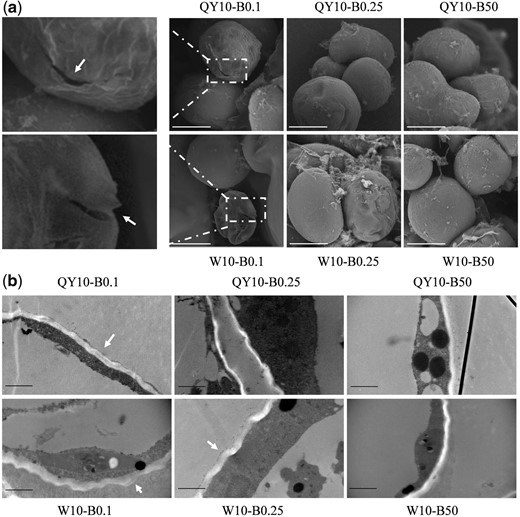
Morphological analysis of suspension cells of Brassica napus genotypes ‘QY10’ and ‘W10’ after long-term culture (12 d) in 0.1, 0.25 and 50 μM B. (a) Scanning electron microscopy of suspension cells. Arrows indicate cell rupture. Scale bar, 20 μm. (b) Transmission electronic microscopy images. Arrows indicate swollen cell walls. Scale bar, 1 μm.
Mechanical properties of CW in rapeseed genotypes
AFM has been widely used for high-resolution morphological observations and precise determinations of the nano-mechanical properties of biological samples (Kurland et al. 2012, Kasas et al. 2013, He et al. 2015). Here we used AFM for assays of CW mechanical properties. Supplementary Fig. S2 shows representative wall surface characteristics of rapeseed suspension cells. The cell surface was covered with some salt crystals, so that the cellulose microfibrils could not be clearly observed. Therefore, we isolated the CW from the suspension cells, and detected clearly visible microfibrils randomly oriented and a small height difference (Supplementary Fig. S2). The force curves of the CW were delineated (Fig. 4a, b). Sample height was up to 0.4 μm, as estimated from several scans; an example is shown in Fig. 4c. This demonstrated that in the presence of 50 μM B the average Young’s modulus of the CWs in ‘QY10’ and ‘W10’ was 61.6 ± 2.37 and 56.6 ± 4.76 GPa (n = 6), respectively (Fig. 4, d), though the difference was not significant. However, for CWs of ‘QY10’ and ‘W10’ treated with 0.25 μM B, the Young’s modulus decreased to 53.2 ± 1.29 and 40.2 ± 4.66 GPa (n = 6), respectively, and was 50.9 ± 3.87 and 39.4 ± 1.81 GPa (n = 6) in the 0.1 μM B treatment (Fig. 4d).
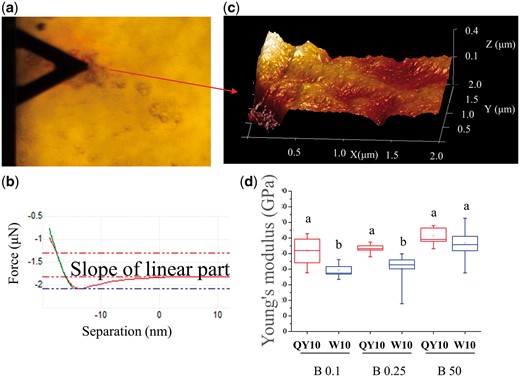
Average Young’s modulus of cell wall (CW) of suspension cells of Brassica napus genotypes ‘QY10’ and ‘W10’ after long-term culture (12 d) in 0.1, 0.25 and 50 µM B. (a) Top view showing the AFM cantilever and a fragment of the CW. (b) A typical force-indentation curve (linearized model). Young’s modulus can be extracted by extrapolating the linear portion. (c) Example of 3D topography of CW used in an experiment showing that CW thickness in Brassica napus is about 0.4 μm. (d) Young’s modulus of the CW. Boxes show the 25th–75th percentiles and whiskers the minimum and maximum values. Different letters show significant difference at P < 0.05 (Duncan’s test).
Likewise, a weakened CW could be visualized in the meristematic zone and elongation zone in plant roots of ‘W10’ grown with 0.2 μM B for 2 d (Fig. 5a), and the CW became more brittle over time (Fig. 5b), along with more obvious growth inhibition compared with ‘QY10’ (Fig. 5a–c, Supplementary Fig. S3). Combined with the results of the cell viability assays, scanning electron microscope (SEM) and TEM imaging, AFM analysis and root staining with propidium iodide (PI), we concluded that under B-deficient conditions cell death was primarily caused by the local weakening of CWs, and that differential CW mechanical properties are involved in the variation in low-B tolerance between the rapeseed genotypes at the cellular level.
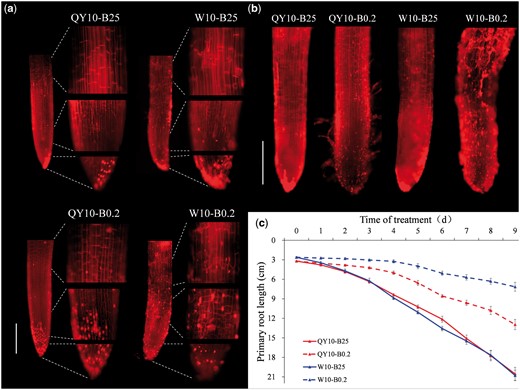
Root cell wall weakening of Brassica napus genotypes ‘QY10’ and ‘W10’. (a) Representative images of primary roots of 2-d-old seedlings stained with propidium iodide (PI) and close-up views of root cap, meristematic zone and elongation zone. (b) Representative images of primary roots of 3-d-old seedlings stained with PI. Broken cells with brittle cell walls were visualized by uptake of PI. Scale bars, 500 µm. (c) Primary root growth of genotypes ‘QY10’ and ‘W10’. Seedlings were cultured in 25 or 0.2 μM B in a hydroponic system for 10 d. Values denote the mean (n = 6) and error bars the standard error.
Pectin and RG-II dimer/monomer analysis
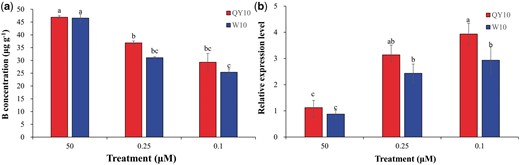
In dicots, including oilseed rape, B primarily exists in the CW pectin in the form of dRG-II-B (O’Neil et al. 2001). Thus, we speculated that CW pectin may be a key factor that caused the differential CW mechanical properties between ‘QY10’ and ‘W10’. Consistent with this assumption, after the removal of pectin the differences between the two genotypes in CW Young’s modulus disappeared (Fig. 6). The removal of pectin from the CW was further confirmed using Fourier-transform infrared spectroscopy (FTIR), which demonstrated that the characteristic pectin peaks of the cell wall without pectin (CW-P) weakened markedly compared with that of the CW (Supplementary Fig. S4). To determine how CW pectin affected CW mechanical forces in ‘QY10’ and ‘W10’, we assayed the concentrations of uronic acid (an indicator of pectin concentration; Zhu et al. 2016) in the B-efficient and -inefficient genotypes. For suspension cells cultivated under 0.1, 0.25 or 50 μM B for 12 d, we found that uronic acid concentrations in the CWs were 35.8 ± 2.26, 32.4 ± 1.19 and 31.5 ± 3.38 mgg−1 (n = 4) in ‘QY10’ and 42.7 ± 2.49, 36.9 ± 1.50 and 33.8 ± 1.92 mgg−1 (n = 4) in ‘W10’, respectively (Fig. 7a). Few marked differences in uronic acid concentrations were identified between the two genotypes in the control (50 μM B). However, low B triggered an increase in uronic acid concentrations, particularly in ‘W10’ in 0.1 μM B; thus uronic acid concentrations were significantly higher in ‘W10’ than in ‘QY10’ under the low-B condition (Fig. 7a). The FTIR test also confirmed that the characteristic peaks of pectin in ‘W10’ were relatively higher than those of ‘QY10’ irrespective of B treatment (Supplementary Fig. S4). Additionally, uronic acid concentrations in plant leaves were also markedly higher in ‘W10’ than in ‘QY10’ under B limitation (Supplementary Fig. S5).
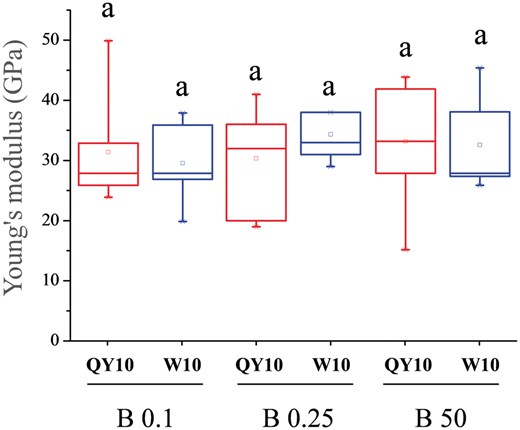
Average Young’s modulus of cell wall without pectin (CW-P) of Brassica napus genotypes ‘QY10’ and ‘W10’ suspension cells after long-term culture (12 d) in 0.1, 0.25 and 50 μM B. Boxes show 25th–75th percentile values and whiskers show minimum and maximum values. Different letters show significant difference at P < 0.05 (Duncan’s test).
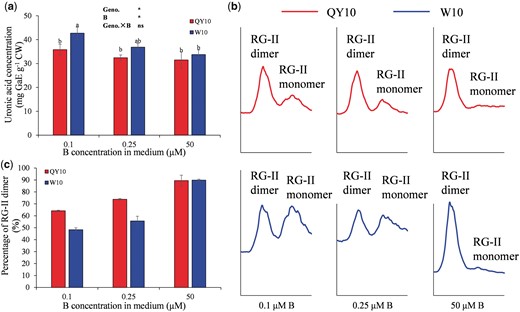
Pectin concentration and RG-II dimer/monomer profiles of suspension cells of Brassica napus genotypes ‘QY10’ and ‘W10’ after long-term culture (12 d) in 0.1, 0.25 and 50 μM B. (a) Pectin concentrations (n = 4). (b) Typical RG-II dimer/monomer profiles. (c) RG-II dimer as percentage of total RG-II (n = 3). Values denote the mean and error bars the standard error. Different letters show significant difference at P < 0.05 (Duncan’s test). *Significant difference at P < 0.05 (Duncan’s test), ns = not significant.
In vascular plants, B is known to cross-link the pectic polysaccharide RG-II in the CW (O’Neil et al. 2001). In this study, CWs of suspension cells were treated with endo-polygalacturonase and the solubilized parts were then analyzed by size-exclusion chromatography to determine the borate cross-linked RG-II dimer (dRG-II-B) and RG-II monomer (mRG-II). The borate ester cross-linked RG-II dimer of ‘QY10’ and ‘W10’ accounted for 89.5 and 89.9% of total RG-II in 50 μM B, and decreased to 73.8 and 55.6% in 0.25 μM B, and further decreased to 64.2 and 48.3% in 0.1 μM B, respectively (Fig. 7b, c). The results suggested that the weakened CWs observed in ‘W10’ were, at least in part, caused by defects in pectin structure under B deficiency.
Expression analysis of genes related to pectin biosynthesis
The observably distinct uronic acid concentrations between ‘QY10’ and ‘W10’ led us to examine the expression of genes related to pectin biosynthesis in both plants and suspension cells. UDP-d-galacturonic acid (UDP-D-GalA), the key building block of pectin, is produced from the precursor UDP-d-glucuronic acid by the action of glucuronate 4-epimerases (GAEs) (Bethke et al. 2016). A total of 18 GAE family members were identified in the allotetraploid rapeseed genome (AnAnCnCn, 2 n = 4 x = 38) (Supplementary Table S3) using a genome-wide BLASTn analysis in the Brassica Database (BRAD) (http://brassicadb.org/brad/). High-throughput digital gene expression (DGE) profiling showed that eight GAE homologues were differentially expressed in the leaves of ‘QY10’ and ‘W10’, six of which presented higher mRNA abundance in ‘W10’ than in ‘QY10’, and the abundances of another two differentially expressed genes (DEGs) with higher transcript levels in ‘QY10’ were very low (Fig. 8a). GUT1 (glucuronyltransferase 1) is responsible for the biosynthesis of pectin RG-II (O’Neill et al. 2001, Iwai et al. 2002). We identified six GUT genes in the rapeseed genome (Supplementary Table S3) and two members were differentially expressed, both of which showed higher mRNA abundances in the leaves of ‘W10’ than in those of ‘QY10’ (Fig. 8a). KDO (3-deoxy-manno-2-octulosonicacid) is a representative monosaccharide and is indicative of the amount of RG-II in pectin (Thomas et al. 1987). We identified four KDSA1 (Kdo-8-phosphate synthase) genes that are involved in the biosynthesis of KDO in rapeseed (Supplementary Fig. S3). The unique DEG showed higher transcript levels in both the leaves and roots of ‘W10’ than ‘QY10’ (Fig. 8a).
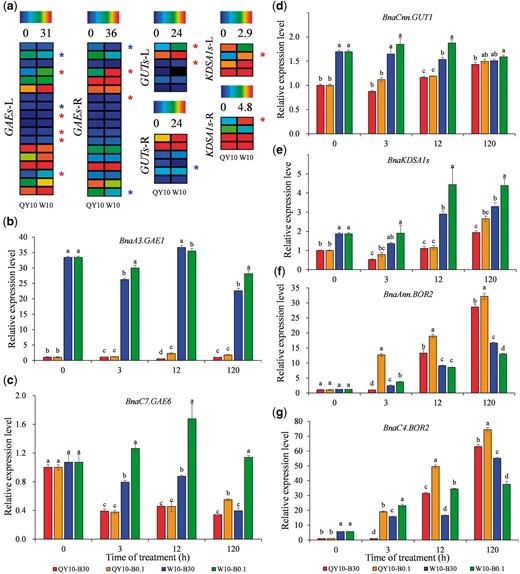
Expression profiling of genes related to pectin biosynthesis in the Brassica napus genotypes ‘QY10’ and ‘W10’. (a) Heat maps present expression of genes related to pectin biosynthesis in the two genotypes. The plants were treated with 0.25 μM B in a hydroponic culture system for 10 d. Colors from blue to red represent log2 FPKM (fragments per kilobases of exon model per million mapped reads). Asterisks represent differentially expressed genes (DEGs) in response to low B stress between ‘QY10’ and ‘W10’. Genes with significantly higher expression levels in ‘W10’ compared with ‘QY10’ are denoted by red asterisks, while blue asterisks show the reverse. (b–e) Quantitative real-time PCR results for genes related to pectin biosynthesis (BnaA3.GAE1, BnaC7.GAE6, BnaCnn.GUT1 and BnaKDSA1s) in suspension cells of ‘QY10’ and ‘W10’. (f, g) Quantitative real-time PCR results for BnaAnn.BOR2 and BnaC4.BOR2 in suspension cells of ‘QY10’ and ‘W10’. Cells were cultured in 30 μM B for 9 d, and then transferred to 30 μM and 0.1 μM B, respectively. The expression level of the indicated gene of ‘QY10’ in 30 μM at 0 h is set to 1. Bars denote the mean (n = 3) and error bars the standard error. For each time point, different letters show a significant difference at P < 0.05 (Duncan’s test).
To validate the DGE profiling results, we selected BnaA3.GAE1, BnaC7.GAE6, BnaCnn.GUT1 and BnaKDSA1s for qRT-PCR assays in suspension cells. All of these genes were induced by low B, and their mRNA abundances were higher in ‘W10’ than in ‘QY10’ (Fig. 8b–e). BOR2 is reported to transport B from symplast to apoplast for effective cross-linking of RG-II in the CW (Miwa et al. 2013); we identified two BOR2 genes in the rapeseed genome (Supplementary Table S3) whose mRNA abundances were significantly higher in ‘QY10’ than in ‘W10’ (Fig. 8f, g). This indicated that more efficient cross-linking of RG-II occurred in ‘QY10’, which corroborated the results of the dRG-II assays (Fig. 7b). The gene expression results were confirmed through an analysis of qRT-PCR in rapeseed plants (Supplementary Fig. S6). Gene expression was consistent with the physiological data showing that ‘W10’ possessed a higher uronic acid concentration in the CW, and suggested that higher B was required to maintain the mechanical properties of the CW and regenerate the CW in ‘W10’.
Effect of B supply on CW regeneration
To further understand the differential CW properties of the low-B-tolerant genotype ‘QY10’ and the low-B-sensitive genotype ‘W10’, we performed in situ CW regeneration tests. We cultured protoplasts after removal of suspension cell CWs, and CW regeneration was observed using a wall-specific fluorescent dye (Fluorescent Brightener 28) (Fig. 9a). The CW grew much faster in 50 μM B than in 0.25 and 0.1 μM B, and the CW of ‘QY10’ grew faster than ‘W10’. Under 50 μM B for 3 d, fluorescence spread over the entire protoplast surface in both ‘QY10’ and ‘W10’ (Fig. 9a). The regeneration ratios of protoplasts with a complete CW to total protoplasts were 79.0% (‘QY10’) and 66.6% (‘W10’) in 50 μM B, but only 56.6% (‘QY10’) and 44.1% (‘W10’) in 0.25 μM B and 40.8% (‘QY10’) and 24.7% (‘W10’) in 0.1 μM B (Fig. 9b). Taken together, the results suggested that B supply exerted a dominant effect on CW regeneration from protoplasts, and ‘QY10’ showed more efficient regeneration of a complete CW than ‘W10’, specifically under low-B conditions.
Confocal microscopic analysis of Brassica napus ‘QY10’ and ‘W10’ suspension cells following the time course of cell wall (CW) regeneration. Cells were cultured in 50 μM B for 9 d, and protoplasts were then obtained by removal of the CWs of rapeseed suspension cells. The protoplasts were transferred to 0.1, 0.25, 50 μM B for 3 d for CW regeneration. (a) Overview of CW regeneration at 3 d. Scale bars, 50 μm. (b) Ratio of cells with completely regenerated CW to total protoplasts. Values denote the mean (n = 8) and error bars the standard error. *, **Significant difference between the two genotypes with the same treatment at P < 0.05 and P < 0.01 (Tukey’s test), respectively.
Discussion
The CWs of dicot species consist of a cellulose-xyloglucan framework embedded in a pectin gel (Carpita 1996). Many previous studies have focused on the polysaccharide wall and inorganic elements. As a negatively charged CW polysaccharide, pectin provides binding sites for many cations (e.g. Ca2+, Cd2+, Cu2+ and Fe2+) (Colzi et al. 2012, Chen et al. 2013, Voxeur and Höfte 2016). The degree of methylation of pectin has been reported to affect aluminum (Al) resistance among maize genotypes (Eticha et al. 2005). Pectin also has an impact on the availability of negatively charged phosphate to the aerial parts of plants through the promotion of pectin remobilization from root CWs (Zhu et al. 2015). Here we found an increase in CW pectin concentration under limited B supply (Fig. 7a, Supplementary Fig. S5B), similar to the finding of more abundant pectin in CWs of maize roots under B deprivation (Yu et al. 2002). In both suspension cells and plant systems, CW pectin concentrations were higher in ‘W10’ than in ‘QY10’ (Fig. 7a, Supplementary Fig. S5B), which was supported by the analyses of gene expression (Fig. 8, Supplementary Fig. S6). In nature, pectic RG-II occurs both in dimeric (dRG-II) and monomeric (mRG-II) forms in CWs, whereas with sufficient B mRG-II was not detected (Matoh et al. 2000). Here, RG-II dimer/monomer measurement revealed that ‘W10’ possessed a higher mRG-II ratio (the ratio of mRG-II to total RG-II) in the CW than ‘QY10’ under B limitations (Fig. 7b, c).
Previous studies have revealed that CW rupture is attributed to the local weakening of CWs (defective plasmoptysis) or an increase in turgor pressure (osmotic plasmoptysis) (Fleischer et al. 1998). Here we found that suspension cells presented thicker and more loosely packed CWs (i.e. swollen CWs) under B deficiency, particularly in ‘W10’ (Fig. 3b). Given that the suspension cells were more inclined to undergo plasmolysis (Fig. 1a, Supplementary Fig. S1B) under low B, we assumed that CW rupture arose from local weakening of CWs, not an increase in turgor pressure. Through the AFM tests, we identified that the low-B-tolerant genotype ‘QY10’ had higher Young’s moduli under B-limiting supply (Fig. 4c, d), and this finding was consistent with the micro-observation that the CW of ‘W10’ did not appear to be as tightly packed as ‘QY10’ and that ‘W10’ was more easily ruptured under low-B conditions (Fig. 3). Furthermore, the plant root CW weakening and growth defect were also more severe in ‘W10’ (Fig. 5, Supplementary Fig. S3). Taken together, these results suggested that low-B-induced local weakening of the CW was mainly responsible for cell rupture in the low-B-sensitive genotype ‘W10’.
Although we paid much more attention to the relative differences in mechanical properties of CWs between the B-efficient and -inefficient genotypes of rapeseed, we also found that the absolute values of Young’s modulus in the present study were obviously inconsistent with previous results on pear fruits (Zdunek et al. 2016). We assumed that the great discrepancy among different plant species can be attributed to the following factors. (i) The mechanical properties of CWs show a wide range among different plant species. It is observed that elastic moduli range from as high as 15 GPa for the primary CWs of wood, through 0.4 GPa, for CWs of the shoots of seedlings of white spruce, to 0.3 GPa for CWs of green algae (Marshall and Dumbroff, 1999; Gindl and Gupta, 2002; Wei and Lintilhac, 2007). (ii) Even for the same plant species, the mechanical properties of CWs are strongly influenced by assay methods, and tip geometry has a key effect on the mechanical properties of CWs. The mean Young’s modulus for single tomato cells was found to be about 2.3 GPa in mannitol solution (Wang et al. 2004; Dintwa et al. 2011). Others reported that Young’s modulus for single tomato cells was roughly 100 kPa using a sharp tip (ScanAsyst Fluid, nominal R = 20 nm) and 20 kPa using a less sharp tip (R = 10,000 nm) (Zdunek and Kurenda 2013). (iii) In addition, due to the great difficulty in fixing CWs of suspension cells in the liquid, we measured the mechanical force using air-dried samples according to the method of He et al. (2015) and Ma et al. (2016), which led to higher values of Young’s modulus than those of bio-samples assayed in water or mannitol solution.
Recent studies have indicated that CW mechanics are correlated with changes in pectin matrix chemistry (Peaucelle et al. 2011, Peaucelle et al. 2012, Braybrook et al. 2012). The dimerization of two mRG-II molecules by B plays a key role in maintaining mechanical strength of plant CWs (Caffall and Mohnen 2009). According to the analysis above, we hypothesized that the more inadequate levels of borate-cross-linked RG-II resulted in the weakened CWs of the low-B-sensitive genotype ‘W10’. Consistent with this finding, the differences in mechanical force between the CWs of ‘QY10’ and ‘W10’ were diminished after the removal of pectin (Fig. 6). Taking the above results into consideration, this suggested that pectin, as a load-bearing material in CW, contributes to the genotypic differential tolerance of oilseed rape to low-B stresses at both the single cell and plant levels.
The growth performance of curved and thickened leaves, malformed and ruptured cells, and swollen CWs has been observed in mutants in which various aspects of RG-II/B dimer formation are disrupted, although much B is available (O’Neill et al. 2001, Ahn et al. 2006, Mohnen 2008, Reboul et al. 2011). In the present study, over-abundance of pectin induced by deficient B led to similar phenotypes in the low-B-sensitive genotype ‘W10’ (Figs. 1a, 3b, 5a, Supplementary Fig. S5A), which suggested that only when B and RG-II cross-link precisely to maintain the normal structure of pectic networks can plant CWs grow and develop normally. To test this hypothesis, we conducted a CW regeneration test with suspension cells. The mechanisms underlying CW regeneration remain elusive, although much effort has been made to understand them. Cooper et al. (1994) found that 3,4-dehydroproline inhibited CW regeneration in tobacco, and He et al. (2015) reported that Si potentially improves CW regeneration in rice. Based on our studies of CW regeneration, we found that CW assembly was stunted under B deficiency (Fig. 9), most likely due to a failure in the cross-linking of B and pectin that is newly synthesized. Protoplasts of ‘QY10’ could assemble an intact CW with less B requirement compared with ‘W10’ (Fig. 9), which was consistent with the result that ‘QY10’, with less pectin content, possessed stronger tolerance of low B. Abnormal CW assembly results in abnormal structural and functional properties of the CW (Cooper et al. 1994), which may be the reason for the hypogenetic root and brittle leaves of ‘W10’ under B limitations (Fig. 5, Supplementary Figs. S3, S5).
In our study, we revealed that B exerted an important effect on the intrinsic mechanical properties of the CW mainly through interaction with RG-II, considering that the genotypic differences were diminished when pectin was removed (Fig. 6). However, the physical properties of the whole cell may also be influenced by membrane damage or wall–membrane interactions because detached plasma membranes (PMs) were observed in ‘W10’ under B deficiency (Fig. 1a, Supplementary Fig. S1). Pectin plays key roles not only in CW mechanics but also in the CW–PM interface (Kohorn 2000, Hänsch and Mendel 2009). Voxeur and Fry (2014) have revealed that B plays a structural role in the PM in rose. Goldbach and Wimmer (2007) reported that the mechanical cascade of signals on CWs caused by B deficiency may extend into the cytoplasm via the CW–PM–cytoskeleton continuum, with the potential involvement of arabinogalactan proteins (AGPs). Thus, the results described above highlight the need for in-depth dissection of the roles of B and primary CW pectin in PM integrity in the future studies.
Low-B tolerance, i.e. the capacity to maintain normal growth under low-B stresses, is a complex quantitative trait that is governed by multiple genes (Zhang et al. 2014). In A. thaliana, NIP5;1, NIP6;1, NIP7;1, NIP4;1 and NIP4;2 were identified as boric acid channels (Takano et al. 2006, Tanaka et al. 2008, Li et al. 2011, Di Giorgio et al. 2016) and BOR1 and BOR2 were identified as borate exporters (Takano et al. 2002, Miwa et al. 2013). To the best of our knowledge, BOR2 is the only reported protein that transports B to cross-link mRG-II (Miwa et al. 2013). The mRNA abundances of BnaNIP5;1s, BnaAnn.BOR2 and BnaC4.BOR2 were significantly higher in ‘QY10’ than in ‘W10’ (Figs. 2b, 8f, g, Supplementary Fig. S6), which was indicative of more effective B uptake and cross-linking of mRG-II in ‘QY10’. In addition to uptake and translocation, efficient B utilization is also important for tolerance of low B in plants. Therefore, the genes involved in pectin biosynthesis can also affect the effectiveness of dRG-II-B cross-linking. Here we found that the expression of pectin biosynthesis-related genes was significantly higher in the low-B-sensitive genotype ‘W10’ (Fig. 8a–e, Supplementary Fig. S6), which resulted in a higher mRG-II ratio in the CW under low-B conditions (Fig. 7c). We propose that the lower pectin content would be also a key factor in low-B tolerance, apart from the previous finding of Hua et al. (2016a) that a nodulin 26-like intrinsic protein may function as a B transporter implicated in the differential responses of rapeseed genotypes to B deficiency. Given the key role of pectin in low-B tolerance, we suggest the intriguing potential for improving low-B tolerance in rapeseed and other crop species through the genetic modification of pectin biosynthesis-related genes in the agriculture industry.
Based on the findings above, we formulated a model of how pectin regulates CW rigidity in response to low B in rapeseed suspension cells (Fig. 10). Under B sufficiency, nearly all of mRG-II monomers are cross-linked by B into dRG-II-B in the Golgi body or secretion vesicle. Following transport into the cell wall, dRG-II-B contributes to the formation of a structurally compact and solid CW. Under low B, for the low-B-tolerant genotype, some mRG-II monomers are cross-linked due to limited B supply in the medium, which results in a less structurally compact and solid CW compared with B sufficiency. In comparison with the low-B-tolerant genotype, under low-B conditions, pectin biosynthesis of the low-B-sensitive genotype is much more abundant, and the cross-linking of B and RG-II undertaken by the exporter BOR2 is weaker, both of which factors result in much more mRG-II in the CW. The impaired dRG-II-B structure makes the CW structurally unstable and more swollen. Thus, the CWs of low-B-sensitive genotypes are more easily cracked in response to low B.
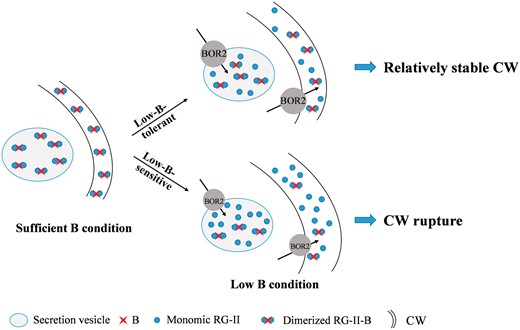
Proposed model for pectin control of cell wall (CW) rigidity in response to low B. Under sufficient B conditions, almost all RG-II monomers were cross-linked by B into dRG-II-B in the Golgi body or secretion vesicle. Following transport into the CW, dRG-II-B contributed to the formation of a structurally compact and solid CW. Under low B conditions, for the low-B-tolerant genotype, only a proportion of the RG-II monomers were cross-linked due to limited B supply in the medium, which resulted in a less structurally compact and solid CW compared with the CW under sufficient B conditions. For the low-B-sensitive genotype under B deficiency, pectin biosynthesis was much more abundant and cross-linking of B and RG-II undertaken by the exporter BOR2 was weaker, both of which resulted in much more mRG-II in the CW compared with the low-B-tolerant genotype. The impaired dRG-II-B structure made the CW structurally unstable and more swollen. Thus, the CWs of the low-B-sensitive genotype were more easily cracked in response to low B. The thickness of the CW signifies the degree of swelling.
In conclusion, based on our morpho-physiological assays, biophysical examinations and transcriptional analyses of suspension cells with contrasting low-B sensitivities, we demonstrated that the rapeseed genotypes with stronger pectin biosynthesis presented more mRG-II in the CW, and therefore the CW became more structurally unstable, and eventually the local weakening of the CW caused cell rupture. It was more difficult for rapeseed genotypes with higher pectin biosynthesis to regenerate the CW under low-B conditions. Thus, a lower pectin concentration confers greater tolerance of oilseed rape to low B through maintaining the mechanical properties of the CW. The findings above greatly enhance our understanding of the physiological and molecular mechanisms underlying the tolerance of low B in agricultural crop species.
Materials and Methods
Cell culture and plant growth
Suspension-cultured cell lines of rapeseed (cv. ‘QY10’ and ‘W10’) were established according to the following processes: plump seeds were surface-sterilized with 75% ethanol for 30 s and 0.1% mercury chloride for 12 min and then rinsed completely with sterilized water. Sterilized seeds were incubated at 24°C in the dark for 6 d in B5 medium (pH 5.8) (Gamborg et al. 1968). Hypocotyl segments (0.5–1.0 cm) were subcultured twice for the formation of embryogenic calli in modified B5 medium (induction and subculture medium; pH 5.8). The calli were transferred to 150-ml plastic Erlenmeyer flasks containing 40 ml of liquid BA medium (pH 5.8) supplemented with 2,4-D (3 mgl−1), which were placed on a rotary shaker (120 rpm) at 25°C in the dark. The liquid medium was refreshed every 3 d during culture. All chemical solutions were prepared using ultrapure water (>18.25 MΩ·cm). All reagents were purchased from Sigma-Aldrich (St. Louis, USA). The compositions of different culture media are listed in Supplementary Table S1.
Plump seeds of ‘QY10’ and ‘W10’ were surface-sterilized using 0.5% (w/v) NaClO for 10 min and rinsed thoroughly with ultrapure water. The seeds were then sown in gauze after soaking in ultrapure water for 24 h. After 5 d for germination, uniform seedlings were transplanted to black plastic containers with Hoagland and Arnon (1950) solution. Uniform seedlings were first transplanted to one-quarter-strength solution, and subsequently progressed to one-half-strength and eventually full-strength solution. The nutrient solution was refreshed every 3 d. The plants were cultured in an illuminated culture room with a temperature regime of 24/22°C (day/night), a photoperiod of 16/8 h (day/night) and a light intensity of 300–320 µmol m−2 s−1.
B treatments
For cell viability assays, scanning electronic microscopy (SEM), transmission electron microscopy (TEM) and laser scanning confocal microscopy (LSCM) imaging, quantification of B concentrations and the expression of BnaNIP5;1s, uronic acid measurements, RG-II dimerization tests, Fourier-transform infrared spectroscopy (FTIR) assays and AFM tests, the suspension cells were cultured for 12 d in liquid medium (pH 5.8) with 0.1, 0.25 or 50 μM B. To detect root CW weakening, rapeseed plants were grown in 0.2 or 25 μM B for 2–3 d. For the characterization of root architecture systems and uronic acid measurements, the plants were grown in 0.2 or 25 μM B for 12 d. For CW regeneration tests, suspension cells were cultured in 50 μM B for 9 d, and the subsequent protoplasts were obtained and transferred to 0.1, 0.25 or 50 μM B for 3 d. For expression analysis of pectin biosynthesis-related genes, suspension cells were cultured with 30 μM B for 9 d and then transferred to 0.1 or 30 μM B; the plants were grown in 0.2 or 25 μM B for 12 d. For high-throughput digital gene expression (DGE) sequencing, rapeseed plants were grown in 0.25 μM B for 10 d.
Cell viability assay
The viability of suspension cells was determined by fluorescein diacetate (FDA)–propidium iodide (PI) staining (He et al. 2013). Cells stained with FDA–PI were observed with a light/fluorescence microscope (Olympus BX51, Tokyo, Japan). Each experiment was conducted with at least eight biological replicates. Numbers of suspension cells were counted using Fiji imageJ software (http://rsbweb.nih.gov/ij/download.html).
Quantification of B concentration
Suspension cells were lyophilized using a freeze-dryer (Labcomco, Kansas City, MO, USA), and then ground to a fine powder in a carnelian mortar, weighed (0.03 g) and then added to a 50-ml centrifuge tube. B was extracted from the dry powder by shaking it in 8 ml of 1 M HCl for 2 h. The extract was filtered and then diluted 10-fold. B concentrations were determined by inductively coupled plasma mass spectrometry (ICP-MS, NexIONTM 350X; PerkinElmer, MA, USA). Each experiment was conducted with four biological replicates.
SEM and TEM imaging
Suspension cells were subjected to SEM (TM3030; Hitachi, Tokyo, Japan) and TEM (H-7650; Hitachi, Tokyo, Japan) to characterize the differences in the morphology of the cells and CWs. To ensure the reproducibility of the results, the TEM and SEM analyses were performed with at least eight biological replicates.
CW extraction and fractionation
Suspension-cultured cells only form primary CWs; these have no lignin and thus we extracted and fractionated the CWs according to the methods established by Selvendran and O’Neill (1987) and Szymanska-Chargot and Zdunek (2013) with minor modifications. Briefly, the suspension cells were collected and washed five times with ultrapure water and then ground to a fine powder and suspended in 1% SDS buffer (50 μM Tris-HCl, pH 7.2). The samples were incubated in an 80°C water bath for 15 min. The supernatant was removed and the residue was washed five times with hot ultrapure water to completely remove SDS, and then washed successively three times with 80% ethanol, twice with 50% ethanol and three times with ultrapure water at 65°C. The residue was the extracted CWs. Subsequently, 50 mM trans-1,2-diaminocyclohexane-N,N,N′,N′-tetraacetic acid (CDTA, pH 6.5, 50 ml) was used for the reaction with 1 g of CWs (wet weight) at 25°C for 10 h, and then filtered with a nylon filter (pore size 10 μm; Millipore) and the residue was extracted in 50 mM Na2CO3 (50 ml) at 25°C for 12 h. The supernatant contained pectin and the residue was the CW without pectin (CW-P). The CW and CW-P were then lyophilized using a freeze-dryer (Labcomco, Kansas City, MO, USA). Extraction of the cell wall of the young rapeseed leaves was carried out according to Ishii et al. (2001).
AFM imaging and measurement of mechanical properties of the CW and CW-P
Extracted CW and CW-P were placed on thoroughly cleaned glass coverslips using a pipette and air-dried overnight. The air-dried CW and CW-P were then imaged in ScanAsyst-Air mode using a Bruker MultiMode VIII AFM (Santa Barbara, CA, USA). The coverslip was glued onto a metal disc (15 mm diameter) and placed on the piezo scanner of an AFM. AFM imaging was conducted in ScanAsyst-Air mode using Bruker ScanAsyst-Air probes. Mechanical properties, based on Young’s modulus (Pletikapic et al. 2012; Zdunek et al. 2016), were obtained by fitting retraction curves using the Hertz model. All the AFM image analyses and Young’s modulus calculations were performed using NanoScope analysis software (Bruker). All measurements were conducted with six replicates in air with 50–60% relative humidity and each replicate was an average of 36 points in each CW and CW-P sample.
Detection of CW weakening in plant roots
Root tips were stained with 50 μg ml−1 PI for 1 min. Using LSCM (Leica Sp2, Wetzlar, Germany), the brittle cells were visualized by the uptake of PI according to Hu et al. (2016). All measurements were conducted with eight replicates.
Determination of plant root system architecture
Plant roots were imaged using a scanner (Epson Perfection V800 Photo). Root tip number, total root length, root average diameter, total surface area and root volume were measured using the software WinRHIZO Pro (Regent Instruments, QC, Canada). All measurements were conducted with six replicates.
Protoplast culture and analysis of newly formed CWs
Protoplasts were generated from rapeseed suspension cells according to a previous study (Tan et al. 2007) with modifications. Briefly, suspension cells (approximately 1.0 g wet weight) were added to 20 ml of filter-sterilized enzyme solution containing 2.5% cellulase from Trichoderma reesei ATCC 26921, 1% hemicellulase from Aspergillus niger, 0.2% pectolyase Y-23 (Kyowa Chemical, Osaka, Japan), 0.4 M mannitol, 80 mM CaCl2, 0.125 mM MgCl2 and 0.5 2-(N-morpholino) ethanesulfonic acid (MES) (pH 5.6). After 12 h of incubation at 25°C in darkness without shaking, the released protoplasts were separated from the undigested suspension cells by filtration using a 40 -μm nylon filter (Millipore, Billerica, MA, USA) and collected by centrifugation at 120 × g for 10 min. After enzyme digestion, the protoplasts were washed three times and cultured in protoplast medium (0.4 M mannitol, 80 mM CaCl2, 0.125 mM MgCl2, 0.5 mM MES and modified B5 medium by some amino acid (BA) liquid medium without sucrose, pH 5.6). The newly formed CWs were stained with 0.01% (w/v) Fluorescent Brightener 28 for 10 min. After the removal of excess dye, the stained cells were washed with protoplast medium and then observed using an Olympus BX51 microscope and a Leica Sp2 LSCM at an excitation wavelength of 492 nm and an emission wavelength of 520 nm. Each experiment was conducted with at least eight biological replicates. All reagents were purchased from Sigma-Aldrich (St. Louis, USA) unless otherwise indicated.
Uronic acid measurement
Pectin was extracted using 2 mg of lyophilized CWs of suspension cells and air-dried CWs of young rapeseed leaves according to the method of Filisetti-Cozzi and Carpita (1991). Approximately 90% of the uronic acid in the CW was derived from the GalpA residues of pectic polysaccharides (Caffall and Mohnen 2009). Thus, as an indicator of pectin concentration, the uronic acid concentration was assayed colorimetrically using m-hydroxydiphenyl according to Blumenkrantz and Asboe-Hansen (1973) with GalUA (Sigma-Aldrich, St. Louis, USA) as a standard. Each experiment was performed with four biological replicates.
RG-II dimer/monomer measurement
Isolation of RG-II and quantification of RG-II dimers/monomers were conducted according to Voxeur et al. (2011), using an evaporative light-scattering detector (ELSD). This experiment was performed with three biological samples.
FTIR of the CW and CW-P
Lyophilized CW and CW-P were analyzed with an FTIR spectrometer (Vertex 70; Bruker Optics, Ettlingen, Germany) as reported by He et al. (2015). For each treatment, three biological replicates were examined under the same conditions.
High-throughput DGE library preparation and sequencing
Roots and young leaves of the rapeseed seedlings were individually sampled with three biological replicates. Total RNA was extracted with Trizol Reagent (Takara, Shiga, Japan) and reverse-transcribed using M-MLV Reverse Transcriptase (Promega, WI, USA) according to the manufacturer’s instructions. Tag libraries from RNA samples were prepared in parallel, and then analyzed with an Illumina Hiseq 2500 (Illumina, San Diego, CA, USA), generating 50-bp single-end (SE50) reads. The sequencing data from the DGE profiling were submitted to the National Centre for Biotechnology Information (NCBI) (http://www.ncbi.nlm.nih.gov/) with the Bioproject PRJNA340053. High-quality clean reads were mapped to the B. napus ‘Darmor-bzh’ transcriptome reference, and then the mRNA abundances of the unigenes, identified by TopHat (http://ccb.jhu.edu/software/tophat/index.shtml) and Cufflinks (http://cole-trapnell-lab.github.io/cufflinks/) (Trapnell et al. 2012), were normalized by the method of fragments per kilobase of exon model per million mapped reads (FPKM) (Trapnell et al. 2010). The DEGs were defined as genes with a P-value and false discovery rate (FDR) less than 0.05 (Secco et al. 2013). Multiexperiment Viewer (MeV; https://sourceforge.net/projects/mev-tm4/ files/mev-tm4/MeV%204.9.0/) (Eisen et al. 1998) was used to delineate heat maps based on the DGE results.
Total RNA extraction and gene expression analysis
Total RNA of the suspension cells was extracted according to methods used for tobacco BY-2 cells (Sun et al. 2015). Quantitative real-time PCR (qRT-PCR) assays for the detection of the relative expression of genes were performed using SYBR Premix Ex Taq™ II (Takara, Shiga, Japan) and the CFX96™ Real-Time PCR Detection System (Bio-Rad, Hercules, CA, USA). Gene sequences were obtained from the Brassica Database (BRAD) (http://brassicadb.org/brad) and primers used for the quantification were designed using Primer Premier 5.0. The primers are shown in Supplementary Table S2, and the housekeeping gene actin was used as an internal control. The PCR profiles were as follows: 95°C for 1 min, 40 cycles of 95°C for 5 s, 60°C for 30 s and 72°C for 30 s; melting curve, 95°C for 15 s, 65–95°C (+0.5°C/cycle) for 15 s. All experiments were performed in triplicate.
Statistical analysis
Differences among B treatments and genotypes and the interaction between B treatments and genotypes were determined using Duncan’s test. Differences between genotypes were determined through Tukey’s tests. Statistical Product and Service Solutions 17.0 (SPSS, Chicago, IL, USA) software was used for statistical analysis.
Supplementary Data
Supplementary Data are available at PCP Online.
Abbreviations
- AFM
atomic force microscopy
- B
boron
- CW
cell wall
- CW-P
cell wall without pectin
- DEG
differentially expressed gene
- DGE
digital gene expression
- dRG-II-B
dimeric rhamnogalacturonan II
- FDA
fluorescein diacetate
- FPKM
fragments per kilobase of exon model per million mapped reads
- FTIR
Fourier-transform infrared spectroscopy
- ICP-MS
inductively coupled plasma mass spectrometry
- LSCM
laser scanning confocal microscopy
- mRG-II
monomeric rhamnogalacturonan II
- PI
propidium iodide
- PM
plasma membrane
- SEM
scanning electronic microscope
- TEM
transmission electron microscope
Acknowledgements
We thank Professor Lijun Wang of the Microelement Research Centre, Huazhong Agricultural University, for his assistance with the mechanical strength analysis.
Funding
This work was supported by the National Natural Science Foundation of China (grant numbers 31372129 and 31572185) and the National Key Research and Development Program of China (grant number 2016YFD0200108).
Disclosures
The authors have no conflicts of interest to declare.
