


Abstract
Alternative splicing (AS) is common in higher eukaryotes and plays an important role in gene posttranscriptional regulation. It has been suggested that AS varies dramatically among species, tissues, and duplicated gene families of different sizes. However, the genomic forces that govern AS variation remain poorly understood. Here, through genome-wide identification of AS events in the soybean (Glycine max) genome using high-throughput RNA sequencing of 28 samples from different developmental stages, we found that more than 63% of multiexonic genes underwent AS. More AS events occurred in the younger developmental stages than in the older developmental stages for the same type of tissue, and the four main AS types, exon skipping, intron retention, alternative donor sites, and alternative acceptor sites, exhibited different characteristics. Global computational analysis demonstrated that the variations of AS frequency and AS types were significantly correlated with the changes of gene features and gene transcriptional level. Further investigation suggested that the decrease of AS within the genome-wide duplicated genes were due to the diminution of intron length, exon number, and transcriptional level. Altogether, our study revealed that a large number of genes were alternatively spliced in the soybean genome and that variations in gene structure and transcriptional level may play important roles in regulating AS.
INTRODUCTION
Alternative splicing (AS) is an important posttranscriptional regulatory mechanism for modulating gene expression and functional diversity in higher eukaryotes (Lareau et al., 2004), and it is commonly found in both animal and plant species. Previous EST cDNA-based analysis led to the identification of a number of AS events in different species. Along with technological advances, high-throughput sequencing provides huge data sets for deep analysis and greatly increases the ability to explore AS. For example, an in-depth analysis using RNA-seq suggested that 92 to 94% of human genes are subject to AS (Wang et al., 2008), a level 2- to 3-fold higher than the previous estimation (Mironov et al., 1999; Modrek et al., 2001). It has been reported that 61% of Arabidopsis thaliana genes and 21.2 to 33% of rice (Oryza sativa) genes are alternatively spliced (G.J. Zhang et al., 2010; Marquez et al., 2012).
AS may be associated with 15% of genetic diseases in humans (Krawczak et al., 1992) and is involved in a range of functions in plants, such as growth, development, signal transduction, and responses to biotic and abiotic stress (Dinesh-Kumar and Baker, 2000; Jordan et al., 2002; Kazan, 2003; Balasubramanian et al., 2006; Egawa et al., 2006; Iida and Go, 2006). However, not all of the AS events are functional (Modrek and Lee, 2002; Lewis et al., 2003). It was estimated that approximately one-third of AS events could produce premature termination codons (PTCs) (Lewis et al., 2003; Wang and Brendel, 2006), and these isoforms are potentially targeted for degradation by the nonsense-mediated mRNA decay system (Kalyna et al., 2012; Drechsel et al., 2013). In addition to causing PTCs, a large number of AS variations are predicted to alter the coding sequence, as AS variations occur within the protein coding regions (Modrek and Lee, 2002; Campbell et al., 2006).
Relative to the predominant transcript isoform, AS can be mainly classified as exon skipping (ES), intron retention (IR), alternative donor sites (AD), and alternative acceptor sites (AA) (Black, 2003). In animals and yeast, ES is the most common AS form and IR is the least common (Modrek and Lee, 2002; Sultan et al., 2008; Wang et al., 2008), whereas in plants, IR is the primary form and ES only accounts for a small portion of AS (Iida and Go, 2006; Wang and Brendel, 2006; Filichkin et al., 2010; Marquez et al., 2012). The differences in the frequencies of the AS types between plants and animals may be due to differences in their pre-mRNA splicing (Reddy, 2007). Usually, organisms that have small introns use an intron definition splicing mechanism, which preferentially leads to IR, whereas those organisms with large introns use an exon definition mechanism, which results in ES (Nakai and Sakamoto, 1994).
Some AS events are shared among different species (Modrek and Lee, 2003; Sorek et al., 2004; Birzele et al., 2008), indicating their universally conserved functions. Nevertheless, a number of AS events have been identified to be specific for individual species. Studies showed that predominant splice variants are more conserved than rare variants, and species-specific AS events may be important for a gene to gain new functions, although many of them have unknown or even no function (Kan et al., 2002; Modrek and Lee, 2003; Thanaraj et al., 2003; Lareau et al., 2004). Numerous studies have attempted to identify the regulators that affect AS (Modrek and Lee, 2002; Buratti and Baralle, 2004; Chasin, 2007; Luco et al., 2011). Typically, short conserved sequences 10 nucleotides in length located in either the exons or introns that stimulate (exonic/intronic splicing enhancers) or inhibit (exonic/intronic splicing silencers) splice site usage (Long and Caceres, 2009; Han et al., 2010) are thought to be the predominant regulators of AS. Other factors may also influence AS, such as the promoter used to drive transcription (Cramer et al., 1997, 1999; Pagani et al., 2003), chromatin modifications (Batsché et al., 2006; Schor et al., 2009; Luco et al., 2010), changes in transcription or the chromatin environment (Kornblihtt et al., 2004), hormone-responsive elements (Auboeuf et al., 2002), and the recruitment of different transcription factors or coactivators to the promoters (Nogues et al., 2002; Auboeuf et al., 2004a, 2004b). However, the mechanisms of AS are complex, and many questions remain. For instance, what are the underlying factors that influence the variations of AS frequency and AS type among tissues? Thus far, the mechanisms that determine the activation and inhibition of different splice forms remain poorly understood (Blencowe, 2006).
Gene duplication (GD) and subsequent divergence are the major evolutionary mechanisms that contribute to genome evolution and gain of novel gene functions (Flagel and Wendel, 2009; Innan and Kondrashov, 2010). Changes in the AS patterns are important for the evolution of GD pairs. The majority of studies have reported that GD decreases the AS frequency, as the number of AS isoforms per locus in singleton genes is higher than in duplicated genes and small gene families have a larger average number of AS isoforms per locus than the large gene families (Kopelman et al., 2005; Su et al., 2006; Talavera et al., 2007; P.G. Zhang et al., 2010). However, some studies have revealed that duplicated genes or paralogous protein family genes tend to have more alternative isoforms than singletons (Jin et al., 2008; Lin et al., 2008; Roux and Robinson-Rechavi, 2011). Another study showed an inverse correlation among recently duplicated genes but a positive correlation among anciently duplicated genes (Chen et al., 2011). Thus far, the cause of AS divergence between the duplicated genes remains unclear.
Soybean (Glycine max) is one of the most economically important legume species. Previous studies have shown that soybean has undergone at least two polyploidization or whole-genome duplication (WGD) events within the last 60 million years (Shoemaker et al., 2006; Schlueter et al., 2007). As a result, ∼75% of the genes are present in more than one copy in the soybean genome (Schmutz et al., 2010). It is hypothesized that a large number of the duplicated gene pairs are highly divergent (Lin et al., 2010; Roulin et al., 2012). Nevertheless, the landscape of AS and the changes in AS between the genes duplicated by WGD have not been explored in soybean. Here, using a genome-wide analysis of high throughput RNA-seq data from 28 developing tissues, we found that a large number of genes were alternatively spliced in soybean. Global dissection revealed that the changes in gene structure and genomic features were the main factors governing AS variation and the AS decrease in WGD-derived genes.
RESULTS
Overview of RNA-seq Data
To explore AS at a genome-wide level and to assess the factors that influence AS in soybean, we performed high-throughput RNA-seq using the Illumina Highseq-2000 sequencing technology for 28 samples, including cotyledon, root, shoot, leaf, flower, pod, and seed tissues at the different developmental stages of germination, trefoil, flowering, seed development, and plant senescence (Supplemental Figure 1). In total, ∼1811 million reads (∼181 Gb) were obtained, with an average of 64.7 million reads (∼6.47 Gb) per sample (Figure 1A; Supplemental Table 1). After the adaptor sequences were trimmed and the low-quality reads were filtered out, 1442 million high-quality reads, corresponding to 79.64% of the total reads, were aligned to the soybean genome using TopHat2 (Trapnell et al., 2009, 2012). Among the mapped reads, ∼89.37% were uniquely aligned, and the remaining 11% were mapped to multiple loci (Figure 1A; Supplemental Table 1).
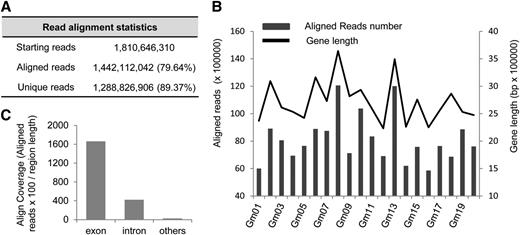
Summary of the Read Alignments in This Study.
(A) The table shows the statistics of the aligned reads to the soybean genome.
(B) The aligned reads number and the gene length across each chromosome. The columns represent the read number, and the line represents the gene length.
(C) The distribution of reads based on soybean genome annotation.
The aligned read number for a particular chromosome was highly associated with the total gene length in this chromosome (Figure 1B). An overview of the distribution of the aligned reads in 100-kb contiguous subregions along each of the 20 chromosomes showed that most of the reads were located in the chromosome arm regions and were closely associated with the gene distribution and genetic recombination (GR) rates (Supplemental Figure 2). Further investigations showed that the majority of the mapped reads were in exonic regions, and the coverage was ∼1600× per sample. Additionally, approximately one-fifth of the aligned reads were mapped to intronic regions, and a small number of the reads were mapped to nongene regions (Figure 1C). The aligned reads that were located in exonic and intronic regions were used to detect gene expression and to identify the AS events for each gene.
Large Numbers of AS Genes Are Identified in the Soybean Genome
Cufflinks (Trapnell et al., 2010) was used to assemble the transcripts and to estimate the transcriptional expression. The AS events were identified using ASTALAVISTA (Foissac and Sammeth, 2007). In total, 45,083 annotated genes in the soybean genome were expressed in the 28 samples. In the soybean genome annotation, 8355 genes, which accounted for 18.53% of the expressed genes, were predicted to be subject to AS. In our analysis, a total of 154,469 AS events were identified. The AS events were distributed in 23,764 genes, which accounted for 52.71% of the total expressed genes (Figure 2A). Only 7130 genes were identified as AS genes by both our analysis and the genome annotation. A large number of AS genes (16,634 genes) were newly identified in this study. Moreover, among the 45,083 expressed genes, only 37,677 had two or more exons (referred to as multiexonic genes). Therefore, in this aspect, ∼63% of the multiexonic genes were alternatively spliced in soybean (Figure 2A).
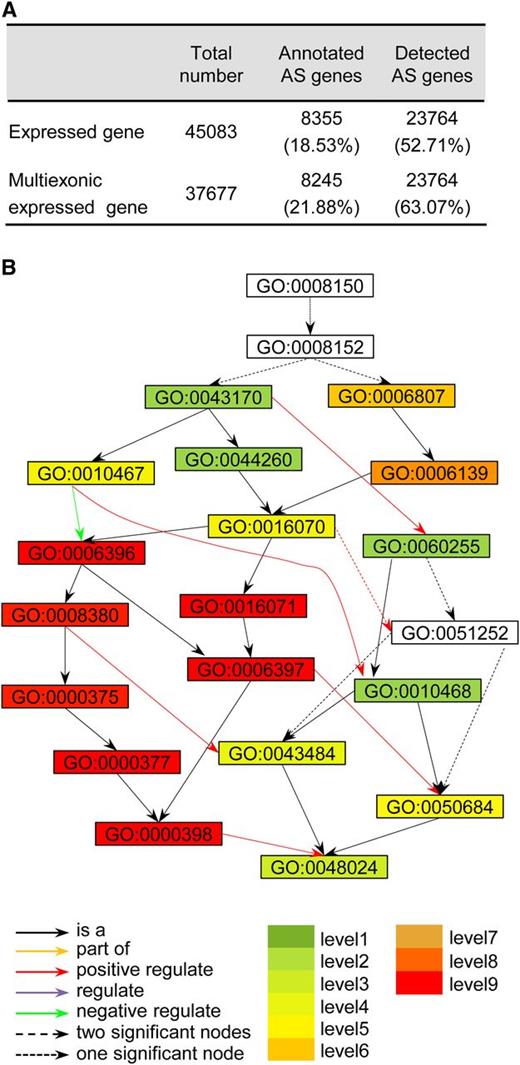
Numbers of AS Genes and GO Analysis of Continuously Alternatively Spliced Genes.
(A) Statistics of AS genes according to genome annotation and detected in this study.
(B) Enriched GO terms among AS genes that were alternatively spliced in all tissues examined (details in Supplemental Figure 6): biological process (GO:0008150); metabolic process (GO:0008152); macromolecule metabolic process (GO:0043170); nitrogen compound metabolic process (GO:0006807); gene expression (GO:0010467); cellular macromolecule metabolic process (GO:0044260); nucleobase, nucleoside, nucleotide, and nucleic acid metabolic process (GO:0006139); RNA metabolic process (GO:0016070); RNA processing (GO:0006396); regulation of macromolecule metabolic process (GO:0060255); RNA splicing (GO:0008380); mRNA metabolic process (GO:0016071); regulation of RNA metabolic process (GO:0051252); mRNA processing (GO:0006397); RNA splicing, via transesterification reactions (GO:0000375); regulation of gene expression (GO:0010468); RNA splicing, via transesterification reactions with bulged adenosine as nucleophile (GO:0000377); regulation of RNA splicing (GO:0043484); regulation of mRNA processing (GO:0050684); nuclear mRNA splicing via spliceosome (GO:0000398); and regulation of nuclear RNA splicing via spliceosome (GO:0048024).
To check the accuracy of our identification, 109 AS genes distributed across the 20 chromosomes (Supplemental Figure 3A) were used for validation. These 109 AS genes contained 116 events, including 43 IR, 31 AA, 17 AD, and 25 ES (Supplemental Figure 3B). Fragments containing the AS events were amplified using RT-PCR (primer information is listed in Supplemental Table 2) and were submitted for sequencing using the Illumina Miseq analyzer. After quality control checks, the raw sequencing reads were aligned to the sequences of the validation genes to check the corresponding AS events, such as IR in Glyma10g31240 (Supplemental Figure 3C), ES in Glyma03g00970 (Supplemental Figure 3D), AD in Glyma03g36910 (Supplemental Figure 3E), and AA in Glyma03g28320 (Supplemental Figure 3F). Of the 116 AS events, 109 (94%) were supported by our validation experiments. Our validation results further confirmed that a large number of AS events occur in soybean.
The number of AS genes varied widely among the individual tissues. There were more AS genes in the meristem or tissues from younger developmental stages, and the number of AS genes decreased with plant development in the same organ (Supplemental Figure 4A). We presumed that this unequal distribution might be associated with the total number of expressed genes in the individual tissues. A correlation analysis using data from 28 individual samples showed that the AS gene number was highly correlated with the expressed gene number (Supplemental Figure 4B). To eliminate the bias effect of the expressed gene number, we then calculated the AS gene ratio (AS gene number/total expressed gene number) for each tissue. Interestingly, we found that the AS gene ratios were also higher in the meristem and younger tissues (Supplemental Figure 4C). Further detection suggested that the AS frequency might be associated with the level of gene expression (Supplemental Figure 4D).
Previous studies had indicated that many AS events would change the coding frame and potentially result in nonsense-mediated mRNA decay (Modrek and Lee, 2002; Lewis et al., 2003; Wang and Brendel, 2006; Kalyna et al., 2012; Drechsel et al., 2013). Our analysis showed that ∼10% of the AS events shifted the transcript frame, creating what we term frameshift transcripts. More intriguingly, the frameshift transcript number was also positively correlated with the level of gene expression (Supplemental Figure 4E). We also characterized the domains in each protein isoform of individual genes by RPS-BLAST using the CDD–45746 PSSMs as database (Marchler-Bauer et al., 2011). Consistent with the study in rice and Arabidopsis (Chen et al., 2011), our results demonstrated that the AS genes had more domains than the non-AS genes (Supplemental Figure 5A). Comparison of the genic features between the AS and non-AS genes revealed that AS genes and their exons were longer (Supplemental Figures 5B and 5D) and that AS genes had more exons (Supplemental Figure 5C), which indicated that the variation in domain number between AS genes and non-AS genes may be related to the gene structure. Further investigation showed that within the AS genes, the domain number was also positively correlated with gene length, exon number, and exon length (Supplemental Table 3).
Among the 23,764 AS genes, 1440 were found to be alternatively spliced in all of the samples in this study. To detect the biological processes in which these continuously alternatively spliced genes might be involved, the Gene Ontology (GO) term enrichment was investigated with agriGO (Du et al., 2010) using all soybean genes as the background. The results (Supplemental Figure 6) showed that these AS genes were highly enriched in processes related to RNA splicing, such as mRNA processing, RNA processing, RNA splicing, and nuclear mRNA splicing (Figure 2B).
Characteristics of Different AS Types
Of the 154,469 AS events that we identified, IR represented 26.47% of the total and was the most abundant type (Figure 3A), followed by AA (24.89%), AD (11.28%), and ES (8.89%). The results were in accord with the observations in Arabidopsis (Wang and Brendel, 2006; Filichkin et al., 2010; Marquez et al., 2012). Of all the AS events, 99,847 were identified through comparisons of transcript isoforms within individual tissues (referred to as within-tissue). The other 54,622 events were identified through comparisons of the transcript isoforms among different tissues (referred to as among-tissue) (Supplemental Figure 7A). These numbers indicate that approximately one-third of the AS events were tissue differential AS events. The ratios of the four AS types were also different when compared within tissues and among tissues. Of the within-tissue AS events, AA was the most abundant, whereas of the among-tissue AS events, IR was the most common. Almost the same numbers of ES and AD events were identified in comparisons among tissues, but more AD events were identified in comparisons within tissues (Supplemental Figures 7B and 7C). The four AS types changed remarkably in the individual tissues. Overall, they had relatively lower numbers in the tissues from older developmental stages than those from younger stages (Supplemental Figure 8).
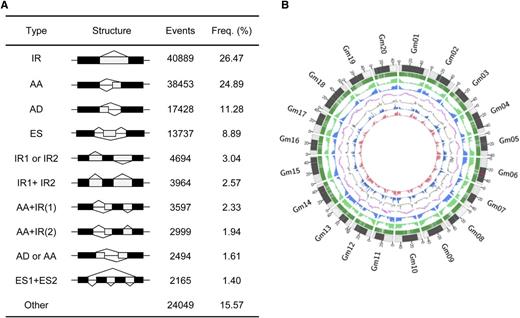
Statistics of the Different AS Events and AS Distribution in the Soybean Genome.
(A) Statistics of the different AS types.
(B) AS, transcriptome profiling, and genomic feature distribution across the soybean genome. From outside to inside, each circle represents the chromosome structure, gene location, gene number, gene length, GC content, and GR rates, aligned reads number and AS event number.
The usage of splice sites was another important feature for AS. Among the AS events detected in this study, a total of 121,048 GT-AG splice sites (97.17%), 2848 GC-AG splice sites (2.29%), 288 AT-AC splice sites (0.23%), and 390 splice sites of other types (0.31%) were identified. The GT-AG site represented the highest proportion of all of the four AS types, whereas GC-AG was the second most common splice site (Supplemental Figure 9), which is consistent with findings from other species (Thanaraj and Clark, 2001; Churbanov et al., 2008; Filichkin et al., 2010). However, the ratios of splice site usage showed divergence among the different AS types. The GC-AG splice site in AD was more common than the other three types (Supplemental Figure 9). In both ES and AA, the proportion of GT-AG was ∼98%, which was higher than that in IR and AD (∼95%). Another interesting phenomenon was that in the soybean genome, ∼4.13% of the splice sites were AT-AC (Supplemental Figure 9E), and this splice site was used by few AS events (Supplemental Figure 9), indicating that AT-AC might be conserved to inhibit AS.
The event length of the different AS types also showed divergence. For IR, the retained intron length ranged from 51 to 7080 bp, with the largest number of events at 81 bp (Supplemental Figure 10A), which was shorter than that in rice (G.J. Zhang et al., 2010). Our analysis also showed that the most frequent AA length was 3 bp (Supplemental Figure 10C), and the most frequent AD length was 4 bp (Supplemental Figure 10D), which is in agreement with previous findings from other species (Zavolan et al., 2003; Akerman and Mandel-Gutfreund, 2006; Campbell et al., 2006). The skipping length in ES peaked at ∼73 bp, but this peak was not as sharp as the other types of AS events. At the same time, unlike the smooth curves of the other types, the skipping length varied widely (Supplemental Figure 10B).
AS Frequency Is Correlated with Intron Length, Exon Number, Gene Transcriptional Level, GC Content, and GR Rates
To obtain an overview of the landscape of AS and its relationships with other genomic features, the distributions of the AS events and other gene features were pooled in 1-Mb contiguous subregions across each of the 20 chromosomes, as illustrated in Supplemental Figure 2. Overall, AS was mainly located in the arm regions of the chromosome and was associated with gene distribution (Figure 3B).
To identify the factors that influence AS, correlations between the AS distribution and intron length, exon number, transcriptional level (aligned reads), GC content, and GR rate were computed in contiguous 1-Mb windows across the genome (see Methods). The AS distribution was significantly positively correlated with the intron length, exon number, aligned reads, and GR rate and was significantly negatively correlated with GC content (Table 1). Because a large part of the soybean genome is occupied by the pericentromere, where fewer genes are embedded (Schmutz et al., 2010), we also analyzed data sets in which the pericentromeric regions were excluded to eliminate the potential influence of the “centromere effect” (Tian et al., 2009). Similar correlation patterns were observed. Most of the correlation coefficients were slightly decreased, but the correlation between AS event and the transcription level increased (Table 1).
Correlations of AS Distribution with Genome Features in 1-Mb Contiguous Windows
| Data Set | Features | Pearson Correlation | |
|---|---|---|---|
| r a | Pb | ||
| All windows | Intron length (kb) | 0.92 | <10−4 |
| Exon number | 0.98 | <10−4 | |
| Aligned reads | 0.16 | <10−4 | |
| GC content (%) | −0.77 | <10−4 | |
| GR rates (cM/Mb)c | 0.62 | <10−4 | |
| Windows from chromosome arms | Intron length (kb) | 0.74 | <10−4 |
| Exon number | 0.94 | <10−4 | |
| Aligned reads | 0.50 | <10−4 | |
| GC content (%) | −0.19 | 0.0002 | |
| GR rates (cM/Mb) | 0.12 | 0.0172 | |
Pearson correlation coefficient.
All P values calculated by 10,000 bootstrap resamplings.
cM, centimorgans.
| Data Set | Features | Pearson Correlation | |
|---|---|---|---|
| r a | Pb | ||
| All windows | Intron length (kb) | 0.92 | <10−4 |
| Exon number | 0.98 | <10−4 | |
| Aligned reads | 0.16 | <10−4 | |
| GC content (%) | −0.77 | <10−4 | |
| GR rates (cM/Mb)c | 0.62 | <10−4 | |
| Windows from chromosome arms | Intron length (kb) | 0.74 | <10−4 |
| Exon number | 0.94 | <10−4 | |
| Aligned reads | 0.50 | <10−4 | |
| GC content (%) | −0.19 | 0.0002 | |
| GR rates (cM/Mb) | 0.12 | 0.0172 | |
Pearson correlation coefficient.
All P values calculated by 10,000 bootstrap resamplings.
cM, centimorgans.
The above analysis using contiguous windows suggested that gene features, such as intron length, transcriptional level, GC content, exon number, and GR rate, regulate AS in soybeans. To further explore these relationships, we performed correlation analysis using data from individual genes, and similar results were obtained (Supplemental Table 4). As the AS event number per AS gene ranged from 1 to 339, we hypothesized that the AS frequency in the different genes may also be related to these gene features. To further confirm this correlation, we classified all expression genes into three groups: high AS gene (more than five AS events/gene), low AS gene (one to four AS events per gene), and non-AS gene (no AS in the gene). We subsequently compared the characteristics among these three groups. Significant differences were detected between the AS and non-AS genes. Consistent with the above analysis, the AS genes (both the high AS gene group and low AS gene group) had significantly longer introns (Figure 4A), more exons (Figure 4B), higher expression levels (Figure 4C), lower GC content (Figure 4D), and higher GR rates (Figure 4E) than the non-AS genes. Although no significant differences were detected for the expression level (Figure 4C) and GR rates (Figure 4E) between the high AS genes and the low AS genes, significant differences were observed in their intron lengths, exon numbers, and GC content. The high AS genes had longer introns (Figure 4A), more exons (Figure 4B), and lower GC content (Figure 4D) than the low AS genes.
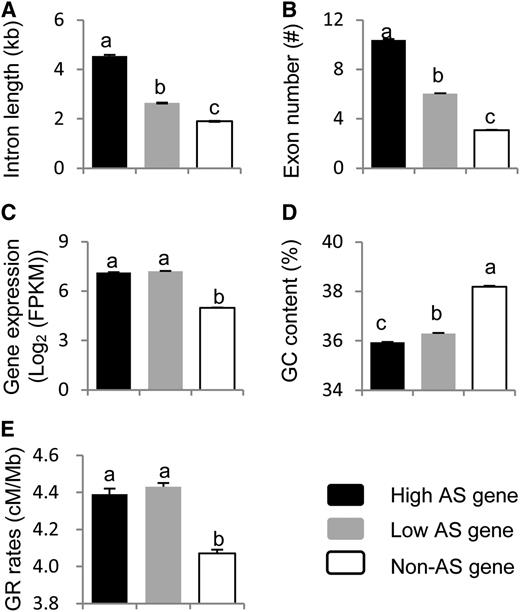
Comparisons of Gene Features with Different AS Events.
Intron length (A), exon number (B), gene expression level (C), GC content (D), and GR rates (E). The letter above each column represents its significance level. The different letters indicate significant differences at the level of P < 0.001. The bars indicate se.
Therefore, the above analysis suggested that the AS frequency was positively correlated with the intron length, exon number, gene transcriptional level, and GR rates and was negatively correlated with the GC content. To determine whether these correlations are common in different species, we performed the correlation analyses using the recently identified AS events in Arabidopsis (Marquez et al., 2012). The same correlation patterns were observed (Supplemental Table 5).
Intron Length, Exon Number, Gene Transcriptional Level, GC Content, and GR Rates Have Different Influences on the Different Types of AS Events
We also determined the correlations between intron length, exon number, transcriptional level, GR rate, and GC content and the numbers of the different types of AS events. The results showed that these four individual AS types showed similar patterns. All of these events were significantly positively correlated with the gene expression level, intron length, and exon number and were significantly negatively correlated with the GC content (Supplemental Table 6), which was similar to what was found for the total AS events (Table 1).
Because the AS events in one AS gene can consist of different AS types, many AS genes were repeatedly used in the above correlation analyses for the individual AS types. To clarify the feature differences of the different AS types, the genes that exhibited only one of the four AS types were chosen and classified into four groups: IR, AA, AD, and ES. The features of these groups were then compared. We found that the IR, AA, and AD types had relatively higher transcriptional levels than the ES, and the IR and AD had a higher GC content than the ES and AA. Additionally, the IR types had higher GR rates than the ES, whereas the ES had longer introns than the AA, AD, and IR; finally, the IR types had more exons than the ES, AA, and AD genes (Table 2). These results not only suggested that different AS types have different characteristics, but also indicated that these features may differentially influence the individual AS types. For instance, an increased number of exons may accelerate the IR frequency. To confirm this hypothesis, we classified the AS genes that contained only one AS type into three groups based on exon number: high exon genes (more than 10), medium exon genes (three to 10), and low exon genes (less than three). Then, the frequencies of each AS type within these groups (AS number of each type divided by the total number for this category) were calculated. The results showed that, along with the increase in the exon number, the proportion of IR also increased, while the proportions of AA, AD, and ES events decreased (Supplemental Figure 11A). Similar computations were conducted for the intron length (Supplemental Figure 11B) and gene expression (Supplemental Figure 11C). Overall, with an increase in the intron length, the proportion of ES increased, and the proportion of IR decreased (Supplemental Figure 11B); with an increase in the gene expression, the proportion of IR increased, and the proportion of ES decreased (Supplemental Figure 11C).
Comparison of Gene Features among Genes with Different AS Type
| Features | IR | ES | AA | AD | ||||||||
|---|---|---|---|---|---|---|---|---|---|---|---|---|
| Mean | se | Groupinga | Mean | se | Grouping | Mean | se | Grouping | Mean | se | Grouping | |
| Intron length (kb) | 2.03 ± 0.04 | B | 2.93 ± 0.10 | A | 2.12 ± 0.04 | B | 2.04 ± 0.06 | B | ||||
| Exon number | 6.25 ± 0.07 | A | 5.28 ± 0.12 | B | 4.88 ± 0.06 | C | 4.89 ± 0.10 | C | ||||
| Gene expression (log2 [FPKM])b | 7.29 ± 0.04 | A | 6.72 ± 0.08 | B | 7.22 ± 0.04 | A | 7.34 ± 0.07 | A | ||||
| GC content (%) | 36.67 ± 0.05 | A | 35.27 ± 0.11 | C | 36.27 ± 0.06 | B | 36.59 ± 0.10 | A | ||||
| GR rates (cM/Mb)c | 4.57 ± 0.05 | A | 4.21 ± 0.11 | B | 4.40 ± 0.05 | B | 4.44 ± 0.09 | AB | ||||
Performed by multivariate analysis, the different letters indicate significantly different at P < 0.001 level.
FPKM, fragments per kilobase of exon per million fragments mapped.
cM, centimorgans.
| Features | IR | ES | AA | AD | ||||||||
|---|---|---|---|---|---|---|---|---|---|---|---|---|
| Mean | se | Groupinga | Mean | se | Grouping | Mean | se | Grouping | Mean | se | Grouping | |
| Intron length (kb) | 2.03 ± 0.04 | B | 2.93 ± 0.10 | A | 2.12 ± 0.04 | B | 2.04 ± 0.06 | B | ||||
| Exon number | 6.25 ± 0.07 | A | 5.28 ± 0.12 | B | 4.88 ± 0.06 | C | 4.89 ± 0.10 | C | ||||
| Gene expression (log2 [FPKM])b | 7.29 ± 0.04 | A | 6.72 ± 0.08 | B | 7.22 ± 0.04 | A | 7.34 ± 0.07 | A | ||||
| GC content (%) | 36.67 ± 0.05 | A | 35.27 ± 0.11 | C | 36.27 ± 0.06 | B | 36.59 ± 0.10 | A | ||||
| GR rates (cM/Mb)c | 4.57 ± 0.05 | A | 4.21 ± 0.11 | B | 4.40 ± 0.05 | B | 4.44 ± 0.09 | AB | ||||
Performed by multivariate analysis, the different letters indicate significantly different at P < 0.001 level.
FPKM, fragments per kilobase of exon per million fragments mapped.
cM, centimorgans.
Decrease of AS Frequency in WGD-Derived Duplicated Genes Is Related to the Changes in Intron Length, Exon Number, and Transcriptional Level
GD is important for gene evolution to gain novel functions. We classified the gene families into three groups: small gene families (containing two to three members), medium gene families (containing four to nine members), and large gene families (containing more than 10 members). Consistent with previous findings (Kopelman et al., 2005; Su et al., 2006; Talavera et al., 2007; P.G. Zhang et al., 2010), we found that the AS event number per gene was inversely correlated with the size of a gene's family (Supplemental Figure 12A). Comparisons showed that the smaller gene families had longer introns, more exons, higher transcriptional levels, lower GC content, and higher GR rates than the larger gene families (Supplemental Table 7).
To elucidate the factors that drive the decrease of AS events in duplicated genes, the AS variation between the WGD paired genes and its relationship to the changes in gene features were investigated. Among the WGD gene pairs, 17,078 pairs included genes that both were expressed, and the remaining pairs included genes that both were not expressed or only one was expressed (Supplemental Figure 12B). Among the 17,078 expressed pairs, there were 3936 pairs in which only one gene underwent AS and the other did not and 6397 pairs in which the paired genes had different numbers of AS events; among the remainder, there were 5517 pairs in which both genes did not exhibit AS and 1228 pairs in which both genes had the same number of AS events (Supplemental Figure 12B). To identify the factors that lead to AS decrease in the duplicated genes, the transcriptional level and gene features of the AS genes and the non-AS genes were compared using those 3936 WGD gene pairs. A paired t test showed that the AS genes had significantly longer introns, more exons, higher transcriptional levels, and lower GC content than the non-AS genes (Table 3). To further confirm this hypothesis, comparisons were performed between the high AS genes and low AS genes using the 6397 WGD pairs (Table 3). The t test results also showed that the high AS genes had significantly longer introns, more exons, and higher transcriptional levels than the low AS genes (Table 3). These comparisons indicated that the decreases in intron length, exon number, and transcriptional level may reduce the AS frequency of the WGD genes.
Feature Comparisons between AS Genes and Non-AS Genes, High-AS Genes, and Low-AS Genes within WGD Pair Genes
| Features | AS Genea | Non-AS Genea | Prob>t | High-AS Genea | Low-AS Genea | Prob>t |
|---|---|---|---|---|---|---|
| Intron length (kb) | 2.57 ± 0.05 | 2.06 ± 0.03 | <10−4 | 3.85 ± 0.05 | 3.79 ± 0.05 | 0.10 |
| Exon number | 5.56 ± 0.07 | 4.83 ± 0.05 | <10−4 | 9.22 ± 0.08 | 9.09 ± 0.07 | <10−4 |
| Gene expression (log2 [FPKM])b | 7.30 ± 0.03 | 5.98 ± 0.05 | <10−4 | 7.33 ± 0.02 | 7.27 ± 0.02 | 0.00 |
| GC content (%) | 36.49 ± 0.05 | 36.58 ± 0.06 | 0.03 | 36.14 ± 0.03 | 36.12 ± 0.03 | 0.54 |
| GR rates (cM/Mb)c | 4.53 ± 0.05 | 4.52 ± 0.05 | 0.91 | 4.61 ± 0.04 | 4.60 ± 0.04 | 0.68 |
Data are presented as mean ± se.
FPKM, fragments per kilobase of exon per million fragments mapped.
cM, centimorgans.
| Features | AS Genea | Non-AS Genea | Prob>t | High-AS Genea | Low-AS Genea | Prob>t |
|---|---|---|---|---|---|---|
| Intron length (kb) | 2.57 ± 0.05 | 2.06 ± 0.03 | <10−4 | 3.85 ± 0.05 | 3.79 ± 0.05 | 0.10 |
| Exon number | 5.56 ± 0.07 | 4.83 ± 0.05 | <10−4 | 9.22 ± 0.08 | 9.09 ± 0.07 | <10−4 |
| Gene expression (log2 [FPKM])b | 7.30 ± 0.03 | 5.98 ± 0.05 | <10−4 | 7.33 ± 0.02 | 7.27 ± 0.02 | 0.00 |
| GC content (%) | 36.49 ± 0.05 | 36.58 ± 0.06 | 0.03 | 36.14 ± 0.03 | 36.12 ± 0.03 | 0.54 |
| GR rates (cM/Mb)c | 4.53 ± 0.05 | 4.52 ± 0.05 | 0.91 | 4.61 ± 0.04 | 4.60 ± 0.04 | 0.68 |
Data are presented as mean ± se.
FPKM, fragments per kilobase of exon per million fragments mapped.
cM, centimorgans.
The 1228 pairs of duplicated genes in which both genes had the same number of AS events (Supplemental Figure 12B) can be further classified into two groups: 441 pairs with the same number of AS events and same AS types, and 787 pairs with the same number of AS events but different AS types. To determine whether the AS type variations in duplicated genes were associated with the genomic features, we classified 787 pairs with the same number of AS events but different AS types into low-IR and high-IR, low-ES and high-ES, low-AA and high-AA, and low-AD and high-AD. The differences in genomic features between these pairs of genes were compared. t test analysis showed that there was no significant association between the changes in AS type and genomic features (Supplemental Table 8). The insignificant difference may indicate that the AS type variation in duplicated genes is complicated or be caused by the small number of duplicated pairing genes used for this computation.
DISCUSSION
AS Is Common in the Soybean Genome and Shows Variation in Different Tissues
Since Walter Gilbert proposed that it might be possible for a gene to produce different mRNA isoforms through the splicing recombination of different exons in 1978 (Gilbert, 1978), increasing evidence has shown that AS commonly occurs in higher eukaryotes. In Drosophila melanogaster, the Dscam gene has the potential to produce more than 38,000 alternatively spliced variants (Graveley, 2005). In human, it was reported that the ratio of AS genes is as high as 92 to 94% (Wang et al., 2008). Studies have predicted that ∼60% of intron-containing genes are alternatively spliced in plants (Reddy et al., 2013). Here, using high-throughput RNA sequencing and comprehensive analyses, we demonstrated that ∼63% of multiexonic genes (intron containing genes) are alternatively spliced in soybean, and, on average, each AS gene contain six to seven AS events (154,469 AS events/23,764 AS genes). Moreover, the samples used in this study were collected mainly from different developmental stages and did not include samples from extreme circumstances, such as stress conditions. It has been suggested that numerous AS events are induced only by abiotic and biotic stresses (Staiger and Brown, 2013); therefore, AS in soybean might be more prevalent than we detected.
Our analysis demonstrated that some genes were constitutively alternatively spliced in all of the samples that we examined. GO analysis indicated that these constitutive AS genes were highly enriched in pathways related to RNA splicing. This result may be partially supported by the observation that in addition to playing important roles in regulating the AS of other genes, the RNA splicing-related genes are also regulated by AS by themselves or other splicing factors (Saltzman et al., 2011; Thomas et al., 2012).
However, numerous observations have suggested that there are also many AS events in plants that are regulated by tissue-specific cues (Yoshimura et al., 2002). Our study demonstrated that approximately one-third of these events showed differential tissue expression, and the number of AS events and the frequency of AS types varied dramatically in the different tissues. The AS frequency was higher in the rapidly developing tissues, such as shoot meristem or young seeds, than it was in other tissues. Similar phenomena were found in functionally complex tissues with diverse cell types that provide diverse functions in metazoans, such as the brain, testis, and immune system (Modrek et al., 2001; Johnson et al., 2003; Yeo et al., 2004; Watson et al., 2005). It was thought that in addition to introducing proteome diversity, AS is an important factor in regulating gene expression (Reddy et al., 2013). These tissue-specific AS events may function in a coordinated manner in specific pathways or interaction networks as groups of genes that are coregulated at the transcriptional level (Blencowe, 2006).
Changes in Gene Structure Have Significant Effects on AS
The gene structures of plants and animals are quite different in terms of the average size of introns. The average intron length in animals is relatively large; for example, introns can be as long as 5 kb in humans (Sakharkar et al., 2004). In plants, the average intron length is much smaller (Iwata and Gotoh, 2011; Marquez et al., 2012); for instance, the average intron lengths are 539 and 470 bp in soybeans and in rice, respectively. The difference in intron size between plants and animals may be related to their different principles of intron processing (Brown et al., 1986; Hartmuth and Barta, 1986), which in turn results in different proportions of the AS types between plants and animals. In animals, ES is more prevalent than other AS types (Modrek and Lee, 2002; Sultan et al., 2008; Wang et al., 2008), whereas in plants, IR is the most common type (Iida and Go, 2006; Wang and Brendel, 2006; Filichkin et al., 2010; Marquez et al., 2012). Our analysis showed that, similar to other plants, IR was the most abundant form of AS in soybean. Furthermore, our results also suggested that the ratios of the different AS types in plants may be different between dicots and monocots. Although it is common for IR to account for the majority of AS events in plant genomes, the ratios of the different AS types show variations in different plant species. In Arabidopsis, the proportions of AA and AD were higher than that of ES (Wang and Brendel, 2006; Filichkin et al., 2010; Marquez et al., 2012), whereas ES was more common than AA and AD in rice (Wang and Brendel, 2006; G.J. Zhang et al., 2010). In our analysis, the proportions of AA and AD were higher than that of ES, which is consistent with results from Arabidopsis (Wang and Brendel, 2006; Filichkin et al., 2010; Marquez et al., 2012). A study on alternative first exon clusters also indicated that alternative first exons may have evolved independently between rice and Arabidopsis (Chen et al., 2007). The difference between the proportions of each AS type in Arabidopsis, rice, and soybean indicate that the principles of intron processing or AS may have diverged between dicots and monocots.
The acquisition of splice variants is thought to occur concomitantly with an increase in the number of exons (Kopelman et al., 2005). Our analysis suggested that the gene structure could greatly affect the AS frequency. Analyses using different data sets, including contiguous windows across whole chromosomes, contiguous windows only from chromosome arms, and individual genes, all showed that the AS frequency was positively correlated with the intron length and exon number. A further analysis demonstrated that the genes with longer introns and more exons exhibited more AS events. Several studies have found that the AS frequency decreases after GD (Kopelman et al., 2005; Su et al., 2006; Talavera et al., 2007; P.G. Zhang et al., 2010), but other studies have reported inconsistent results (Jin et al., 2008; Lin et al., 2008; Roux and Robinson-Rechavi, 2011). Chen et al. (2011) found that the AS variation among duplicated genes was age dependent: There was an inverse correlation among recently duplicated genes, but a positive correlation among anciently duplicated genes. Our results revealed that the AS event number per gene was inversely correlated with the size of a gene's family in soybean. Statistical analysis found that AS genes and high AS genes had longer introns and more exons than the non-AS genes and the low AS genes, respectively, indicating that the change in intron length and exon number might be the main factors associated with AS variation.
These results suggested that changes in gene structure, especially intron length and exon number, have significant effects on AS frequency.
The Effect of Gene Transcriptional Level on AS Might Be Related to the Efficiency of Splicing
Our analysis suggested that the gene transcriptional level also affects the occurrence of AS, but not as strongly as changes in gene structure. The AS frequency was positively correlated with the transcriptional level, and AS preferentially occurred in the tissues with higher gene expression levels. Additionally, our results suggested that the frameshift transcripts caused by AS were increased in the tissues with higher gene expression. Although some AS isoforms containing PTCs may be functional, most of these transcripts are thought to be nonsense transcripts (Lewis et al., 2003; Filichkin et al., 2010).
We proposed that the high proportion of AS and frameshift transcripts occurring in the tissues with higher gene expression levels might be due to the low or insufficient amount of spliceosome complexes in these tissues. Functional analyses of pol II and its effects on splicing may partially support our hypothesis. It was presumed that similar to other macromolecular machines, the spliceosome is not perfect and will occasionally make mistakes (Graveley, 2001). Transcription and pre-mRNA splicing are coupled through the interaction of RNA Pol II and the SFs, and transcription has been shown to affect AS (reviewed in Luco et al., 2011). The pol II C4 mutant exhibits a lower elongation rate (Chen et al., 1996), and this mutant can inhibit the skipping of the fibronectin EDI exon and stimulate the resplicing of the Hox gene Ultrabi (de la Mata et al., 2003). Additional proof was collected using an artificial cassette exon that was created by mutating the branch point upstream of the constitutive internal exon of the DYN2 gene in yeast. The skipping of this exon can be partially prevented when this gene is expressed in a yeast mutant carrying a slow pol II or when expressed in the presence of elongation inhibitors (Howe et al., 2003). Moreover, if the SFs are mutated, then additional AS events can occur (reviewed in Staiger and Brown, 2013). These results indicate that the balance between the relative rates of spliceosome formation and pol II processivity are important for AS.
No single mechanism can fully explain the precise regulation of AS (Fox-Walsh and Hertel, 2009). Many factors contribute to the control of AS (Luco et al., 2011; Witten and Ule, 2011), and splicing decisions result from the integration of multiple variables (Shin and Manley, 2004). Here, through the comprehensive investigation of the relationships between AS variation and changes in genomic features at a genome-wide level, our results elucidate how AS is affected by the changes in gene structure and expression level and provide clues for future functional analyses.
METHODS
Plant Growth Conditions and Material Collection
Soybean plants (Glycine max cv Williams82) were grown during the growing season at the experimental station of the Institute of Genetics and Developmental Biology, Chinese Academy of Sciences, in 2011. Twenty-eight tissues, including cotyledon, root, shoot, leaf, flower, pod, and seed at the different developmental stages of germination, trefoil, flowering, seed development, and plant senescence, were collected. Each sample was collected from at least five individual plants, and the mixed bundle was quickly frozen in liquid nitrogen for RNA isolation.
RNA Isolation, cDNA Library Construction, and High-Throughput Sequencing
The total RNA was isolated using the TRIzol reagent (Invitrogen) according to the manufacturer's instructions. To remove the residual DNA, the extracted RNA was treated with RNase-free DNase I (New England Biolabs) for 30 min at 37°C. cDNA libraries were constructed as previously described (Severin et al., 2010) and sequenced using a HiSeq 2000 analyzer.
Read Alignment to the Reference Soybean Genome and Gene Expression Estimation
Soybean genome sequences and annotation (version 109) were downloaded from http://www.phytozome.net/soybean. After removing the low-quality reads and clipping the adapter sequences, the raw RNA sequence data from each sample were mapped to the reference soybean genome using TopHat2 (Trapnell et al., 2009). As the tissues used in this study were obtained from the reference cultivar, Williams 82, the parameter of no mismatch was used during the mapping. The maximum alignment number for each read was set to 2, and the inner distance between the mating pairs was set to 230 bp. The rest of the parameters were set as default. The gene expression was estimated using Cufflinks (Trapnell et al., 2010) and was normalized using the numbers of reads per kilobase of exon sequence in a gene per million mapped reads (Mortazavi et al., 2008). GO analysis was performed using agriGO (Du et al., 2010).
Putative Transcript Assembly and AS Event Identification
After the reads were aligned, empirical transcript construction for each sample was performed using Cufflinks (Trapnell et al., 2010). The minimum isoform fraction was set to 0.05, the small anchor fraction for spliced reads was set to 0.01, the precursor mRNA fraction was set to 0.15, and the minimum fragments supporting assembled transfrag was set to 10. The minimum and maximum intron lengths were set to 30 and 15,000 bp, respectively. The rest of the parameters were then set as default.
To identify AS events, first, the different assembled transcript isoforms were mapped to the corresponding gene model using Cuffcompare, which is included in the Cufflinks program, as previously described (Trapnell et al., 2010). Then, AS identification was performed using ASTALAVISTA (Foissac and Sammeth, 2007). Four main types of AS events, including IR, ES, AA, and AD, were analyzed as previously described (Sammeth et al., 2008).
Validation of AS Events
A total of 116 AS events distributed across the 20 chromosomes were chosen to validate the accuracy of the AS prediction in this study. The 116 transcript fragments, each of which contained a predicted AS event, were amplified using cDNA as template. The fragment length was between 100 and 500 bp. The primer information is listed in Supplemental Table 2. After amplification, all of the PCR products were mixed together and used for Miseq library construction according to the protocol provided by Illumina. The library was sequenced using a Miseq Benchtop Sequencer. After removing the low quality reads and clipping the adapter sequences, the raw Miseq reads were mapped to the sequences of the corresponding transcript fragment. To determine if the predicted AS events were supported by the Miseq reads, Tablet (Milne et al., 2010) was used to visualize the mapped results.
Statistical Analysis
The local GR rate estimation was performed using MareyMap (Rezvoy et al., 2007) as previously described (Tian et al., 2012). For the statistical analysis at the genome-wide level, each chromosome was split into contiguous 1-Mb windows from the beginning to the end, and the genomic features within each window were calculated as previously described (Tian et al., 2012). The GR rates were obtained for each window and were plotted on the basis of their midpoints. For genes that have more than two gene models in the genome annotation, the longest one was used to calculate the intron length, exon number, and GC content.
The correlations between the investigated features were assessed using Pearson's correlation with 10,000 bootstrap resamplings as previously described (Zhang and Gaut, 2003). Comparisons of genomic features and expression levels between the non-AS and AS genes and between the high AS and low AS genes of the WGD gene pairs were conducted using an ANOVA t test. Comparisons of different features among genes with different AS events and among different types of AS events were conducted using multivariate analysis with Fisher's LSD test.
Accession Numbers
RNA-seq raw sequence data for the 28 samples from this article can be found in the NCBI Short Read Archive database under the following accession numbers: SRX474427, SRX474441, SRX474445, SRX474430, SRX474431, SRX474433, SRX474432, SRX474439, SRX474442, SRX474419, SRX474428, SRX474440, SRX474443, SRX474424, SRX474423, SRX474422, SRX474434, SRX474436, SRX474437, SRX474416, SRX474435, SRX474438, SRX474421, SRX474420, SRX474446, SRX474444, SRX474426, and SRX474429.
Supplemental Data
The following materials are available in the online version of this article.
Supplemental Figure 1. Tissues Collected from the Different Developmental Stages for RNA-seq.
Supplemental Figure 2. Distributions of the Aligned Reads, Genomic Features, and Estimated Local GR Rates along the 20 Soybean Chromosomes.
Supplemental Figure 3. Validation of AS.
Supplemental Figure 4. AS Gene Distributions and Their Relationships with the Expressed Gene Number and Expression Level in Different Tissues.
Supplemental Figure 5. Comparisons between AS and Non-AS Genes.
Supplemental Figure 6. Enriched Biological Process GO Terms in Genes That Were Alternatively Spliced in All Tissues.
Supplemental Figure 7. AS Events within Tissues and among Different Tissues.
Supplemental Figure 8. Numbers of Individual AS Types in Different Tissues.
Supplemental Figure 9. Splice Site Usage of the Different Types of AS Events.
Supplemental Figure 10. Sequence Length Distribution of the Different Types of AS Events.
Supplemental Figure 11. Frequencies of the Individual AS Types in the Different Groups Characterized by Different Features.
Supplemental Figure 12. AS in Singleton and Duplicated Genes.
Supplemental Table 1. Statistics of Aligned Reads in Each Sample.
Supplemental Table 2. Primer Information for AS Validation.
Supplemental Table 3. Correlations of Domain Number with Gene Features.
Supplemental Table 4. Correlations of AS Number with Other Features for Individual Genes.
Supplemental Table 5. Correlations of AS Number with Gene Features in Arabidopsis.
Supplemental Table 6. Correlations of AS Number with Gene Features for Individual AS Types.
Supplemental Table 7. Comparisons of Different Features between Gene Families with Different Sizes.
Supplemental Table 8. Feature Comparisons between Duplicated Genes with the Same Number of AS Events but Different AS Types.
Acknowledgments
We thank the two anonymous reviewers for constructive comments. This work was supported by the National Natural Science Foundation of China (Grants 91131005 and 31222042) and “One-hundred talents” Startup Funds from the Chinese Academy of Sciences. The authors declare no conflict of interest.
Glossary
- AS
alternative splicing
- PTC
premature termination codon
- ES
exon skipping
- IR
intron retention
- AD
alternative donor sites
- AA
alternative acceptor sites
- GD
gene duplication
- WGD
whole-genome duplication
- GR
genomic recombination
- GO
Gene Ontology
AUTHOR CONTRIBUTIONS
Y.S., Z.Z., and Z.T. conceived this project and designed all of the experiments. Y.S., Z.W., C.F., M.W., Y.M., L.A.K., and D.L.P. performed the experiments. Y.S., Z.Z., T.L., W.L., and Z.T. analyzed the data. Y.S., Z.Z., and Z.T. wrote the article.
References
Author notes
These authors contributed equally to this work.
Address correspondence to zxtian@genetics.ac.cn.
The author responsible for distribution of materials integral to the findings presented in this article in accordance with the policy described in the Instructions for Authors (www.plantcell.org) is: Zhixi Tian (zxtian@genetics.ac.cn).

Online version contains Web-only data.
