


Abstract
Plants employ acentrosomal mechanisms to organize cortical microtubule arrays essential for cell growth and differentiation. Using structured illumination microscopy (SIM) adopted for the optimal documentation of Arabidopsis (Arabidopsis thaliana) hypocotyl epidermal cells, dynamic cortical microtubules labeled with green fluorescent protein fused to the microtubule-binding domain of the mammalian microtubule-associated protein MAP4 and with green fluorescent protein-fused to the alpha tubulin6 were comparatively recorded in wild-type Arabidopsis plants and in the mitogen-activated protein kinase mutant mpk4 possessing the former microtubule marker. The mpk4 mutant exhibits extensive microtubule bundling, due to increased abundance and reduced phosphorylation of the microtubule-associated protein MAP65-1, thus providing a very useful genetic tool to record intrabundle microtubule dynamics at the subdiffraction level. SIM imaging revealed nano-sized defects in microtubule bundling, spatially resolved microtubule branching and release, and finally allowed the quantification of individual microtubules within cortical bundles. Time-lapse SIM imaging allowed the visualization of subdiffraction, short-lived excursions of the microtubule plus end, and dynamic instability behavior of both ends during free, intrabundle, or microtubule-templated microtubule growth and shrinkage. Finally, short, rigid, and nondynamic microtubule bundles in the mpk4 mutant were observed to glide along the parent microtubule in a tip-wise manner. In conclusion, this study demonstrates the potential of SIM for superresolution time-lapse imaging of plant cells, showing unprecedented details accompanying microtubule dynamic organization.
Plant cell growth and differentiation depend on dynamic cortical microtubule organization mechanisms (Ehrhardt, 2008). Such mechanisms include branched microtubule formation and release (Murata et al., 2005; Nakamura et al., 2010; Fishel and Dixit, 2013), microtubule-templated microtubule growth (Chan et al., 2009), angle-of-contact microtubule bundling or catastrophe induction (Dixit and Cyr, 2004; Tulin et al., 2012), severing at microtubule crossovers (Wightman and Turner, 2007), and unique dynamic behavior between steady-state treadmilling and dynamic instability (Shaw et al., 2003).
Cortical microtubule dynamics have been studied in vivo and in vitro with total internal reflection microscopy (TIRFM; Vizcay-Barrena et al., 2011), variable-angle emission microscopy (VAEM; Wan et al., 2011), spinning-disc microscopy (SD; Shaw and Lucas, 2011), and confocal laser scanning microscopy (CLSM; Shaw et al., 2003). TIRFM and VAEM provide sufficient resolution and speed but at limited depth of imaging (approximately 200 nm; Martin-Fernandez et al., 2013) and inevitably a very narrow field of view when used for in vivo studies (Mattheyses et al., 2010). Dynamic CLSM imaging suffers from field-of-view limitations while also introducing phototoxicity to the imaged sample. Furthermore, CLSM is based on a speed-to-resolution tradeoff that will necessitate computational extrapolation to bring resolution to affordable levels (Rosero et al., 2014). Finally, SD can provide sufficient depth and speed but otherwise poor resolution, owing to aberrations arising from the sample and the properties of the optics commonly used (Shaw and Ehrhardt, 2013).
Microtubule research evolved concomitant with optical microscopy and the development of fluorescent proteins markers, allowing the resolution of microtubule dynamics and organization at video rates (Marc et al., 1998; Shaw and Ehrhardt, 2013). However, the bulk of plant cells organized in tissues and the optical properties of cell walls hamper microscopic observations, so that the delineation of fine details of microtubule organization still relies on laborious transmission electron microscopy (Kang, 2010).
Alternatively, in vitro assays using total internal reflection (TIRFM) or Allen’s video-enhanced contrast-differential interference contrast microscopy (Allen et al., 1981) with purified components have advanced the understanding of microtubule-microtubule-associated protein (MAP) interactions while providing mechanistic insight on the function of MAP65 proteins (Tulin et al., 2012; Portran et al., 2013; Stoppin-Mellet et al., 2013), kinesin motors (Song et al., 1997), katanin-mediated microtubule severing (Stoppin-Mellet et al., 2007), and microtubule dynamics (Moore et al., 1997). However, it is explicitly acknowledged that such in vitro assays should be addressed in biologically coherent systems with physiological relevance to microtubule dynamics (Gardner et al., 2013; Zanic et al., 2013). Thus, an ideal approach would be to address microtubule dynamics in the complex cellular environment at spatiotemporal resolutions achieved by in vitro assays.
Subdiffraction optical microscopy techniques allow subcellular observations below Abbe’s resolution threshold (Verdaasdonk et al., 2014), complementing the use of transmission electron microscopy. Such approaches permit dynamic subcellular tracking of appropriately tagged structures within living cells (Tiwari and Nagai, 2013). Practically, two superresolution strategies exist. The first involves patterned light illumination, allowing superresolution acquisitions by two fundamentally different methods, stimulated emission depletion (STED; Hell, 2007) and structured illumination microscopy (SIM; Gustafsson, 2000). The second interrogates the precision of fluorophore localization and includes stochastic optical reconstruction microscopy (STORM; Kamiyama and Huang, 2012) and photoactivation localization microscopy (PALM; Sengupta et al., 2012). The above regimes differ in translational and axial resolution, and their temporal efficiency depends on the size of the imaged area. SIM is probably the best compromise for superresolution live imaging, as it offers reasonable lateral resolution (approximately 100 nm; Gustafsson, 2000), which may be reduced to 50 nm (Rego et al., 2012), and sufficient depth of imaging combined with a reasonable axial resolution (approximately 200 nm). SIM allows dynamic imaging in a broader field of view than STED, at biologically meaningful rates compared with PALM and STORM (Kner et al., 2009), and with deeper imaging capacity compared with other superresolution regimes and with TIRFM/VAEM (Leung and Chou, 2011). Superresolution approaches have received limited attention in the plant cell biology field (Fitzgibbon et al., 2010; Kleine-Vehn et al., 2011), and their resolution potential during live imaging was not quantified previously.
Here, high-numerical aperture (NA) objectives were combined with SIM for the acquisition and systematic quantification of subdiffraction details of cortical microtubules labeled either with GFP fused to the microtubule-binding domain of mammalian MAP4 (GFP-MBD; Marc et al., 1998) or with GFP fused to alpha tubulin6 (GFP-TUA6; Shaw et al., 2003). For such studies, wild-type plants and a mitogen-activated protein kinase4 (mpk4) mutant, exhibiting extensive microtubule bundling due to the overexpression and underphosphorylation of MAP65-1 (Beck et al., 2010), were used.
RESULTS
General Remarks on Sample Preparation
To optimize SIM imaging of Arabidopsis (Arabidopsis thaliana) hypocotyl epidermal cells, seedlings were grown in darkness, since etiolation promotes the thinning of the outer epidermal wall and reduces the thickness of the cuticular surface (Kutschera, 2008). Thus, hypocotyl surfaces can be wetted well with aqueous mounting medium used for in vivo imaging (one-half-strength Murashige and Skoog [MS] medium was used here), excluding air pockets that may introduce additional refractive index mismatches upon imaging. Meanwhile, the contour of the etiolated hypocotyl surface is smoother, allowing the wider exposure of hypocotyl epidermal cell surfaces underneath the coverslip, as required for the high-NA objective with small working distance used here. Refractive index mismatches pertaining to fluctuations in coverslip thickness were alleviated by using high-performance and low-thickness-tolerance coverslips. In addition, an objective with high NA (NA 1.57) was used in combination with an immersion oil of high refractive index (1.66) in order to obtain maximal possible resolution during SIM, wide field (WF), CLSM, TIRFM, and SD imaging.
Microtubule Organization
Since details of microtubule organization have been reported using other microscopies, the first task was to characterize qualitatively and quantitatively the resolution potential of SIM and provide relevant comparisons with WF and CLSM with respect to structural features of microtubular arrays. This was particularly important as the relevant literature is largely devoid of quantitative resolution data using the above microscopies.
In this respect, SIM revealed loop-like defects in GFP-MBD cortical microtubule bundles (Fig. 1A, top inset; Supplemental Fig. S1A), which were indiscernible by WF (Fig. 1A, middle inset; Supplemental Fig. S1B) and CLSM (Fig. 1A, bottom inset; Supplemental Fig. S1C). Visualization of GFP-TUA6-labeled microtubules is inherently confounded by background, possibly owing to free tubulin dimers containing GFP-TUA6. With SIM, however, such problems were significantly ameliorated, and GFP-TUA6 cortical microtubules were visualized with high contrast (Fig. 1B; Supplemental Fig. S1D). Furthermore, it was shown by SIM that GFP-TUA6 is incorporated into the microtubule lattice in a discontinuous manner (Fig. 1B, top inset; Supplemental Fig. S1D), which was not apparent in WF (Fig. 1B, bottom inset; Supplemental Fig. S1E). Such discontinuous incorporation of GFP-TUA6-tagged dimers in the microtubule lattice (for mechanism, see Waterman-Storer and Salmon, 1998) was best appreciated with linear profiles drawn along GFP-TUA6-labeled microtubules. These showed alternating, bell-shaped fluorescence intensities of variable amplitude, with clear peak-to-peak separation by SIM (Supplemental Fig. S2, A (inset) and C) as compared with WF (Supplemental Fig. S2, B (inset) and C). The readout of such profiles (Supplemental Fig. S2C) also showed that maximum fluorescence intensities with SIM are well above background levels when compared with WF, further substantiating the use of SIM in generating highly contrasting acquisitions in samples inherently plagued with high background fluorescence, such as the GFP-TUA6-expressing hypocotyl cells. The speckled appearance of GFP-TUA6-labeled microtubules probably reflects the stochastic incorporation of GFP-TUA6-containing dimers diluted in a soluble tubulin pool of unlabeled dimers, and it might prove a useful source for fluorescence speckled microscopy (Salmon and Waterman, 2011).
![Comparison of SIM, WF, and CLSM in resolving fine details of cortical microtubule organization in hypocotyl epidermal cells of Arabidopsis expressing either GFP-MBD or GFP-TUA6 microtubule markers. A, Overview of bundled GFP-MBD-labeled microtubules in a hypocotyl epidermal cell of wild-type Arabidopsis (Supplemental Fig. S1A). The boxed area includes a loop within a bundle that is readily visible by SIM (top inset, arrow) but not by WF (middle inset, arrow; Supplemental Fig. S1B) or CLSM (bottom inset, arrow; Supplemental Fig. S1C). B, Overview and details of a cortical microtubule bundle in an epidermal cell expressing GFP-TUA6 (Supplemental Fig. S1D). The top inset shows the discontinuous incorporation of the tagged tubulin revealed by SIM, which is not discernible by WF (bottom inset; Supplemental Fig. S2, A–C). C, Overview and details of microtubule branch formation and release in a hypocotyl epidermal cell expressing the GFP-MBD microtubule marker (Supplemental Fig. S1F) acquired with a 63×, 1.40 NA oil-immersion objective. A nascent branch (top inset, arrow) and a newly released branch (top inset, arrowhead) are clearly visible by SIM but not by WF (bottom inset, arrow and arrowhead, respectively). D, Microtubule bundle complexity in a hypocotyl epidermal cell of the mpk4 mutant as visualized by SIM (Supplemental Fig. S1J). Such bundles (white boxed area) can be resolved in detail by SIM (top inset) but not by WF (middle inset) or CLSM (bottom inset). E to G, Details (left column) and orthogonal projection (right column) of three closely proximal microtubules (lines) from the dotted boxed area in D. By SIM (E; Supplemental Fig. S1J), the three microtubules are clearly separated as three fluorescent spots, while in the respective WF (F; Supplemental Fig. S1K) and CLSM (G; Supplemental Fig. S1L) images, the three microtubules appear as a fuzzy fluorescent area. H to K, Quantitative analysis of the resolution of individual GFP-MBD-labeled (H and J) or GFP-TUA6-labeled (I and K) microtubules by means of SIM and WF (H and I) or CLSM (J and K). The graphs represent averaged, coaligned, and normalized intensity profiles (as described in “Materials and Methods”) of individual cortical microtubules (n = 27 and 42 for SIM [GFP-MBD and GFP-TUA6, respectively], n = 27 and 42 for WF [GFP-MBD and GFP-TUA6, respectively], and n = 27 and 47 for CLSM [GFP-MBD and GFP-TUA6, respectively]). Bars = 5 μm (A–D) and 2 μm (insets in A–D and E–G).](https://oup.silverchair-cdn.com/oup/backfile/Content_public/Journal/plphys/165/1/10.1104_pp.114.238477/2/m_plphys_v165_1_129_f1.jpeg?Expires=1716598825&Signature=NYkAUtq4YhVM6NWeiEJDmhcjyBqyhzKBGBhAy7g-wYarZav3JEYD7OLMOxSQEFLTiCRLhB9gtSM4hlm1jn~xdE~zoRTNm6mAtr5aO0CBAD5RpHcAxjVQsKerHeB~Ct5rtsn~FpQBR3by8MYW-8SRnuzuylI5BHjjakaGtsJOmq4zn0ptYV9HwIHP8-THeBPciOCjPjbw-4O8vTt2OiFLa9pMbKRIvyxN4DnvaEzjh9ZTuCaFWvaD6f84URJD8QsLecV7WXh4vWLHh0ALa7h0Q2I-UhcIo7eXpq310UlAzhOGr-YS9Y5c~ET41S4lcRkTX-JljUx1e7W~iOVsLOoEew__&Key-Pair-Id=APKAIE5G5CRDK6RD3PGA)
Comparison of SIM, WF, and CLSM in resolving fine details of cortical microtubule organization in hypocotyl epidermal cells of Arabidopsis expressing either GFP-MBD or GFP-TUA6 microtubule markers. A, Overview of bundled GFP-MBD-labeled microtubules in a hypocotyl epidermal cell of wild-type Arabidopsis (Supplemental Fig. S1A). The boxed area includes a loop within a bundle that is readily visible by SIM (top inset, arrow) but not by WF (middle inset, arrow; Supplemental Fig. S1B) or CLSM (bottom inset, arrow; Supplemental Fig. S1C). B, Overview and details of a cortical microtubule bundle in an epidermal cell expressing GFP-TUA6 (Supplemental Fig. S1D). The top inset shows the discontinuous incorporation of the tagged tubulin revealed by SIM, which is not discernible by WF (bottom inset; Supplemental Fig. S2, A–C). C, Overview and details of microtubule branch formation and release in a hypocotyl epidermal cell expressing the GFP-MBD microtubule marker (Supplemental Fig. S1F) acquired with a 63×, 1.40 NA oil-immersion objective. A nascent branch (top inset, arrow) and a newly released branch (top inset, arrowhead) are clearly visible by SIM but not by WF (bottom inset, arrow and arrowhead, respectively). D, Microtubule bundle complexity in a hypocotyl epidermal cell of the mpk4 mutant as visualized by SIM (Supplemental Fig. S1J). Such bundles (white boxed area) can be resolved in detail by SIM (top inset) but not by WF (middle inset) or CLSM (bottom inset). E to G, Details (left column) and orthogonal projection (right column) of three closely proximal microtubules (lines) from the dotted boxed area in D. By SIM (E; Supplemental Fig. S1J), the three microtubules are clearly separated as three fluorescent spots, while in the respective WF (F; Supplemental Fig. S1K) and CLSM (G; Supplemental Fig. S1L) images, the three microtubules appear as a fuzzy fluorescent area. H to K, Quantitative analysis of the resolution of individual GFP-MBD-labeled (H and J) or GFP-TUA6-labeled (I and K) microtubules by means of SIM and WF (H and I) or CLSM (J and K). The graphs represent averaged, coaligned, and normalized intensity profiles (as described in “Materials and Methods”) of individual cortical microtubules (n = 27 and 42 for SIM [GFP-MBD and GFP-TUA6, respectively], n = 27 and 42 for WF [GFP-MBD and GFP-TUA6, respectively], and n = 27 and 47 for CLSM [GFP-MBD and GFP-TUA6, respectively]). Bars = 5 μm (A–D) and 2 μm (insets in A–D and E–G).
Microtubule nucleation through lateral branching from walls of preexisting microtubules was also followed by SIM, as it represents a major mechanism of microtubule nucleation in higher plants (Chan et al., 2009). SIM allowed visualizing the very onset of branch formation and the release of nascent microtubules (Fig. 1C, top inset; Supplemental Fig. S1F), while this was not possible with WF (Fig. 1C, bottom inset; Supplemental Fig. S1G).
In addition, SIM resolved in good detail the composite nature of cortical microtubule bundles, especially in the mpk4 mutant (Fig. 1D, top inset; Supplemental Fig. S1H), and it outperformed WF (Fig. 1D, middle inset; Supplemental Fig. S1I) and CLSM (Fig. 1D, bottom inset; Supplemental Fig. S1J) in this respect. The discrimination of very proximal microtubules was best illustrated in orthogonal projections, which provided a clear view of the resolution potential of SIM (Fig. 1E) as compared with WF (Fig. 1F) and CLSM (Fig. 1G), making it possible to clearly discriminate such adjacent microtubules as individual fluorescent spots with SIM (Fig. 1E) compared with WF (Fig. 1F) and CLSM (Fig. 1G), which showed only one area of diffuse fluorescence.
The quantitative potential of SIM superresolution capacities was measured with the full width at one-half maximum (FWHM) of normalized, fluorescence intensity profiles drawn perpendicular to individual microtubules. Averaged FWHM values of GFP-MBD and GFP-TUA6 were then compared with the respective values obtained with WF and CLSM. During profiling of individual microtubules, care was taken to use identical and coaligned profiles, meaning that the maximum intensity of all profiles was located at the same position (see “Materials and Methods”). Since the software used (see “Materials and Methods”) gives different values for SIM, WF, and CLSM, all intensity profiles were normalized to values between 0 and 1. From the bell curves obtained in this way, the FWHM corresponds to the width of the curve at a normalized intensity value of 0.5. Taking into account the above, SIM outperformed WF and CLSM resolution. The FWHM for GFP-MBD microtubules was 106 ± 20 nm (mean ± sd; n = 27; Fig. 1H), while for GFP-TUA6 microtubules, it was 118 ± 25 nm (mean ± sd; n = 42; Fig. 1I). The difference between the mean FWHM for GFP-MBD-labeled microtubules and for GFP-TUA6-labeled microtubules is not significant (P = 0.141). The respective FWHM value for GFP-MBD microtubules visualized by WF was 231 ± 26 nm (mean ± sd; n = 27; Fig. 1H) and for CLSM it was 235 ± 20 nm (mean ± sd; n = 27; Fig. 1J), while GFP-TUA6-labeled microtubules were resolved at 223 ± 44 nm (mean ± sd; n = 42; Fig. 1I) by WF and at 325 ± 42 nm (mean ± sd; n = 47; Fig. 1K) by CLSM.
For some acquisitions, a 63×, 1.40 NA oil-immersion objective was used to acquire SIM (Fig. 1C; Supplemental Fig. S3, A and B), since similar objectives with similar NAs are routinely used for in vivo time-lapse imaging of plant cells (63×, 1.20 NA objective [Shaw et al., 2003; Van Damme et al., 2004] and 63×, 1.40 NA objective [Vos et al., 2004]). Although this objective allowed subdiffraction acquisitions with SIM (with an average FWHM of 146 ± 24 nm [mean ± sd; n = 24]; Supplemental Fig. S3, B and C), this value was inferior to the 100×, 1.57 NA oil-immersion objective that was used thereon for all microscopic applications.
Quantitative Analysis of Cortical Microtubule Bundles
The most powerful measure of a microscopy platform to resolve intracellular details is the ability to discriminate between very proximal structures. For this reason, we attempted to quantify the composition of cortical microtubule bundles, taking advantage of the extensive bundling observed in hypocotyl epidermal cells of the mpk4 mutant. The cortical microtubule bundle composition was approached in both wild-type and mpk4 hypocotyl epidermal cells labeled with the GFP-MBD microtubule marker by two alternative ways: intensity profiling and determination of the Rayleigh criterion.
First, bundles were quantified by means of additive fluorescence intensity. Ideally, this means that the maximum fluorescence intensity of a given bundle would increase linearly upon the successive addition of microtubules. However, it might be expected that, according to the specifications of the microscopy used, fluorescence intensities may become saturated after a certain point, making it impossible to further quantify microtubule bundles. Thus, the second criterion in this approach of the quantitation of microtubule bundles was to determine the maximum number of microtubules per bundle before fluorescence intensity was saturated.
By means of absolute fluorescence intensity, bundles visualized by SIM (Fig. 2, A–C, J, and K; Supplemental Fig. S4A) were resolvable with very good linear correlation (Fig. 2, B and C; n = 119, 99, 33, and 26 measurements for one, two, three, and four microtubules, respectively; all P values comparing absolute fluorescence intensity between one and two, two and three, and three and four microtubules were <0.001). By contrast, the linear correlation between microtubule numbers and bundle fluorescence intensity was inferior with WF (Fig. 2, D–F and K; Supplemental Fig. S4B), unable to discriminate between three and four microtubules (Fig. 2, E and F; n = 119, 99, 33, and 26 measurements for one, two, three, and four microtubules, respectively; P = 0.158 between three and four microtubules), and such correlations deteriorated even further with CLSM, showing saturation after two microtubules (Fig. 2, G–I and L; Supplemental Fig. S4C; n = 119, 99, 33, and 26 measurements for one, two, three, and four microtubules, respectively; P = 0.057 between two and three microtubules and P = 0.051 between three and four microtubules). Given the broad variability and the frequent saturation of fluorescence intensity of the microtubule bundles observed by WF and CLSM, profiles of such bundles were generated only in cells that were previously observed with SIM.
![Quantitative analysis of GFP-MBD-labeled cortical microtubule bundles by means of absolute fluorescence intensity comparing the resolution capacity of SIM, WF, and CLSM. A to C, SIM overview (A; Supplemental Fig. S4A) of an area with microtubule bundles with different microtubule numbers (one, blue line; two, red line; three, green line; and four, purple line) quantified by means of fluorescence intensity profiling (B) corresponding to the colored lines in A and quantitative evaluation of microtubule number per bundle (C; mean ± sd; R 2, linear correlation coefficient; *P < 0.001; n = 119, 99, 33, and 26 measurements for one, two, three, and four microtubules [MTs], respectively). D to F, The same area shown in A after WF acquisition (D; Supplemental Fig. S4B) with the representative (E) and the averaged (F) maximum fluorescence intensities (mean ± sd; *P < 0.001 comparing one with two and two with three microtubules; N.S., nonsignificant difference [P = 0.158 between three and four microtubules]; n = 119, 99, 33, and 26 measurements for one, two, three, and four microtubules, respectively). G to I, CLSM imaging (G; Supplemental Fig. S4C) of the same area depicted in A showing the representative (H) and the averaged (I) fluorescence intensities corresponding to increasing microtubule numbers per bundle (mean ± sd; *P < 0.001 comparing one with two microtubules; N.S., nonsignificant difference [P = 0.057 between two and three microtubules and P = 0.051 between three and four microtubules]; n = 119, 99, 33, and 26 measurements for one, two, three, and four microtubules, respectively). J to L, Detailed view (J) of the boxed area in A and the fluctuation of absolute fluorescence intensities along the longitudinal profile (represented by red, tan, and orange brackets in J; the white arrow points to a fluorescence intensity depression between the red and tan brackets) by SIM, WF (K), and CLSM (L). Brackets in K and L correspond to the fluorescence of the respective brackets in J. Note that the intensity along the red and tan brackets is well discriminated in SIM, declining incrementally (K), less discriminated in WF, declining nearly linearly (K), and not discriminated at all in CLSM (L). Black arrows in K and L correspond to the intensity drop marked with the white arrow in J. For clarity, the colored lines in A, D, and G, corresponding to the fluorescence intensity profiles plotted in B, E, and H, are twice as long as the actual profile length. Bars = 5 μm (A, D, and G) and 2.5 μm (J).](https://oup.silverchair-cdn.com/oup/backfile/Content_public/Journal/plphys/165/1/10.1104_pp.114.238477/2/m_plphys_v165_1_129_f2.jpeg?Expires=1716598825&Signature=KJu1rLIB2kDW0y~FhR6Cg0lGt-X5~hV1~EeJvLgfun-NRdOUXpbr~xP3T62z8tAY8gMxc9UEVyVvKAyFZxT3xAWIh4kFCOfw3ylL8gMayTeoco~-LkicZzInECKxE3zaMlWdySKKuscx3-UfbGXJ~NyCFh8spI8zocOtQktOFbewrr6f3Wt1RQQdIkK-bVUPSgJZ2yG2A5VHSLWCuEXnQXshNFkNlWPHFba1L5gReoKC1X2RtT08IrbHqUm0lFv0~AJPA2DuZLzKt5z3DfmYmJp5Z-9Dnc0aI5ACQHnSgOmvK9FjyNZxczHkBtH3m5nXKp3pRyRUvmAbckn~z6YQ4w__&Key-Pair-Id=APKAIE5G5CRDK6RD3PGA)
Quantitative analysis of GFP-MBD-labeled cortical microtubule bundles by means of absolute fluorescence intensity comparing the resolution capacity of SIM, WF, and CLSM. A to C, SIM overview (A; Supplemental Fig. S4A) of an area with microtubule bundles with different microtubule numbers (one, blue line; two, red line; three, green line; and four, purple line) quantified by means of fluorescence intensity profiling (B) corresponding to the colored lines in A and quantitative evaluation of microtubule number per bundle (C; mean ± sd; R 2, linear correlation coefficient; *P < 0.001; n = 119, 99, 33, and 26 measurements for one, two, three, and four microtubules [MTs], respectively). D to F, The same area shown in A after WF acquisition (D; Supplemental Fig. S4B) with the representative (E) and the averaged (F) maximum fluorescence intensities (mean ± sd; *P < 0.001 comparing one with two and two with three microtubules; N.S., nonsignificant difference [P = 0.158 between three and four microtubules]; n = 119, 99, 33, and 26 measurements for one, two, three, and four microtubules, respectively). G to I, CLSM imaging (G; Supplemental Fig. S4C) of the same area depicted in A showing the representative (H) and the averaged (I) fluorescence intensities corresponding to increasing microtubule numbers per bundle (mean ± sd; *P < 0.001 comparing one with two microtubules; N.S., nonsignificant difference [P = 0.057 between two and three microtubules and P = 0.051 between three and four microtubules]; n = 119, 99, 33, and 26 measurements for one, two, three, and four microtubules, respectively). J to L, Detailed view (J) of the boxed area in A and the fluctuation of absolute fluorescence intensities along the longitudinal profile (represented by red, tan, and orange brackets in J; the white arrow points to a fluorescence intensity depression between the red and tan brackets) by SIM, WF (K), and CLSM (L). Brackets in K and L correspond to the fluorescence of the respective brackets in J. Note that the intensity along the red and tan brackets is well discriminated in SIM, declining incrementally (K), less discriminated in WF, declining nearly linearly (K), and not discriminated at all in CLSM (L). Black arrows in K and L correspond to the intensity drop marked with the white arrow in J. For clarity, the colored lines in A, D, and G, corresponding to the fluorescence intensity profiles plotted in B, E, and H, are twice as long as the actual profile length. Bars = 5 μm (A, D, and G) and 2.5 μm (J).
In fluorescence microscopy, the application of the Rayleigh criterion deems two proximal structures separable when the minimum distance between them (peak-to-peak separation) allows a fluorescence intensity drop of approximately 25% of the maximum intensity of either one, provided that the two maximum intensities are nearly equal. In principle, at fluorescence intensity profiles of SIM showing pronounced peak separation (Fig. 3, A and D; Supplemental Fig. S5A), proximal microtubules were indiscriminable by WF (Fig. 3, B and E; Supplemental Fig. S5B) and CLSM (Fig. 3, C and F; Supplemental Fig. S5C). The application of the Rayleigh criterion proved to be particularly cumbersome, especially in the case of WF and CLSM, as it was difficult to locate proximal microtubules with nearly equal maximum fluorescence intensities. By applying the Rayleigh criterion comparatively, SIM showed the best discrimination capacity, being able to deem adjacent microtubules as separate ones at 131 ± 8 nm (mean ± sd; n = 32; Fig. 3, G, J, and M; Supplemental Fig. S5D), while this distance was 236 ± 17 nm for WF (mean ± sd; n = 32; Fig. 3, H, K, and M; Supplemental Fig. S5E) and 243 ± 16 nm for CLSM (mean ± sd; n = 32; Fig. 3, I, L, and M; Supplemental Fig. S5F).
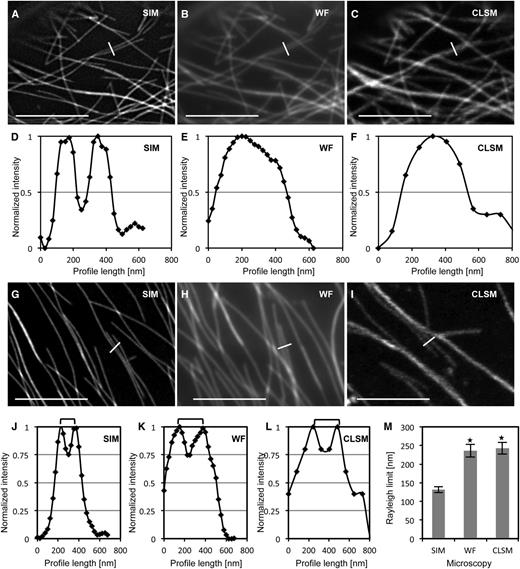
Resolution of proximal cortical microtubules labeled with the GFP-MBD microtubule marker, comparing SIM, WF, and CLSM. A to C, The same cortical area of a hypocotyl epidermal cell expressing the GFP-MBD fusion protein showing two adjacent microtubules by SIM (A; full view in Supplemental Fig. S5A), WF (B; full view in Supplemental Fig. S5B), and CLSM (C; full view in Supplemental Fig. S5C). D to F, Normalized fluorescence intensity profiles corresponding to the white lines in A to C, showing clear discrimination of the two adjacent microtubules as two peaks in SIM (D), in contrast to the fluorescence intensity profiles obtained from the respective WF (E) and CLSM (F) acquisitions, showing only one peak. G to I, Different areas from the same cell visualized with SIM (G; full view in Supplemental Fig. S5D), WF (H; full view in Supplemental Fig. S5E), and CLSM (I; full view in Supplemental Fig. S5F). White lines across adjacent microtubules represent the positions from which fluorescence intensity profiles were acquired and correspond to the Rayleigh resolution limit (i.e. peak-to-peak discrimination at approximately 25% depression of maximum fluorescence intensity). J to L, Quantitation of the corresponding intensity profiles shown in G to I. Brackets denote the peak-to-peak separation at the Rayleigh limit. M, Graph depiction of the averaged Rayleigh limits measured for SIM, WF, and CLSM (mean ± sd; n = 32 measurements in all cases; *P < 0.001 comparing Rayleigh limits from SIM with WF and CLSM). Bars = 5 μm.
Individual Microtubule Dynamics
Although SIM provides greatly improved resolution with respect to commonly used descriptive microscopies such as CLSM and WF, there are other superresolution approaches, including PALM/STORM and STED, that can apparently resolve subcellular structures at a nearly molecular level. However, PALM/STORM reconstructs superresolution images from raw acquisitions in a time scale of minutes (Cox and Jones, 2013). STED, although much faster, has limitations to time-lapse imaging of very small fields of view (Westphal et al., 2008) while additionally being phototoxic. Thus, the main challenge for SIM would be to evaluate its potential for time-lapse imaging. It is noteworthy that only a few studies of this kind (Kner et al., 2009; Shao et al., 2011; Fiolka et al., 2012) have been published during the 14-year period from the first introduction of SIM (Gustafsson, 2000). Although SIM has been demonstrated previously in plants (Fitzgibbon et al., 2010, 2013; Liesche et al., 2013; Linnik et al., 2013), its capacity for time-lapse recordings necessary for quantitative dynamic plant cell studies was never shown before.
To test the efficiency of SIM for time-lapse imaging, acquisition settings were adjusted to achieve the best possible compromise between spatial and temporal resolution for SIM, resulting in an effective time interval of 2.6 s (for a detailed description of SIM adjustments for time-lapse imaging, see “Materials and Methods”). This interval is well within the accepted published range required to resolve microtubule dynamics (Shaw et al., 2003; Buschmann et al., 2010), and it was uniformly used as a standard time interval to acquire time-lapse series of cortical microtubule dynamics in all other microscopies used here (WF, CLSM, TIRFM, and SD), as specified in “Materials and Methods.” In all cases of imaging, the acquisition settings were adjusted toward optimal lateral resolution for the given time frame.
Again, the spatial resolution was quantitatively defined by recording the FWHM of a number of averaged, coaligned, and finally normalized transverse intensity profiles centered on individual microtubules. For GFP-MBD-labeled microtubules, the recorded resolution of SIM was 135 ± 11 nm (mean ± sd; n = 41; Fig. 4A), while for WF it was 226 ± 8 nm (mean ± sd; n = 41; Fig. 4C), for CLSM it was 238 ± 11 nm (mean ± sd; n = 41; Fig. 4E), for TIRFM it was 274 ± 14 nm (mean ± sd; n = 41; Fig. 4G), and for SD it was 323 ± 21 nm (mean ± sd; n = 54; Fig. 4I). With the SIM module, GFP-TUA6-labeled microtubules were resolved at 133 ± 8 nm (mean ± sd; n = 71; Fig. 4B), while the respective resolution for WF was 225 ± 16 nm (mean ± sd; n = 71; Fig. 4D), for CLSM it was 305 ± 19 nm (mean ± sd; n = 43; Fig. 4F), for TIRFM it was 283 ± 19 nm (mean ± sd; n = 47; Fig. 4H), and for SD it was 309 ± 21 nm (mean ± sd; n = 83; Fig. 4J). The above values correspond to previously published information on the resolution in previously described microscopic techniques (Zucker and Price, 1999; Wang et al., 2005). From these data, it was concluded that the resolution of SIM, even after the compromises for time-lapse imaging, significantly exceeded that of WF, CLSM, TIRFM, and SD. Since SIM clearly outperformed all other techniques, the next sections are focused on time-lapse SIM for quantitative dynamic imaging of cortical microtubules.
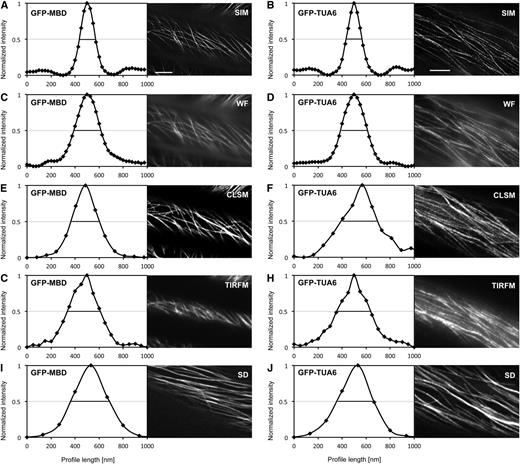
Resolution of individual cortical microtubules of Arabidopsis hypocotyl epidermal cells, labeled with GFP-MBD (A, C, E, G, and I) or GFP-TUA6 (B, D, F, H, and J), during time-lapse imaging with SIM (A and B), WF (C and D), CLSM (E and F), TIRFM (G and H), and SD (I and J). Scatterplots represent averaged weighted profiles of many individual microtubules. A and B, Resolution of individual cortical microtubules labeled with GFP-MBD (A; n = 40) and GFP-TUA6 (B; n = 71) after SIM imaging. C and D, Resolution of individual cortical microtubules labeled with GFP-MBD (C; n = 40) and GFP-TUA6 (D; n = 71) after WF imaging. E and F, Resolution of individual cortical microtubules labeled with GFP-MBD (E; n = 41) and GFP-TUA6 (F; n = 43) after CLSM imaging. G and H, Resolution of individual cortical microtubules labeled with GFP-MBD (G; n = 41) and GFP-TUA6 (H; n = 47) after TIRFM imaging. I and J, Resolution of individual cortical microtubules labeled with GFP-MBD (I; n = 54) and GFP-TUA6 (J; n = 83) after SD imaging. Black lines are positioned to a normalized fluorescence intensity (0.5) corresponding to the FWHM of each respective curve. Bars = 5 μm.
In quantitative terms, cortical microtubules of hypocotyl epidermal cells stably transformed with GFP-MBD or GFP-TUA6 exhibited alternating periods of growth succeeded by fast shrinkage (Fig. 5, A, B, E, and F; Supplemental Fig. S6, A–D; Supplemental Videos S1 and S2). This behavior of cortical microtubules was best illustrated by the respective kymographs (Fig. 5, C, D, G, and H). Moreover, kymographs of GFP-TUA6-labeled microtubules exhibiting dynamics at both ends revealed the appearance of successive bright and dark stripes that remained vertical throughout the entire observation time (Fig. 5, G and H). Such stripes correspond to the discontinuous incorporation of GFP-TUA6 in the microtubule lattice, as described previously (Fig. 1B; Supplemental Figs. S1D and S2, A and C; Kner et al., 2009). The rates of growth and shrinkage were extrapolated from kymographic analyses of the highly dynamic plus end and the less dynamic minus end. The respective growth and shrinkage rates of the plus end of individual GFP-MBD-labeled microtubules were 6.15 ± 3.06 μm min−1 (mean ± sd; n = 65; Fig. 5O; Supplemental Tables S1 and S2) and 17.65 ± 7.39 μm min−1 (mean ± sd; n = 65; Fig. 5O; Supplemental Tables S1 and S2), while at the minus end, GFP-MBD-labeled microtubules were growing and shrinking at 1 ± 0.98 μm min−1 (mean ± sd; n = 41; Fig. 5O; Supplemental Tables S1 and S2) and 0.97 ± 0.95 μm min−1 (mean ± sd; n = 33; Fig. 5O; Supplemental Tables S1 and S2). In the case of GFP-TUA6-labeled microtubules, the plus end was growing and shrinking at 7.84 ± 3.59 μm min−1 (mean ± sd; n = 63; Fig. 5O; Supplemental Tables S1 and S2) and 18.22 ± 5.74 μm min−1 (mean ± sd; n = 41; Fig. 5O; Supplemental Tables S1 and S2), respectively. At the minus end, the respective rates were 1.7 ± 1.74 μm min−1 (mean ± sd; n = 23; Fig. 5O; Supplemental Tables S1 and S2) and 1.19 ± 1.12 μm min−1 (mean ± sd; n = 26; Fig. 5O; Supplemental Tables S1 and S2). As illustrated (Fig. 5O) and summarized in Supplemental Tables S1 and S2, the above measurements are within previously published rates of microtubule growth and shrinkage for both constructs (Dhonukshe and Gadella, 2003; Shaw et al., 2003; Van Damme et al., 2004; Vos et al., 2004), suggesting that SIM can provide a new tool for time-lapse imaging of cortical microtubule dynamics offering significantly higher resolution than commonly used techniques.
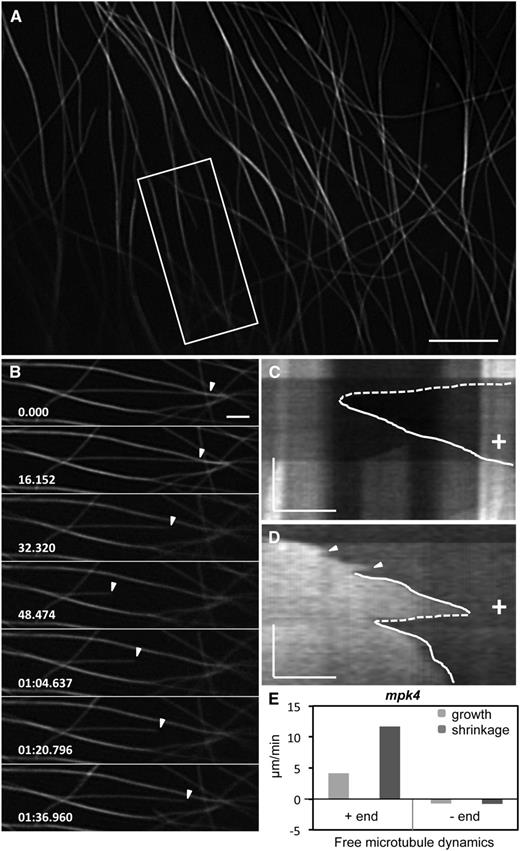
![Independent and intrabundle dynamics of GFP-MBD- and GFP-TUA6-labeled cortical microtubules visualized by SIM. A to C, Overview of a hypocotyl epidermal cell expressing the GFP-MBD microtubule marker during time-lapse imaging with SIM (A), selected stills of a free microtubule visible at both ends (right boxed area in A; B), and respective kymograph of the same microtubule exhibiting short-length transitions of growth and shrinkage (arrowheads; C). D, Kymograph representing the dynamics of a free cortical microtubule (corresponds to Supplemental Fig. S6, A and B; Supplemental Video S1) visible at one end showing smooth, uninterrupted growth (solid lines) and shrinkage (catastrophe; dotted line). E to G, Overview of a hypocotyl epidermal cell expressing the GFP-TUA6 microtubule marker (E), selected stills of a fully visible independent microtubule (boxed area in E; F [arrowheads point to the plus end]; Supplemental Video S2), and respective kymograph showing dark and bright striations owing to the inhomogenous incorporation of GFP-TUA6 in the microtubule lattice (G). H, Another kymograph of a GFP-TUA6-labeled microtubule where minus-end behavior can be followed (corresponds to Supplemental Fig. S6, C and D). I, Selected stills of a microtubule growing within a bundle from the top right boxed area in A. J, The respective kymograph showing vigorous plus-end dynamics and short-length excursions in the plus end (arrowheads) and minimal dynamics at the minus end. K, Longitudinal fluorescence intensity profile along the bundle encompassing the microtubule tracked in I. L, Selected stills of a short intrabundle microtubule (arrowheads) selected from the left boxed area of A. M, The corresponding kymograph of the microtubule in L showing frequent and short-length transitions in the plus end (closed arrowheads) and dynamic instability at the minus end (open arrowheads). N, Longitudinal fluorescence intensity profile harboring the short intrabundle microtubule depicted in L. O and P, Graphs depicting average plus-end and minus-end growth and shrinkage rates reported for GFP-MBD- and GFP-TUA6-labeled extrabundle (O) and intrabundle (P) microtubules from the values summarized in Supplemental Tables S1 and S3 for free and intrabundle microtubules, respectively. All closed arrowheads point to plus ends and all open arrowheads point to minus ends. The time bars in kymographs are as follows: 127.85 s (C), 80 s (M), 60 s (J), 34.5 s (D), 30 s (G), and 10 s (H). + indicates microtubule plus ends and − indicates microtubule minus ends. Numbers in B, F, I, and L are in minutes:seconds.milliseconds. In all kymographs (C, D, G, H, J, and M), time evolution is from top to bottom. Bars = 5 μm (A and E), 2 μm (B, F, G, and L), 1 μm (C, D, I, J, and M), and 0.5 μm (H).](https://oup.silverchair-cdn.com/oup/backfile/Content_public/Journal/plphys/165/1/10.1104_pp.114.238477/2/m_plphys_v165_1_129_f5.jpeg?Expires=1716598825&Signature=s6eQsol0~XMKRXXiqIl0zeZOqEEWZQpgY3ZZWBq9FUqUnDnLiAVMFanlYEJcwr~zj6psTtLqCpGyfd24l59hk9qEePT6rjH~hu5BBLdNs2G1gWsA-qJJ9XGPdXMwxSTdaB7TPXWpSzjqxpf8cLZoGagiLf9PpHT43ohuo6flUMUGiLTqggnCcwWaGBsg0fzht~5PQh0~6jFnNWsj4KCUwH93XIv5rpy8IE4gDov-udRwd-2pVhT1IQBo3~fN6gznAZIO-JiX7k~1jQC-gFORHhQODF0m0~EKy32O~I2wVcD1W4TlJdgTKLSWmW2b2Y2H2DkML-8nS0dYsVDpSRJBCg__&Key-Pair-Id=APKAIE5G5CRDK6RD3PGA)
Independent and intrabundle dynamics of GFP-MBD- and GFP-TUA6-labeled cortical microtubules visualized by SIM. A to C, Overview of a hypocotyl epidermal cell expressing the GFP-MBD microtubule marker during time-lapse imaging with SIM (A), selected stills of a free microtubule visible at both ends (right boxed area in A; B), and respective kymograph of the same microtubule exhibiting short-length transitions of growth and shrinkage (arrowheads; C). D, Kymograph representing the dynamics of a free cortical microtubule (corresponds to Supplemental Fig. S6, A and B; Supplemental Video S1) visible at one end showing smooth, uninterrupted growth (solid lines) and shrinkage (catastrophe; dotted line). E to G, Overview of a hypocotyl epidermal cell expressing the GFP-TUA6 microtubule marker (E), selected stills of a fully visible independent microtubule (boxed area in E; F [arrowheads point to the plus end]; Supplemental Video S2), and respective kymograph showing dark and bright striations owing to the inhomogenous incorporation of GFP-TUA6 in the microtubule lattice (G). H, Another kymograph of a GFP-TUA6-labeled microtubule where minus-end behavior can be followed (corresponds to Supplemental Fig. S6, C and D). I, Selected stills of a microtubule growing within a bundle from the top right boxed area in A. J, The respective kymograph showing vigorous plus-end dynamics and short-length excursions in the plus end (arrowheads) and minimal dynamics at the minus end. K, Longitudinal fluorescence intensity profile along the bundle encompassing the microtubule tracked in I. L, Selected stills of a short intrabundle microtubule (arrowheads) selected from the left boxed area of A. M, The corresponding kymograph of the microtubule in L showing frequent and short-length transitions in the plus end (closed arrowheads) and dynamic instability at the minus end (open arrowheads). N, Longitudinal fluorescence intensity profile harboring the short intrabundle microtubule depicted in L. O and P, Graphs depicting average plus-end and minus-end growth and shrinkage rates reported for GFP-MBD- and GFP-TUA6-labeled extrabundle (O) and intrabundle (P) microtubules from the values summarized in Supplemental Tables S1 and S3 for free and intrabundle microtubules, respectively. All closed arrowheads point to plus ends and all open arrowheads point to minus ends. The time bars in kymographs are as follows: 127.85 s (C), 80 s (M), 60 s (J), 34.5 s (D), 30 s (G), and 10 s (H). + indicates microtubule plus ends and − indicates microtubule minus ends. Numbers in B, F, I, and L are in minutes:seconds.milliseconds. In all kymographs (C, D, G, H, J, and M), time evolution is from top to bottom. Bars = 5 μm (A and E), 2 μm (B, F, G, and L), 1 μm (C, D, I, J, and M), and 0.5 μm (H).
Frequently in kymographs from SIM recordings, short-length growth and shrinkage events were observed. Such length changes were approximately 200 nm (Fig. 5C), and they were smaller than the resolution limits reported for time-lapse WF, CLSM, TIRFM, and SD. Such events were also taken together for calculating catastrophe and rescue frequencies of individual microtubules according to published procedures (Dhonukshe and Gadella, 2003). Moreover, catastrophe and rescue frequencies were comparatively measured between SIM and WF, because such images were acquired simultaneously.
The overall catastrophe frequency of GFP-MBD-labeled microtubule plus ends was 0.020 events s−1 and the rescue frequency was 0.022 events s−1 when measured on WF acquisitions. With SIM, the catastrophe and rescue frequencies that were measured for the same microtubules as for WF were 0.031 and 0.033 events s−1, respectively (n = 30 microtubules representing 47 min of observation).
Intrabundle Microtubule Dynamics
Microtubule bundles are not static entities, and individual microtubules exhibit vigorous dynamic behavior within the crowded environment of a bundle similarly to independent microtubules (Shaw and Lucas, 2011).
As previously shown, SIM offers superior contrast resolution, allowing the nearly linear titration of bundled microtubule numbers by means of fluorescence intensity in the case of overlying microtubules and by means of the Rayleigh criterion for laterally adjacent microtubules. Thus, it was possible to follow and demonstrate intrabundle microtubule dynamics (Fig. 5, A and I–N) by kymographic analyses (Fig. 5, J and M), showing that end-wise growth and shrinkage rates are comparable to those observed in free microtubules (Shaw and Lucas, 2011; Fig. 5P; Supplemental Tables S3 and S4). Briefly, plus ends of intrabundle microtubules were growing and shrinking at 7.37 ± 3.27 μm min−1 (mean ± sd; n = 31; Fig. 5P; Supplemental Tables S3 and S4) and 19.28 ± 4.86 μm min−1 (mean ± sd; n = 33; Fig. 5P; Supplemental Tables S3 and S4), respectively. Accordingly, the respective growth and shrinkage rates of minus ends were 0.89 ± 0.83 μm min−1 (mean ± sd; n = 37; Fig. 5P; Supplemental Tables S3 and S4) and 1.05 ± 1.10 μm min−1 (mean ± sd; n = 33; Fig. 5P; Supplemental Tables S3 and S4). Similarly, plus end growth and shrinkage rates for GFP-TUA6-labeled intrabundle microtubules were 8.08 ± 3.98 μm min−1 (mean ± sd; n = 31; Fig. 5P; Supplemental Tables S3 and S4) and 21.41 ± 7.95 μm min−1 (mean ± sd; n = 35; Fig. 5P; Supplemental Tables S3 and S4). For the minus ends that were observed, the respective values were 0.83 ± 1.53 μm min−1 (mean ± sd; n = 31; Fig. 5P; Supplemental Tables S3 and S4) and 0.89 ± 1.05 μm min−1 (mean ± sd; n = 31; Fig. 5P; Supplemental Tables S3 and S4).
From the kymographs of intrabundle microtubule dynamics, it appeared that at the temporal range of observations (which was between 3 and 5 min for all the time-lapse acquisitions), there were more catastrophe/rescue transitions in intrabundle microtubules than those observed in individual microtubules. In this case, short-length excursions, resulting from successive rescue/catastrophe transitions, of approximately 200 nm visible by SIM (Fig. 5, J and M, arrowheads) were also considered; hence, the overall catastrophe frequency of plus ends of intrabundle microtubules was 0.032 events s−1 while the rescue frequency was 0.037 events s−1 (n = 112 microtubules representing 321 min of observation).
When visible, most minus ends exhibited very slow dynamics and few transitions (Fig. 5J). Exceptionally, very few short microtubules exhibited vigorous minus-end dynamics, with alternating short-length growth and shrinkage resembling dynamic instability (Fig. 5M).
Microtubule Dynamics of the mpk4 Mutant
The bulk of cortical microtubules of hypocotyl epidermal cells of the mpk4 mutant reside within bundles; therefore, it was of interest to provide a preliminary characterization of extrabundle and intrabundle microtubule dynamics for this mutant.
Thus, the dynamic behavior of free (Fig. 6) and bundled (Fig. 7; Supplemental Fig. S7) microtubules was characterized by SIM. Quantitative analysis based on kymographs (Fig. 6, C and D) showed that free microtubule ends of GFP-MBD-labeled cortical microtubules grow and shrink at variable rates, while frequently the same microtubule showed different growth and shrinkage rates during successive events of rescue and catastrophe (Fig. 6D). This resulted in marginal lower rates of growth compared with the wild type, at 4.14 ± 2.36 μm min−1 (mean ± sd; n = 29; Fig. 6E; Supplemental Tables S1 and S2 [by comparison with plus-end dynamics of GFP-MBD-labeled microtubules from wild-type cells; P = 0.0012]), but a more pronounced decline in shrinkage rates, which were measured at 11.68 ± 5.63 μm min−1 (mean ± sd; n = 34; Fig. 6E; Supplemental Tables S1 and S2 [by comparison with plus-end dynamics of GFP-MBD-labeled microtubules from wild-type cells; P = 0.00056]). By contrast, the minus-end growth and shrinkage rates were not significantly affected, with elongation rated at 0.75 ± 0.75 μm min−1 (mean ± sd; n = 36; Fig. 6E; Supplemental Tables S1 and S2 [by comparison with plus-end dynamics of GFP-MBD-labeled microtubules from wild-type cells; P = 0.22]) and shrinkage at 0.81 ± 0.83 μm min−1 (mean ± sd; n = 32; Fig. 6E; Supplemental Tables S1 and S2 [by comparison with plus-end dynamics of GFP-MBD-labeled microtubules from wild-type cells; P = 0.50]).
Overview of independent cortical microtubule dynamics of hypocotyl epidermal cells of the mpk4 mutant expressing the GFP-MBD fusion protein, as visualized by SIM and quantified accordingly. A to C, SIM overview (A), selected stills from the boxed area in A (B), and respective kymograph showing a shrinkage (C, dotted line) and a successive growth event (C, solid line). D, Another kymograph of a free-growing microtubule showing two growth phases with different rates (solid lines) interrupted by one catastrophe (dotted line). Arrowheads denote minor transitions. E, Graphic illustration of the plus-end and minus-end dynamics of free microtubules observed by SIM in hypocotyl epidermal cells of GFP-MBD-transformed mpk4 mutants as summarized in Supplemental Table S1. The time bars in C and D represent 60 s. + indicates microtubule plus ends. Numbers in B are in minutes:seconds.milliseconds. In the kymographs (C and D), time evolution is from top to bottom. Bars = 5 μm (A), 2 μm (B), and 1 μm (C and D).
![Intrabundle microtubule dynamics of the GFP-MBD-expressing mpk4 mutant as acquired with SIM. A, Overview (see Supplemental Video S3) of an mpk4 hypocotyl epidermal cell with GFP-MBD-labeled microtubules, exhibiting extensive cortical microtubule bundling (boxed areas). B, Selected stills of a short microtubule (from the left bottom boxed area in A; open arrowheads) growing on the tip of a cortical microtubule bundle. From the same bundle, a free microtubule extends away by its plus end (red arrowheads). Temporal changes of the longitudinal profile illustrated in H can be seen in Supplemental Figure S7. C, Selected stills from the right boxed area in A of a microtubule bundle showing two discrete short microtubules (denoted by orange and white closed arrowheads). The red closed arrowhead shows a depolymerizing microtubule in the same bundle, and the closed and open blue arrowheads show a short gap visible as a steep fluorescence intensity depression in I. D, Selected stills of a short microtubule growing (closed arrowheads) upon a bundle from the top left boxed area in A. E to G, Kymographs corresponding to B (E), C (F), and D (G). Arrowheads track the respective positions shown in B to D. H to J, Longitudinal fluorescence intensity profiles drawn along the microtubule bundles depicted in the last frames of B (H), C (I), and D (J). K, Vertical fluorescence intensity profiles corresponding to the colored lines in the last frame of B (blue line, one microtubule; red line, two microtubules; green line, three microtubules [MTs]), demonstrating the complexity of the respective bundle. L, Graph depiction of plus-end and minus-end intrabundle microtubule dynamics in the mpk4 mutant as summarized in Supplemental Tables S3 and S4. The time bars in the kymographs (E–G) represent 35 s. Numbers in B to D are in minutes:seconds.milliseconds. In all kymographs (E–G), time evolution is from top to bottom. Bars = 5 μm (A), 2 μm (B–D), 1 μm (F), and 0.5 μm (E and G).](https://oup.silverchair-cdn.com/oup/backfile/Content_public/Journal/plphys/165/1/10.1104_pp.114.238477/2/m_plphys_v165_1_129_f7.jpeg?Expires=1716598825&Signature=mXsKNQvqnFmCL-FXuvd1EgH3FU2gH8GM9gcyOgiZgMn7ML46WoMuLtLpQlSZ~xy8038mNKOHXpu9SW8DQ0csUWw4JGkCHswzJJofgnDd4iNgwR57cIWuaXB4PF44MJrAUU11CN7A1QBoNMBNE0uOFINBmgAHFh1LMjit3R18jh1rnBgo83i7hEy7dUHjL-VjHkqc2tdkwdtFvS5SGdk9Zl4vHGyaQCUoYpJ0OtJNG~0tHdInZWceLMMuh-bKvGdphtmRUL3E5qBnf1eaywsUmKhOjeJ9OQdtKXLzDXdYVfNaJGVdxW04sm3Puo7-UpxB~xEOaHU~~BLtcv4R3xdn3A__&Key-Pair-Id=APKAIE5G5CRDK6RD3PGA)
Intrabundle microtubule dynamics of the GFP-MBD-expressing mpk4 mutant as acquired with SIM. A, Overview (see Supplemental Video S3) of an mpk4 hypocotyl epidermal cell with GFP-MBD-labeled microtubules, exhibiting extensive cortical microtubule bundling (boxed areas). B, Selected stills of a short microtubule (from the left bottom boxed area in A; open arrowheads) growing on the tip of a cortical microtubule bundle. From the same bundle, a free microtubule extends away by its plus end (red arrowheads). Temporal changes of the longitudinal profile illustrated in H can be seen in Supplemental Figure S7. C, Selected stills from the right boxed area in A of a microtubule bundle showing two discrete short microtubules (denoted by orange and white closed arrowheads). The red closed arrowhead shows a depolymerizing microtubule in the same bundle, and the closed and open blue arrowheads show a short gap visible as a steep fluorescence intensity depression in I. D, Selected stills of a short microtubule growing (closed arrowheads) upon a bundle from the top left boxed area in A. E to G, Kymographs corresponding to B (E), C (F), and D (G). Arrowheads track the respective positions shown in B to D. H to J, Longitudinal fluorescence intensity profiles drawn along the microtubule bundles depicted in the last frames of B (H), C (I), and D (J). K, Vertical fluorescence intensity profiles corresponding to the colored lines in the last frame of B (blue line, one microtubule; red line, two microtubules; green line, three microtubules [MTs]), demonstrating the complexity of the respective bundle. L, Graph depiction of plus-end and minus-end intrabundle microtubule dynamics in the mpk4 mutant as summarized in Supplemental Tables S3 and S4. The time bars in the kymographs (E–G) represent 35 s. Numbers in B to D are in minutes:seconds.milliseconds. In all kymographs (E–G), time evolution is from top to bottom. Bars = 5 μm (A), 2 μm (B–D), 1 μm (F), and 0.5 μm (E and G).
Notably, the small-length excursions that were reported for free ends of GFP-MBD-labeled cortical microtubules from wild-type cells as well as the overall growth/shrinkage transitions appeared to be less frequent in the mpk4 mutant. Therefore, overall catastrophe and rescue frequencies were quantified, and their respective values were 0.016 events s−1 (catastrophe frequency; n = 30 microtubules representing 82 min of observation) and 0.016 events s−1 (rescue frequency; n = 30 microtubules representing 82 min of observation).
Intrabundle cortical microtubule dynamics were also addressed in the mpk4 mutant (Fig. 7; Supplemental Fig. S7; Supplemental Video S3), and in this case, growth and shrinkage rates as well as catastrophe and rescue frequencies were found similarly reduced. Thus, based on kymographs (Fig. 7, E–G), intrabundle microtubule plus ends were growing at 4.45 ± 3.27 μm min−1 (mean ± sd; n = 22; Fig. 7L; Supplemental Tables S3 and S4 [by comparison with plus-end dynamics of GFP-MBD-labeled microtubules from wild-type cells; P = 0.0053]) and shrinking at 5.81 ± 5.20 μm min−1 (mean ± sd; n = 32; Fig. 7L; Supplemental Tables S3 and S4 [by comparison with plus-end dynamics of GFP-MBD-labeled microtubules from wild-type cells; P < 0.0001]). The respective rates for discernible minus ends were 0.47 ± 0.63 μm min−1 (mean ± sd; n = 37; Fig. 7L; Supplemental Tables S3 and S4 [by comparison with plus-end dynamics of GFP-MBD-labeled microtubules from wild-type cells; P < 0.023]) and 0.69 ± 0.88 μm min−1 (mean ± sd; n = 32; Fig. 7L; Supplemental Tables S3 and S4 [by comparison with plus-end dynamics of GFP-MBD-labeled microtubules from wild-type cells; P = 0.11]). The catastrophe and rescue frequencies were 0.015 and 0.020 events s−1, respectively (n = 89 microtubules representing 285 min of observation).
Side observations of microtubule organization in the mpk4 mutant showed the formation of short, rigid, and nongrowing microtubule bundles (Fig. 8, A, B, and E) consisting of three to four microtubules, as judged by their maximum fluorescence intensity (Fig. 8F). These were often positioned free in the cytoplasm but frequently formed tip-wise attachments with the walls of microtubules or microtubule bundles (Fig. 8E). When attached, these bundles were either gliding over short distances (Fig. 8, B–D) or swinging around the attachment point (Fig. 8B).
![Lateral-tip interaction between aberrant, short, and rigid microtubule bundles with the walls of individual microtubules labeled with the GFP-MBD marker in the mpk4 mutant as visualized by SIM. A and B, Overview of a hypocotyl epidermal cell of the mpk4 mutant expressing the GFP-MBD fusion protein as in Figure 7A (A; Supplemental Video S3) and time series of two short and rigid microtubule bundles (from the boxed area in A; B). The first bundle (closed arrowheads) shows short-range rapid gliding along the mother microtubule. The second bundle (open arrowheads) swings freely and randomly around its stable anchorage on the site of the mother microtubule. C and D, Respective kymographs of the short, rigid bundles shown with closed and open arrowheads in B to demonstrate their rapid, random motility while maintaining stable attachments (C; the arrowhead shows the tip of the rigid bundle indicated by the open arrowheads in B as it approaches an opposing microtubule [arrow in B, asterisk in C]; the arrowhead shows back and forward gliding transitions). E and F, Absolute fluorescence intensity profiling (dark gray) of the microtubule bundle (open arrowheads in B) referenced against a single microtubule (MT; light gray). The fluorescence intensity of the bundle is about 3-fold increased compared with that of the individual microtubule, suggesting that it comprises three microtubules. Numbers on the time frames are in minutes:seconds.milliseconds. The time bars in the kymographs represent 35.16 s. In the kymographs (C and D), time evolution is from top to bottom. Bars = 5 μm (A), 1 μm (B and E), and 0.5 μm (C and D).](https://oup.silverchair-cdn.com/oup/backfile/Content_public/Journal/plphys/165/1/10.1104_pp.114.238477/2/m_plphys_v165_1_129_f8.jpeg?Expires=1716598825&Signature=BZD7SWqYdordv8d-yb5gJBKH84LvATmqzGeopuigIFWpAAVZR75qgvlQiKtf~Peel0Hwb0~r2QNPFdREpDjLIYsDkU9h1BNAQ8AFUsDyuP-TU~e91Ug1jMdO2COWQQB7FYpEd7hs6BfQlArrr4tXvhpINsziqSNyPdpf9outkVSFQ3dRg-DMDai0~bpQHvMeScMHjLGbvtX08Ogx6KzGjB55BdZoK-rYjLF~EGDo2AXOljjqvqEnHF7gLu~oH0u6dXKZrVkDu4cs39dirh1J87LbjNqemCub-PDCX1iiwR5GlmuAf9HoFk3tdlUrLxaLX33QZ5f0ox5m72DCO0EmCw__&Key-Pair-Id=APKAIE5G5CRDK6RD3PGA)
Lateral-tip interaction between aberrant, short, and rigid microtubule bundles with the walls of individual microtubules labeled with the GFP-MBD marker in the mpk4 mutant as visualized by SIM. A and B, Overview of a hypocotyl epidermal cell of the mpk4 mutant expressing the GFP-MBD fusion protein as in Figure 7A (A; Supplemental Video S3) and time series of two short and rigid microtubule bundles (from the boxed area in A; B). The first bundle (closed arrowheads) shows short-range rapid gliding along the mother microtubule. The second bundle (open arrowheads) swings freely and randomly around its stable anchorage on the site of the mother microtubule. C and D, Respective kymographs of the short, rigid bundles shown with closed and open arrowheads in B to demonstrate their rapid, random motility while maintaining stable attachments (C; the arrowhead shows the tip of the rigid bundle indicated by the open arrowheads in B as it approaches an opposing microtubule [arrow in B, asterisk in C]; the arrowhead shows back and forward gliding transitions). E and F, Absolute fluorescence intensity profiling (dark gray) of the microtubule bundle (open arrowheads in B) referenced against a single microtubule (MT; light gray). The fluorescence intensity of the bundle is about 3-fold increased compared with that of the individual microtubule, suggesting that it comprises three microtubules. Numbers on the time frames are in minutes:seconds.milliseconds. The time bars in the kymographs represent 35.16 s. In the kymographs (C and D), time evolution is from top to bottom. Bars = 5 μm (A), 1 μm (B and E), and 0.5 μm (C and D).
DISCUSSION
General Remarks
The temporal resolution of intracellular dynamics always progressed together with advances in microscopy (Waterman-Storer, 1998). In this respect, superresolution techniques that were developed and vigorously upgraded during the past two decades (Hensel et al., 2013) are slowly implemented to biological studies of dynamic subcellular events (Rego et al., 2012). To date, platforms of patterned illumination (e.g. STED and SIM; Hell, 2007, Allen et al., 2014) or precision of localization (e.g. PALM and STORM; Small and Parthasarathy, 2014) superresolution microscopies are commercially available, making superresolution imaging widely accessible.
Knowledge of microtubule dynamics and organization, and their regulation by various MAPs, was largely advanced by in vitro imaging of purified components (Dogterom and Surrey, 2013). In such assays, fluorescently labeled or unlabeled microtubules grow in observation chambers, nearly attached to the coverslip; hence, they can be very clearly recorded at video rates. However, the in vitro acquisition of microtubule dynamics is very frequently conflicting with more physiological in vivo studies (Li et al., 2012; Zanic et al., 2013).
In plants, a fine example of such discrepancy can be found in the elucidation of the dynamics of in vitro-assembled and MAP-free carrot (Daucus carota) tubulin by Allen’s video-enhanced contrast-differential interference contrast microscopy (Moore et al., 1997). Thereby, a stunning shortening velocity of 195 μm min−1 was reported, being nearly 10 times higher than the respective rates recorded in vivo on microtubules labeled with various markers, such as microinjected fluorophore-conjugated brain tubulin, GFP-MBD, GFP-TUA6, GFP-MAP65-1, or GFP-EB1a (Zhang et al., 1990; Dhonukshe and Gadella, 2003; Shaw et al., 2003; Van Damme et al., 2004; Vos et al., 2004).
Subdiffraction Microtubule Organization
Considering the above, SIM was applied to study the organization of cortical microtubule arrays in hypocotyl epidermal cells of Arabidopsis stably transformed with GFP-MBD and GFP-TUA6 markers. Due to the propensity of plant cortical microtubule arrays to form extensive bundles (Wasteneys and Ambrose, 2009), SIM observations were extended to hypocotyl epidermal cells of the mpk4 mutant, where microtubule bundle formation is more pronounced (Beck et al., 2010).
The point-spread function of individual microtubules was determined experimentally for both GFP-MBD- and GFP-TUA6-labeled microtubules by means of normalized fluorescence intensity profiling and determination of the FWHM for transverse profiles of such microtubules. As expected from the specifications of the SIM platform used (see “Materials and Methods”) and the theory behind superresolution imaging with SIM (Gustafsson, 2000), resolution after high-performance imaging (for details, see “Materials and Methods”) was nearly twice as good as the ideal diffraction-limited resolution, which cannot exceed 200 nm (Abbe’s limit; Verdaasdonk et al., 2014), and it reached 106 nm for GFP-MBD-labeled microtubules and 117 nm for GFP-TUA6-labeled microtubules. These values are very close to the theoretical 100-nm resolution predicted for linear SIM (Gustafsson, 2000, Verdaasdonk et al., 2014). In the same manner, high-quality acquisitions with WF and CLSM were considerably above Abbe’s limit (roughly between 225 and 325 nm) but nevertheless within the limits reported for such microscopies (Zucker and Price, 1999; Salmon and Waterman, 2011).
SIM imaging revealed discontinuous incorporation of GFP-TUA6 fusion proteins to the microtubule lattice, leading to the speckled appearance of such labeled microtubules. As reported previously, GFP-TUA6 is indistinguishably assembly competent, with unlabeled tubulin dimers incorporating the native TUA6 (Shaw et al., 2003) or other α-tubulin isoforms expressed in hypocotyl cells. Based on the normal phenotypes of GFP-TUA6-transformed seedlings and the similar growth/shrinkage rates of GFP-TUA6-labeled microtubules or microtubules labeled by microinjection of Tradescantia spp. stamen hair cells with fluorophore-conjugated brain tubulin (Zhang et al., 1990), it was concluded that the GFP-TUA6 marker does not affect microtubule dynamics and function (Shaw et al., 2003).
The speckled decoration of intracellular filamentous polymeric structures, such as actin filaments or microtubules, was first reported when such structures were allowed to assemble in the presence of very low levels (e.g. 0.01%–0.25% of labeled molecules with respect to the total pool) of fluorescently labeled monomers diluted in a pool of unmodified monomers (Salmon and Waterman, 2011). The stochastic incorporation of either labeled or unlabeled tubulin dimers in microtubule tips led to the development of fluorescence speckled microscopy, with significant implications for the in vivo elucidation of microtubule dynamics (Vallotton et al., 2003). Among others, it provided a tool to discriminate treadmilling-based and motor-driven microtubule translocation (Waterman-Storer and Salmon, 1997; Salmon and Waterman, 2011).
In Arabidopsis hypocotyl cells labeled with the GFP-TUA6 microtubule marker, cortical microtubules were discontinuously labeled, leading to their speckled appearance. Visual inspection as well as quantitative fluorescence intensity profiling showed the alternation of bright fluorescent islands and dark areas, separated at variable distances. Since such labeled microtubules exhibited well-resolved organization patterns and end-wise dynamics, it can be assumed that the discontinuous microtubule labeling by GFP-TUA6 is due to the stochastic incorporation of GFP-TUA6-containing tubulin dimers and nonlabeled dimers at the microtubule ends.
Structure of Cortical Microtubule Bundles and Other Subdiffraction Details of the Cortical Microtubule Array
Microtubule bundle formation in interphase cortical arrays is mediated redundantly by members of the MAP65 family, including MAP65-1 and MAP65-2 (Lucas and Shaw, 2012) and possibly MAP65-5 (Van Damme et al., 2004). Interestingly, MAP65-1 and MAP65-2 (along with the cytokinesis-specific MAP65-3) were identified previously as targets for mitogen-activated protein kinase phosphorylation (Sasabe et al., 2011), which serves as a negative regulator of MAP65 affinity for the microtubule surface (Smertenko et al., 2006). Importantly, MAP65-1 levels are significantly up-regulated in the mpk4 mutant, while the levels of phosphorylated MAP65-1 are considerably lower compared with the wild type (Beck et al., 2010). Theoretically, the above observations may explain the mechanism underlying extensive cortical microtubule bundling in the mpk4 mutant.
The arrangement of individual microtubules within microtubule bundles was visually and quantitatively very clearly discriminated, suggesting that high-performance SIM may be used for mapping the associations of MAPs with microtubules and perhaps resolve intricate microtubular superstructures such as the preprophase microtubule band.
Moreover, in comparison with WF and CLSM, SIM provided subdiffraction details of cortical microtubule organization not resolvable with the other techniques. With high-performance SIM, it was possible to capture the onset of branched microtubule formation and release. The γ-tubulin-mediated branch initiation (Chan et al., 2009; Nakamura and Hashimoto, 2009; Nakamura et al., 2010) and the katanin-mediated branch release (Nakamura et al., 2010) are key mechanisms supplementing the cortical array with nascent microtubules; thus, SIM may provide a subdiffraction tool that will allow the spatiotemporal resolution of this successive nucleation and severing mechanism.
Subdiffraction Microtubule Dynamics
Time-lapse imaging by SIM was traded off for speed; thus, the resolution of individual microtubules was slightly inferior to high-quality SIM acquisitions (135 and 133 nm for GFP-MBD and GFP-TUA6, respectively) but still significantly outperformed all other imaging approaches (WF, CLSM, TIRFM, and SD). Unfortunately, the literature on dynamic plant cell studies is largely devoid of resolution data of the above imaging platforms. Thus, there is no comparison measure other than the data included here. However, the FWHM values for WF, CLSM, TIRFM, and SD are comparable to the resolutions reported elsewhere (Zucker and Price, 1999; Wang et al., 2005; Salmon and Waterman, 2011), which optimally range within 250 to 270 nm. If this is also true for studies published previously in plants, then the difference between SIM and any other microscopic technique is approximately 120 nm, corresponding to roughly 195 tubulin subunits ([120 nm × 13 protofilaments]/8-nm tubulin dimer size) in terms of microtubule length.
Microtubule dynamics at the faster plus end or the slower minus end evolve with the linear addition or removal of tubulin dimers (Desai and Mitchison, 1997). Since the addition of tubulin dimers during growth and the removal during shrinkage are roughly linear functions of time, the respective rates are not expected to be influenced by the resolution of the microscopy platform used. Indeed, this was the case of SIM time-lapse recordings of microtubule growth and shrinkage rates, which were within previously published ranges for both molecular markers, GFP-MBD (Van Damme et al., 2004; Vos et al., 2004) and GFP-TUA6 (Dhonukshe and Gadella 2003; Shaw et al., 2003). Similarly, the elongation and shrinkage rates measured for intrabundle microtubules did not differ significantly from those published previously (Shaw and Lucas, 2011).
However, SIM imaging revealed that at the standard time interval used here (2.6 s), there were short-length transitions resulting in microtubule length changes of approximately 200 nm, which were smaller than the resolutions of WF, CLSM, TIRFM, and SD. Such short-length transitions were more frequently observed in intrabundle than in independent microtubules, and their occurrence contributed to the higher catastrophe and rescue frequencies that were calculated for intrabundle microtubules.
In line with the speckled appearance of GFP-TUA6-labeled microtubules in SIM, the kymographic analyses of such labeled microtubules showed alternating bright and dark vertical stripes, which remained throughout the entire course of observations. If minor or major translocations of the entire microtubule, as frequently observed in plants (Shaw et al., 2003; this study), were owing to motor-driven gliding, then the stripes appearing in kymographs would be inclined, since the stably incorporated GFP-TUA6 speckles would translocate together with the entire microtubule. Since the stripes in SIM kymographs remain vertical (i.e. the GFP-TUA6 speckles remain immotile through time), it can be deduced that such translocations are due to the hybrid treadmilling mechanism described before (Shaw et al., 2003). This mechanism was proven by generating a marker on the wall of growing GFP-TUA6-labeled microtubules by means of photobleaching, creating a dark spot, which was translated as a dark stripe on the respective kymograph (Shaw et al., 2003). The photobleaching approach can be applied to a single microtubule or a few microtubules at a time; thus, it is time demanding to generate the amount of data necessary for quantitative evaluation. On the contrary, application of fluorescence speckle microscopy by means of SIM allows the simultaneous recordings of large populations of microtubules at once because it is a wide-field method (Gustafsson, 2000).
Microtubule Dynamics in the mpk4 Mutant
In the mpk4 mutant, it was found that growth and shrinkage rates were reduced for both extrabundle and intrabundle microtubule dynamics. Since these rate reductions occurred in both microtubule classes, it is likely that overabundant but underphosphorylated MAP65-1 in the mpk4 mutant (Beck et al., 2010) is not related to end-wise microtubule dynamics. This is somewhat expected, since at least MAP65-1 does not bind to soluble tubulin dimers (Smertenko et al., 2004) while using in vitro assays, so the addition of MAP65-1 is not affecting growth and shrinkage rates (Stoppin-Mellet et al., 2013). Quite contradictory results were obtained from in vivo microtubule dynamic measurements in tobacco (Nicotiana tabacum) BY-2 suspension culture cells stably transformed with the proCaMV35S::GFP-AtMAP65-1 construct, showing a marginal increase of growth rates compared with cells transformed with proCaMV35S::GFP-MBD (probably insignificant; see Table I in Van Damme et al., 2004) but a rather steep reduction of depolymerization rates (nearly 50%; see Table I in Van Damme et al., 2004).
Considering (1) the inability of MAP65-1 to bind to tubulin dimers and affect their incorporation to microtubule ends (Smertenko et al., 2004, 2008), (2) the similar polymerization/depolymerization rates measured for extrabundle and intrabundle microtubules (Shaw and Lucas, 2011; this study), and (3) the similar reduction of intrabundle and extrabundle microtubule dynamic rates in the mpk4 mutant, it is probable that the overall down-regulation of growth and shrinkage rates observed in the mpk4 mutant is due to a MAP65-1-independent mechanism.
In the mpk4 mutant, the transition frequencies were also decreased, leading to less frequent catastrophes and rescues. However, catastrophe and rescue frequencies were similarly reduced for both free and intrabundle microtubules. In vitro experiments showed that MAP65-1 caused decreased catastrophe frequency and amplitude and increased rescue frequency and amplitude (Stoppin-Mellet et al., 2013). These in vitro frequencies are again contradictory to in vivo observations (Van Damme et al., 2004) showing that, in tobacco BY-2 cells heterologously overexpressing the AtMAP65-1-GFP fusion protein, catastrophe frequency is comparable to that of GFP-MBD-labeled microtubules but rescue frequency is nearly one-half of the respective frequency of the GFP-MBD-labeled microtubules.
In this context, the down-regulation of both catastrophe and rescue frequencies in the mpk4 mutant, in combination with the down-regulation of polymerization/depolymerization rates, indicate more complex mechanisms of microtubule regulation in the mpk4 mutant than the simple straightforward involvement of MAP65-1. Elucidation of this mechanism is beyond the scope of this work and deserves further attention. Nevertheless, it was already predicted (Šamajová et al., 2013) that other cytoskeletal proteins involved in microtubule organization and dynamics may be targeted and regulated by mitogen-activated protein kinase-dependent phosphorylation.
CONCLUSION AND PERSPECTIVE
Successful applications in live cell biology studies lag behind current advancements of superresolution microscopy, owing to the physical burdens imposed by the size and contour of plant cells as well as by the optical properties of cell walls. Here, one promising superresolution technique, SIM, is quantitatively assessed and shows the potential to follow the spatiotemporal evolution of cortical microtubules.
Our findings here indicate the potential of SIM to unravel subdiffraction details of plant cortical microtubule organization. Using SIM with high-resolution optics and imaging setup, individual microtubules were resolved well below Abbe’s limit. It was possible to describe the complexity of microtubule bundle structure and characterize extrabundle and intrabundle microtubule dynamics with length fluctuations below the limits of other techniques, such as WF, CLSM, TIRFM, and SD. Live SIM imaging will shed new light on the interactions of microtubules with MAPs that induce bundling and bias the parallel arrangement of cortical arrays (Tulin et al., 2012; Stoppin-Mellet et al., 2013) but also will track microtubule nucleation processes in plant acentrosomal cells (Binarová et al., 2006; Nakamura et al., 2010; Kirik et al., 2012; Stoppin-Mellet et al., 2013). Finally, the resolution of dynamic features of microtubule structures, such as the preprophase microtubule band (Müller et al., 2009), the mitotic spindle (Zhang and Dawe, 2011), and the phragmoplast (Smertenko et al., 2011), could be the challenging task for future live SIM imaging in the plant field.
MATERIALS AND METHODS
Plant Material and Sample Preparation for Microscopy
Seedlings of Arabidopsis (Arabidopsis thaliana) ecotype Columbia carrying either the GFP-MBD or GFP-TUA6 construct as well as the mpk4 mutant (in the Columbia background) carrying the GFP-MBD construct were used. Plants were stably transformed by the floral dipping method (Clough and Bent, 1998) with either a cauliflower mosaic virus 35S promoter-driven GFP fusion of the microtubule-binding domain of mammalian MAP4 (proCaMV35S::GFP-MBD; Marc et al., 1998) or with a similarly expressed fusion of GFP with the TUA6 α-tubulin isoform (proCaMV35S::GFP-TUA6) provided by Dr. Sidney Shaw. Seeds were surface sterilized and placed on one-half-strength MS culture medium (pH 5.7) without vitamins containing 1% (w/v) Suc and 0.4% (w/v) phytagel. The plates were stored at 4°C for 48 h to break dormancy and then kept vertically under 22°C in darkness for 5 d. Seedlings expressing fusion constructs visualizing microtubules were transferred to microscope slides that had been modified into thin chambers using high-precision and low-thickness-tolerance Nexterion round coverslips (Schott CR; coverslip thickness (D) = 0.17 ± 0.003 mm, diameter = 25 mm for objective Plan-Apochromat 100×, NA 1.57 oil, differential interference contrast corrected (DIC corr), 000000-1787-996, very dense flint N-SSK2, refractive index = 1.62229, Abbe numbers Vd = 53.27, Ve = 52.99, reflectance at 0.5876 µm, R = 0.05632). The chambers were filled with liquid one-half-strength MS medium using either one layer of Parafilm as a spacer or without this spacer. Microchambers with seedlings were sealed with silicone paste to prevent the evaporation of liquid medium and stabilize samples during microscopy examinations.
Microscopy Setup, Optics, and Image Acquisition
For WF, SIM, CLSM, and TIRFM, all samples were examined with a Zeiss Axioimager Z.1 platform equipped with the Elyra PS.1 superresolution system for SIM and the LSM780 module for CLSM using Zeiss objectives Alpha Plan Apochromat 63×, NA 1.40 oil objective (total magnification, 1,008×) and Alpha Plan Apochromat 100×, NA 1.57 oil objective (total magnification, 1,600×) with appropriate oils (Immersol 518F with refractive index of 1.518 for the 63×, NA 1.40 objective and Immersol HI with refractive index of 1.66 for the 100×, NA 1.57 objective). In a few cases, longer imaging was done on a Zeiss LSM710 platform with a 63×, NA 1.40 objective. The light source for SR SIM and WF included diode laser 488-100 (488 nm). Images were captured with an electron-multiplying (EM)-CCD camera (Andor iXON EM+; 1004x1002 px, cooled at −64°C, 16 bit) at typical exposure times varying between 80 and 200 ms and with gain values between 20 and 25. The high-performance SR SIM setup included five rotations and five phases of the grated pattern for each image layer. Gratings for patterned illumination were spaced by 42 µm for the 100×, NA 1.57 oil-immersion objective. Up to seven (usually three) Z-stacks were acquired per image with a slice thickness of 110 nm for the 100×, NA 1.57 objectives. The light source for CLSM included an argon-neon laser (458, 488, and 514 nm). Images were captured using the GaAsP spectral detector, with scanning speed 4, line averaging 4, and pinhole of 1 airy unit. CLSM was set to meet the SR SIM magnification (1,008× and 1,600× depending on the objective) in the optimum pixel resolution (according to Nyquist sampling criteria).
For time-lapse imaging with SIM, the Alpha Plan Apochromat 100×, NA 1.57 oil objective was used exclusively, and images were acquired from a single optical section. Grid rotations were reduced from five to three, and the exposure time of the EM-CCD was reduced to minimum. In this way, the time interval was 2.6 s, and this value was used as a standard for WF (acquired simultaneously with SIM), CLSM, SD, and TIRFM in order to ensure similar temporal resolution employing the same objective.
SIM, WF, CLSM, and TIRFM platforms are integrated in the Zeiss Elyra PS.1 system used here; therefore, it was possible to acquire sequential time-lapse series from exactly the same cell with the aforementioned microscopies. SD was conducted using an independent microscopy platform equipped with the Zeiss Axio Observer inverted microscope combined with a Yokogawa CSU-X1 scanning head. The same Alpha Plan Apochromat 100×, NA 1.57 oil objective, coverslips, and immersion oil (Nexterion high-precision coverslips and high-refractive-index Immersol HI as used for the acquisition of SIM images) were used for bioimaging with this system. Images were acquired with the high-resolution Evolve 512 black-thinned EM-CCD camera (Photometrics).
Image Processing and Quantitative Analysis
Raw CLSM, WF, and SR SIM images were acquired with Zeiss Zen 11 software (Zen Blue version; Carl Zeiss Microscopy). Measurements involving intensity profiles of individual microtubules or microtubule bundles were directly conducted in Zen 11. For multiple measurements, the original line selected for intensity profiling was cloned with the appropriate Zen 11 tool to different positions of the same or other individual or bundled microtubules in the image. To alleviate differences in absolute intensity values between WF, SIM, and CLSM images, raw values were exported to Microsoft Excel, normalized to a range between 0 and 1, and plotted against distance. Scatterplots of normalized intensity values versus distance were used to measure FWHM with ImageJ.
To quantitatively address bundle structure by means of maximum absolute fluorescence intensity, line profiles were drawn perpendicular to cortical microtubule bundles acquired by SIM (as depicted in Fig. 2, A, D, and G), based on visual inspection of the actual individual microtubules converging to such bundles, to avoid user bias on placing profiles based on intensity values. The respective profiles were then copied exactly to the corresponding WF image and the sequentially acquired CLSM image (approximately 2 min after the simultaneous acquisition of the SIM/WF image). This was done because absolute fluorescence intensities of individual microtubules visualized by WF and CLSM showed broad variability; thus, absolute fluorescence intensity could not serve as a predictor to decide the placement of the profile so as to correspond to the microtubule number independently for WF and CLSM.
Kymographs of dynamic microtubules were generated by three alternative ways: by using the time profile tool of the Zen 2011 blue version, or in ImageJ on line selections of time stacks resliced subsequently, or by using the MultipleKymograph plugin for ImageJ (http://www.embl.de/eamnet/html/body_kymograph.html) developed by J. Rietdorf and A. Seitz (European Molecular Biology Laboratory). Quantitative analysis of kymographs was done again in ImageJ using the Kymoquant plugin (http://cmci.embl.de/downloads/kymoquant) written by Koto Miura (European Molecular Biology Laboratory).
Catastrophe and rescue frequencies were calculated according to previously published work (Dhonukshe and Gadella, 2003). Briefly, the total number of events (summed from as many individual microtubules as reported in the text) was divided by the total amount of time required for such events. In this way, cumulative catastrophe and rescue frequencies are calculated, and they are devoid of sd.
For resolution studies via fluorescence intensity profiles and microtubule dynamic parameters, measurements were carried out on the designated microtubule numbers (reported in both the text and the figure legends) from 64 hypocotyl epidermal cells from 26 different etiolated seedlings (for SIM/WF/CLSM/TIRFM/SD acquisition of GFP-MBD-labeled microtubules), from 50 hypocotyl epidermal cells from 26 etiolated seedlings (for SIM/WF/CLSM/TIRFM/SD acquisition of GFP-TUA6-labeled microtubules), and from 21 hypocotyl epidermal cells from 12 etiolated mpk4 seedlings (for SIM/WF/CLSM/TIRFM/SD acquisition of GFP-MBD-labeled microtubules).
Statistical Analysis
An unpaired, two-tailed Student’s t test assuming unequal variance was applied to determine statistical significance, particularly between different dynamic values of microtubules from the different experimental conditions described. Data (mean values, sd, sample number, and summary of P values from pairwise Student’s t tests) are shown and explained in Supplemental Tables S1 and S2 for individual, unbundled microtubules and in Supplemental Tables S3 and S4 for intrabundle microtubules. All descriptive data in the text and figures are given as means ± sd.
Sequence data from this article can be found in the GenBank/EMBL data libraries under accession numbers TUA6, AT4G14960; MPK4, AT4G01370.
Supplemental Data
The following materials are available in the online version of this article.
Supplemental Figure S1. Full view of the unprocessed images used in Figure 1.
Supplemental Figure S2. The discontinuous incorporation of the GFP-TUA6 marker in the microtubule lattice of hypocotyl epidermal cells of Arabidopsis transformed with the proCaMV35S::GFP-TUA6 construct.
Supplemental Figure S3. Full view of a hypocotyl epidermal cell expressing the GFP-MBD marker, showing SIM performance using the 63×, NA 1.40 oil-immersion objective.
Supplemental Figure S4. Full view of the image used in Figure 2.
Supplemental Figure S5. Full view of the images used in Figure 3.
Supplemental Figure S6. Full view of the images used for the kymographs in Figure 5, D and H.
Supplemental Figure S7. Longitudinal line profiles of absolute fluorescence intensity along the bundle shown in Figure 7B, corresponding to selected time frames from a hypocotyl epidermal cell of the mpk4 mutant expressing the GFP-MBD microtubule marker.
Supplemental Table S1. Summary of extrabundle microtubule dynamics in the wild type expressing GFP-MBD or GFP-TUA6 markers and the mpk4 mutant expressing the GFP-MBD marker.
Supplemental Table S2. Pairwise Student’s t test comparing growth and shrinkage rates from Supplemental Table S1.
Supplemental Table S3. Summary of intrabundle microtubule dynamics in the wild type expressing GFP-MBD or GFP-TUA6 markers and the mpk4 mutant expressing the GFP-MBD marker.
Supplemental Table S4. Pairwise Student’s t test comparing growth and shrinkage rates from Supplemental Table S3.
Supplemental Video S1. Video of an epidermal hypocotyl cell transformed with GFP-MBD, corresponding to Figure 5D and Supplemental Figure S2, A and B.
Supplemental Video S2. Video of an epidermal hypocotyl cell expressing the GFP-TUA6 marker, corresponding to Figure 5, E to G.
Supplemental Video S3. Video of an epidermal hypocotyl cell of the mpk4 mutant expressing the GFP-MBD marker, corresponding to Figures 7, A to G, and 8, A to E.
ACKNOWLEDGMENTS
We thank Dr. Tomá¡ Takáč (Palacky University, Olomouc, Czech Republic) for useful suggestions, Dr. Klaus Weisshart (Carl Zeiss Microscopy, Jena, Germany) for validating our raw data, and Dr. Sidney Shaw (Indiana University, Bloomington, IN) for seeds with the GFP-TUA6 construct.
Glossary
- TIRFM
total internal reflection microscopy
- VAEM
variable-angle emission microscopy
- CLSM
confocal laser scanning microscopy
- SD
spinning-disc microscopy
- TIRF
total internal reflection
- MAP
microtubule-associated protein
- STED
stimulated emission depletion
- SIM
structured illumination microscopy
- STORM
stochastic optical reconstruction microscopy
- PALM
photoactivation localization microscopy
- NA
numerical aperture
- MS
Murashige and Skoog
- FWHM
full width at one-half maximum
LITERATURE CITED
Author notes
This work was supported by the Czech Science Foundation GAČR (grant no. P501/11/1764), by the Centre of the Region Haná for Biotechnological and Agricultural Research (grant no. LO1204 NPU I), and by European Community project Biomedreg (CZ.1.05/2.1.00/01.0030).
Address correspondence to jozef.samaj@upol.cz.
The author responsible for distribution of materials integral to the findings presented in this article in accordance with the policy described in the Instructions for Authors (www.plantphysiol.org) is: Jozef Šamaj (jozef.samaj@upol.cz).
The online version of this article contains Web-only data.
