


Abstract
Online publishing, social networks, and web search have dramatically lowered the costs of producing, distributing, and discovering news articles. Some scholars argue that such technological changes increase exposure to diverse perspectives, while others worry that they increase ideological segregation. We address the issue by examining web-browsing histories for 50,000 US-located users who regularly read online news. We find that social networks and search engines are associated with an increase in the mean ideological distance between individuals. However, somewhat counterintuitively, these same channels also are associated with an increase in an individual’s exposure to material from his or her less preferred side of the political spectrum. Finally, the vast majority of online news consumption is accounted for by individuals simply visiting the home pages of their favorite, typically mainstream, news outlets, tempering the consequences—both positive and negative—of recent technological changes. We thus uncover evidence for both sides of the debate, while also finding that the magnitude of the effects is relatively modest.
The Internet has dramatically reduced the cost of producing, distributing, and accessing diverse political information and perspectives. Online publishing, for example, circumvents much of the costly equipment required to produce physical newspapers and magazines. With the rise of social media sites such as Facebook and Twitter, individuals can now readily share their favorite stories with hundreds of their contacts (Bakshy et al. 2012; Goel, Watts, and Goldstein 2012). Moreover, search engines facilitate a diversity of voices by offering access to a range of opinions far broader than those found in one’s local paper, greatly expanding the information available to citizens and their choices over news outlets.
What is the effect of such technological changes on ideological segregation? On one hand, with more options, individuals may choose to consume only content that accords with their previously held beliefs. Commentators such as Sunstein (2009) have thus predicted the rise of “echo chambers,” in which individuals are largely exposed to conforming opinions. Indeed, in controlled experiments, subjects tend to choose news articles from outlets aligned with their political opinions (Garrett 2009; Iyengar and Hahn 2009; Munson and Resnick 2010). Additionally, search engines, news aggregators, and social networks are increasingly personalizing content through machine-learning models (Agichtein, Brill, and Dumais 2006; Das et al. 2007; Hannak et al. 2013), potentially creating “filter bubbles” (Pariser 2011) in which algorithms inadvertently amplify ideological segregation by automatically recommending content an individual is likely to agree with. Moreover, individuals are more likely to share information that conforms to opinions in their local social neighborhoods (Moscovici and Zavalloni 1969; Myers and Bishop 1970; Spears, Lea, and Lee 1990; Schkade, Sunstein, and Hastie 2007). If realized, such information segregation is a serious concern, as it has long been thought that functioning democracies depend critically on voters who are exposed to and understand a variety of political views (Downs 1957; Baron 1994; Lassen 2005).
On the other hand, Benkler (2006) and others have argued that increased choice and social networks lead to greater exposure to diverse ideas, breaking individuals free from insular consumption patterns (Obendorf et al. 2007; Goel, Hofman, and Sirer 2012). Providing evidence for this view, Messing and Westwood (2012) show that social endorsements increase exposure to heterogeneous perspectives. Relatedly, Goel, Mason, and Watts (2010) show that a substantial fraction of ties in online social networks are between individuals on opposite sides of the political spectrum, opening up the possibility for diverse content discovery. Moreover, in the context of music consumption, Hosanagar et al. (2013) find that personalized recommendation systems increase within-user diversity. Taken together, these results suggest that technologies like web search and social networks reduce ideological segregation.
In short, there are compelling arguments on both sides of the debate. We investigate the issue by empirically examining the web-browsing patterns of 50,000 anonymized US-located Internet users who regularly read online news. Our focus on this group of active news readers stems from reasons both substantive and methodological. Such individuals tend to be more politically active, and also have the greatest preferences for partisan media (Iyengar and Hahn 2009). As a result, the effects of technological change on ideological segregation are arguably larger and more consequential for this group. Further, as described in more detail below, it is exceedingly difficult to infer individual-level estimates without repeated observations for each individual. We thus limit our analysis—and accordingly our conclusions— to active online news readers.1
For this sample of active news readers, our data set contains their detailed web-browsing activity organized as a time series by user. We apply machine-learning algorithms to article text to identify hard news. We then further algorithmically separate out descriptive reporting from opinion pieces, and use an audience-based approach to estimate an outlet’s conservative share: the fraction of its readership that supported the Republican candidate in the most recent presidential election. Following past work, we then define (population-level) ideological segregation as the expected difference in the conservative shares of news outlets visited by two randomly selected individuals. We find that segregation is slightly higher for descriptive news accessed via social media than for articles read by directly visiting a news outlet’s home page. For opinion pieces, however, the effect is more substantial.
The overall level of segregation we observe could be the result of two qualitatively different individual-level behaviors. A typical individual might regularly read a variety of liberal and conservative news outlets but still have a left- or right-leaning preference. Alternatively, individuals may choose to read only publications that are ideologically similar to one another, rarely reading opposing perspectives. We find strong evidence for the latter pattern. Specifically, users who predominately visit left-leaning news outlets only very rarely read substantive news articles from conservative sites, and vice versa for right-leaning readers, an effect that is even more pronounced for opinion articles. Interestingly, exposure to opposing perspectives is higher for the channels associated with the highest segregation, search, and social. Thus, counterintuitively, we find evidence that recent technological changes both increase and decrease various aspects of the partisan divide.
Finally, we note that directly accessed, descriptive reporting comprises 75 percent of traffic, driven primarily by mainstream news outlets. This result helps explain why segregation in online and offline news consumption has been found to be comparable (Gentzkow and Shapiro 2011), despite theoretical predictions to the contrary. Namely, even though we do see measurable effects of recent technological change on ideological segregation, we also find that most online news consumption is still driven by individuals directly visiting the websites of mainstream news organizations. Social networks and web search, it appears, have not transformed news consumption to the degree many have hoped or feared. Indeed, we find that only about 1 in 300 outbound clicks from Facebook correspond to substantive news, with video- and photo-sharing sites far-and-away the most popular destinations. Nevertheless, we find that for opinion stories—which account for 6 percent of hard-news consumption—about one-third come through social or search. So, if opinion content has an outsized importance on citizens’ political views, these channels may still be substantively important. Moreover, the next generation of Internet users may increasingly rely on social media to obtain news and opinion, with corresponding implications for ideological segregation.
Data and Methods
Our primary analysis is based on web-browsing records collected via the Bing Toolbar, a popular add-on application for the Internet Explorer web browser. Upon installing the toolbar, users can consent to sharing their data via an opt-in agreement, and to protect privacy, all records are anonymized prior to our analysis. Each toolbar installation is assigned a unique identifier, giving the data a panel structure. We start by analyzing the web-browsing behavior of 1.2 million US-located users for the three-month period between March and May 2013, and eventually focus on 50,000 users who actively read the news, as described below. For each user, we have a time-stamped collection of URLs opened in the browser, along with the user’s geographic location, as inferred via the IP address. In total, our data set consists of 2.3 billion distinct page views, with a median of 991 page views per individual.2
As with nearly all observational studies of individual-level web-browsing behavior, our study is restricted to individuals who voluntarily share their data, which likely creates selection issues. These users, for example, are presumably less likely to be concerned about privacy. Moreover, it is generally believed that Internet Explorer users are on average older than the Internet population at large. Nevertheless, we follow previous authors in treating data from the Bing Toolbar as representative of web-user behavior more broadly (Teevan, Ramage, and Morris 2011; Athey and Mobius 2012), while acknowledging the challenge of establishing the representativeness of this sample. As one measure of representativeness, we compared the top twenty-five sites in our data set—ordered by the number of unique monthly US visitors in February 2013—to lists by Quantcast and Alexa, the two most prominent publicly available website rankings. The Spearman correlation is 0.67 and 0.7, respectively. As a point of comparison, we note that the Alexa and Quantcast rankings have a correlation of 0.64.3 We thus conclude that the aggregate browsing patterns of our sample do appear to be largely in line with samples used to produce industry-standard website rankings. Note, however, that some of the shortcomings of our data set (e.g., underrepresentation of corporate networks) are also shared by commercially available data sets (Athey and Mobius 2012).
IDENTIFYING NEWS AND OPINION ARTICLES
We select an initial universe of news outlets (i.e., web domains) via the Open Directory Project (ODP, dmoz.org), a collective of tens of thousands of editors who hand-label websites into a classification hierarchy. This gives 7,923 distinct domains labeled as news, politics/news, politics/media, and regional/news. Since the vast majority of these news sites receive relatively little traffic, to simplify our analysis we restrict ourselves to the 100 domains that attracted the largest number of unique visitors from our sample of toolbar users.4 This list of popular news sites includes every major national news source, well-known blogs, and many regional dailies, and collectively accounts for over 98 percent of page views of news sites in the full ODP list (as estimated via our toolbar sample). The complete list of 100 domains is given in the online appendix. The bulk of the 4.1 million articles we consider do not fall into categories where political leaning has a meaningful interpretation, but rather relate to sports, weather, lifestyle, entertainment, and other largely apolitical topics.
We filter out these apolitical stories by training a binary classifier on the article text. The classifier identified 1.9 million stories (46 percent) as “front-section” news. Next, starting from this set of 1.9 million front-section news stories, we separate out descriptive news from opinion via a second classifier; 200,000 (11 percent) are ultimately found to be opinion stories. Table 1 lists words with the highest positive and negative weights for both classifers—the words accord with common intuition. Details of the article classification, including performance benchmarks, are in the online appendix.
Most Predictive Words for Classifying Articles as Either News or Non-News, and Separately, for Separating Out Descriptive News from Opinion
| Front-section news & opinion (+) vs. “non-news” (−) | |
|---|---|
| Positive | Negative |
| contributed, democratic, economy, authorities, leadership, read, Republican, Democrats, country’s, administration | film, today, pretty, probably personal, learn, technology, mind posted, isn’t |
| Opinion (+) vs. descriptive news (−) | |
| Positive | Negative |
| stay, seem, important, seems isn’t, fact, actually, reason latest, simply | contributed, reporting, said, say spokesman, experts interview, expected added, hers |
MEASURING THE POLITICAL SLANT OF PUBLISHERS
In the absence of human ratings, there are no existing methods to reliably assess article slant with both high recall and precision.5 Since our sample has over 1.9 million articles classified as either front-section news or opinion, human labeling is not feasible. We thus follow the literature (Groseclose and Milyo 2005; Gentzkow and Shapiro 2010, 2011) and focus on the slant at the outlet level, ultimately assigning articles the polarity score of the outlet in which they were published. By doing so, we clearly lose some signal. For instance, we mislabel liberal op-eds on generally conservative news sites, and we mark neutral reporting of a breaking event as having the overall slant of the outlet. Nevertheless, such a compromise is common practice, and where possible, we attempt to mitigate any resulting biases.
Unfortunately, estimates from past work (Groseclose and Milyo 2005; Gentzkow and Shapiro 2010) cover less than half of the 100 outlets used in our main analysis. Our solution is to construct an audience-based measure of outlet slant (Tewksbury 2005; Lawrence, Sides, and Farrell 2010; Gentzkow and Shapiro 2011). Specifically, we estimate the fraction of each news outlet’s readership that voted for the Republican candidate in the most recent presidential election, which we call the outlet’s conservative share. Thus, left-leaning, or “liberal,” outlets have conservative shares less than about 50 percent, and right-leaning, or “conservative,” outlets have conservative shares greater than about 50 percent. To estimate the political composition of a news outlet’s readership, we use the location of each webpage view as inferred from the IP address. We can then measure how the popularity of a news outlet varies across counties as a function of the counties’ political compositions, which in turn yields the estimates we desire. We detail our approach in the online appendix.
Table 2 lists estimated conservative shares for the twenty news outlets attracting the most number of unique visitors in our data set, ranging from the BBC and the New York Times on the left, to Fox News and Newsmax on the right. While our measure of conservative share is admittedly imperfect, the list does seem largely consistent with commonly held beliefs on the slant of particular outlets.6 Furthermore, as shown in figure 1, our ranking of news sites is highly correlated with the survey-based measure of audience ideology derived from a Pew (2014) study.7 Among the seventeen news sources on both lists, the correlation was 0.81. We similarly find a correlation of 0.82 among the top twenty domains in the Gentzkow and Shapiro (2011) list based on 2008 audience data, and 0.77 correlation among the top twenty domains in the Bakshy, Messing, and Adamic (2015) list based on Facebook data. In the online appendix, we give the conservative shares for our full list of 100 domains.
For the Twenty Most Popular News Outlets, Each Outlet’s Estimated Conservative Share (i.e., the two-party fraction of its readership that voted for the Republican candidate in the last presidential election)
| Publication | Cons. share | Publication | Cons. share |
|---|---|---|---|
| BBC | 0.30 | LA Times | 0.46 |
| New York Times | 0.31 | Yahoo News | 0.47 |
| Huffington Post | 0.35 | USA Today | 0.47 |
| Washington Post | 0.37 | Daily Mail | 0.47 |
| Wall Street Journal | 0.39 | CNBC | 0.47 |
| US News & World Report | 0.39 | Christian Sci. Monitor | 0.47 |
| TIME Magazine | 0.40 | ABC News | 0.48 |
| Reuters | 0.41 | NBC News | 0.50 |
| CNN | 0.42 | Fox News | 0.59 |
| CBS News | 0.45 | Newsmax | 0.61 |
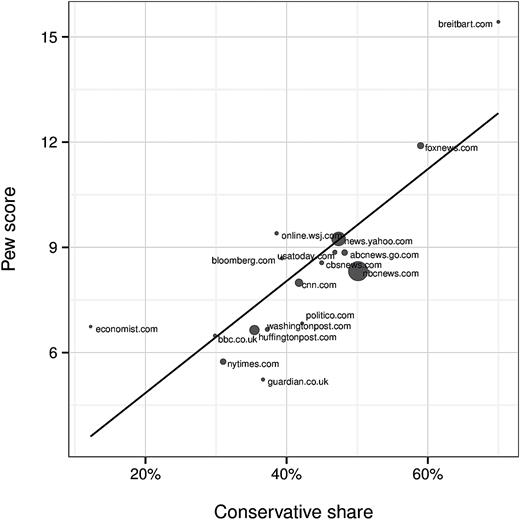
Comparison of Our Measure to a Pew Survey-Based Measure. A comparison of our estimate of conservative share of an outlet’s audience to a Pew survey-based measure of audience ideology, where point sizes are proportional to popularity. For the seventeen outlets for which both measures are available, the correlation between the two scores is 0.81.
INFERRING CONSUMPTION CHANNELS
We define four channels through which an individual can discover a news story: direct, aggregator, social, and search. Direct discovery means a user directly and independently visits a top-level news domain such as nytimes.com (e.g., by typing the URL into the browser’s address bar, accessing it through a bookmark, or performing a “navigational search,” explained below), and then proceeds to read articles within that outlet. The aggregator channel refers to referrals from Google News —one of the last remaining popular news aggregators—which presents users with links to stories hosted on other news sites. We define the social channel to include referrals from Facebook, Twitter, and various web-based e-mail services. Finally, the search category refers to news stories accessed as the result of web-search queries on Google, Bing, and Yahoo. The time series of webpage views for an individual is not sufficient to perfectly determine the discovery channel of a news article. We get around this problem with a “short” versus “long” URL distinction in the following simple heuristic: define the “referrer” of a news article to be the most recently viewed URL that is a top-level domain, such as nytimes.com or facebook.com (short URL), but not a specific story link, such as nytimes.com/a-news-story (long URL). We then use the referrer to classify the discovery channel. For example, if the referrer is a news domain, such as foxnews.com, then the channel is “direct navigation,” whereas the channel is “social” if the referrer is, for instance, facebook.com. The intuition behind this method is that a user is very unlikely to directly type in a specific long URL, so the visit must have a referrer, which can be inferred from the time series of URLs. The heuristic thus is based on two key assumptions: first, users do not typically type in the long, unwieldy web addresses assigned to individual articles, but rather are directed there via a previous visit to a top-level domain and a subsequent chain of clicks; and second, top-level domains are not typically shared or posted via e-mail, social media, or aggregators. Even when referring pages can be perfectly inferred, there can still be genuine ambiguity in how to determine the consumption channel. For example, if an individual follows a Facebook link to a New York Times article and then proceeds to read three additional articles at that outlet, are all four articles “social” or just the first? Our solution is to take the middle ground: in this example, any subsequent article-to-article views (e.g., clicks on a “related story”) are classified as “social,” whereas an intermediate visit to the outlet’s front page results in subsequent views being classified as “direct.” Note that this is consistent with the simple procedure described above, since the site’s front page results in a short URL.
LIMITING TO ACTIVE NEWS CONSUMERS
As discussed above, for theoretical and methodological reasons we limit our analysis to individuals who regularly read online news. Specifically, our primary analysis is based on the subset of users who have read at least ten substantive news articles and at least two opinion pieces in the three-month time frame we consider. This first requirement reduces our initial sample of 1.2 million individuals to 173,450 (14 percent of the total); the second requirement further reduces the sample to 50,383 (4 percent of the total). These numbers are generally lower than past estimates, likely because of our focus on substantive news and opinion (which excludes sports, entertainment, and other soft news), and our explicit activity measures (as opposed to self-reports).
It is perhaps surprising that such a small fraction of the population regularly reads online news, particularly opinion articles. While many individuals presumably learn about current events through alternative sources, such as television, radio, or word of mouth, it is likely that many others are simply not politically engaged. Whatever the ultimate cause, the fact that such a small fraction of the population regularly reads online news arguably has considerable impact on both political discourse and media production, though we by and large leave further discussion of these topics to future work.
Finally, we note that though we focus here on this small group of active news consumers, many of our qualitative conclusions remain intact if we instead carry out our analysis on the larger set of users who read at least one substantive news article. For example, among this broader set of individuals, social media and web search are still associated with higher segregation than direct browsing. However, as expected (Iyengar and Hahn 2009), the overall levels of segregation are lower for the broader group than for those who read online news more regularly (see figure A4 in the online appendix).
Results
OVERALL SEGREGATION
Recall that the conservative share of a news outlet—which we also refer to as the outlet’s polarity —is the estimated fraction of the publication’s readership that voted for the Republican candidate in the most recent presidential election. We now define the polarity of an individual to be the typical polarity of the news outlet that he or she visits. We then define segregation to be the expected distance between the polarity scores of two randomly selected users. This definition of segregation, which is in line with past work (Dandekar, Goel, and Lee 2013), intuitively captures the idea that segregated populations are those in which pairs of individuals are, on average, far apart.
Due to sparsity in the data, however, our measure of segregation is not entirely straightforward to estimate. In particular, under a naive inference strategy, noisy estimates of user polarities would inflate the estimate of segregation. We thus estimate segregation via a hierarchical Bayesian model (Gelman and Hill 2007), as described in more detail below. Finally, we note that throughout our analysis we consider the segregation associated with various subsets of consumption (e.g., views of opinion stories on social media sites). Intuitively, such measures correspond to first restricting to the relevant subset of consumption and then computing the segregation effects; in practice, though, we simultaneously estimate the numbers in a single, random-effects model.
We define the polarity score of an article to be the polarity score of the news outlet in which it was published.8 Now, let Xij be the polarity score of the jth article read by user i. We model
where µi is the latent polarity score for user i, and σd is a global dispersion parameter (to be estimated from the data). To mitigate data sparsity, we further assume the latent variables µi are themselves drawn from a normal distribution. That is,
To complete the model specification, we assign weak priors to the hyperparameters σd, µp, and σp. Ideally, we would perform a fully Bayesian analysis to obtain the posterior distribution of the parameters. However, for computational convenience, we use the approximate marginal maximum likelihood estimates obtained from the lmer() function in the R package lme4 (Bates, Maechler, and Bolker 2013).
Though the distributional assumptions we make are standard in the literature (Gelman and Hill 2007), our modeling choices of course affect the estimates we obtain. As a robustness check, we note that a naive, model-free estimation procedure yields qualitatively similar, though ostensibly less precise, results. Moreover, in our analysis of Twitter in the online appendix in section A.1—a setting where sparsity is not an issue— we estimate user polarity scores directly and find that they are indeed approximately normally distributed.
Having specified the model, we can now formally define segregation, which we do in terms of the expected squared distance between individuals’ polarity scores. Namely, we define segregation to be . After simple algebraic manipulation, our measure of segregation further reduces to . Higher values of this measure correspond to higher levels of segregation, with individuals more spread out across the ideological spectrum.
Figure 2 shows the distribution of polarity scores (i.e., the distribution of ) for users in our sample. We find that most individuals are relatively centrist, with two-thirds of people having polarity scores between 0.41 and 0.54. Overall segregation is estimated to be 0.11, which means that for two randomly selected users, the ideological distance between the publications they typically read is on par with that between the centrist NBC News and the left-leaning Daily Kos (or, equivalently, ABC News and Fox News). Thus, though we certainly find a degree of ideological segregation, it would seem to be relatively moderate.
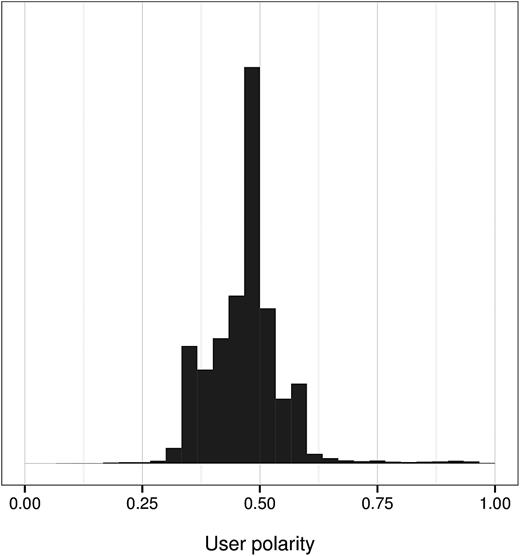
Distribution of Individual-Level Polarity. Each individual’s polarity score is the (model-estimated) average conservative share of the news outlets he or she visits.
SEGREGATION BY CHANNEL AND ARTICLE SUBJECTIVITY
When measuring segregation across various distribution channels and levels of article subjectivity, the data sparsity issues we encountered above are exacerbated. For example, even among active news consumers, relatively few individuals regularly read news articles from both aggregators and social media sites. And when we further segment articles into opinion and descriptive news, it compounds the problem. However, the polarity of consumption for a user across channels should be correlated; for example, the opinion pieces one reads from Facebook are likely ideologically related to the articles one reads from Google News. There is thus an opportunity to improve our estimates by “sharing strength” across channels and subjectivity levels, and accordingly to jointly estimate the segregation parameters of interest. Moreover, joint estimation with weak priors also mitigates channel-selection issues.
The four consumption channels (aggregator, direct, web search, and social media) and two subjectivity classes (descriptive reporting and opinion) give eight subjectivity-by-channel dimensions. Let Xijk denote the polarity of the jth article that user i reads in the kth subjectivity-by-channel category, where we recall that the polarity of an article is defined to be the conservative share of the site on which it was published. Generalizing our hierarchical Bayesian framework, we model
where is the k-th component in the latent eight-dimensional polarity vector for user i, and σd is a global dispersion parameter. As before, we deal with sparsity by further assuming a distribution on the latent variables themselves. In this case, we model each individual’s polarity vector as being drawn from a multivariate normal:
where and Σp are global hyperparameters. The full Bayesian model is analyzed by assigning weak priors to the hyperparameters and computing posterior distributions of the latent variables, but in practice we simply fit the model with marginal maximum likelihood.
As with the analysis in the Overall Segregation section, the diagonal entries of the covariance matrix Σp yield estimates of segregation for each of the eight subjectivity-by-channel categories. In particular, letting denote the k-th diagonal entry of Σp, segregation in the k-th category is . Table 3 lists these diagonal parameter estimates.9 The off-diagonal entries of Σp measure the relationship between categories of one’s ideological exposure. For example, after normalizing Σp to generate the corresponding correlation matrix, we find that the correlation between social media-driven descriptive news and opinion is 0.71. The full correlation matrix is included in the online appendix.
Bayesian Model Estimates of Ideological Consumption by Channel and Subjectivity type (the column µp indicates the corresponding entry of µp, and the column σp indicates the corresponding diagonal entry of the model-estimated covariance matrix Σp)
| Front-section news | Opinion | |||
|---|---|---|---|---|
| Consumption channel | µp | σp | µp | σp |
| Aggregator | 0.44 | 0.051 | 0.44 | 0.092 |
| Direct | 0.47 | 0.076 | 0.47 | 0.094 |
| Social | 0.46 | 0.087 | 0.47 | 0.12 |
| Search | 0.46 | 0.087 | 0.46 | 0.14 |
| Front-section news | Opinion | |||
|---|---|---|---|---|
| Consumption channel | µp | σp | µp | σp |
| Aggregator | 0.44 | 0.051 | 0.44 | 0.092 |
| Direct | 0.47 | 0.076 | 0.47 | 0.094 |
| Social | 0.46 | 0.087 | 0.47 | 0.12 |
| Search | 0.46 | 0.087 | 0.46 | 0.14 |
To help visualize these model estimates, figure 3 plots segregation across the four consumption channels, for both opinion and descriptive news. The size of the markers is proportional to total consumption within the corresponding channel, normalized separately for opinion and descriptive news. To ground the scale of the y-axis, we note that among the top twenty most popular news outlets, conservative share ranges from 0.30 for the liberal BBC to 0.61 for the conservative Newsmax.
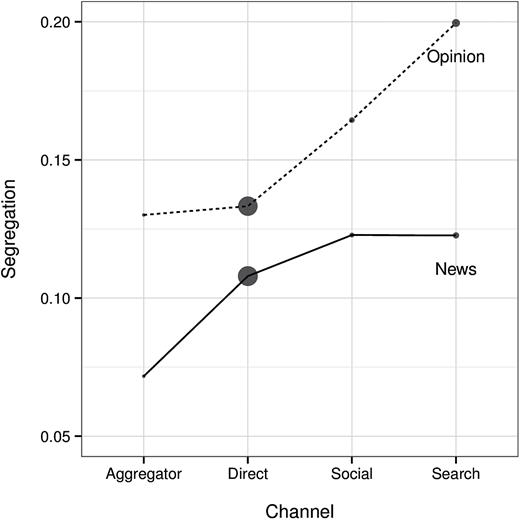
Estimates of Ideological Segregation across Consumption Channels. Point sizes indicate traffic fraction, normalized separately within the news and opinion lines.
Figure 3 indicates that social media is indeed associated with higher segregation than direct browsing. For descriptive news this effect is subtle, with segregation increasing from 0.11 for direct browsing to 0.12 for articles linked from social media. However, for opinion pieces, the effect is more pronounced, rising from 0.13 to 0.17. It is unclear whether this increased segregation is the effect of algorithmic filtering of the news stories appearing in one’s social feed (Pariser 2011), the result of ideological similarity among one’s social contacts (McPherson, Smith-Lovin, and Cook 2001; Goel, Mason, and Watts 2010), due to active selection by individuals of which stories in their feed to read (Garrett 2009; Iyengar and Hahn 2009; Munson and Resnick 2010; Bakshy, Messing, and Adamic 2015), or some combination of all three. In any case, however, our results are directionally consistent with worries that social media increases segregation.
We further find that search engines are associated with the highest levels of segregation among the four channels we investigate: 0.12 for descriptive news and 0.20 for opinion. To put these numbers in perspective, a difference of 0.20 corresponds to the ideological distance between the centrist Yahoo News and the left-leaning Huffington Post (or, equivalently, CNN and the right-leaning National Review). Some authors have argued that web-search personalization is a key driver of such effects (Pariser 2011). There are two alternative explanations. The first is that users implicitly influence the ideological leanings of search results through their query formulation by, for example, issuing a query such as “obamacare” instead of “health care reform” (Borra and Weber 2012). The second is that even when presented with the same search results, users are more likely to select outlets that share their own political ideology, especially for opinion content, which has been found in laboratory studies (Garrett 2009; Iyengar and Hahn 2009; Munson and Resnick 2010). While we cannot determine the relative importance of these factors, our findings do suggest that the relatively recent ability to instantly query large corpora of news articles—vastly expanding users’ choice sets—contributes to increased ideological segregation, at least marginally for descriptive news and substantially for opinion stories.
At the other end of the spectrum, aggregators exhibit the lowest segregation. In particular, even though aggregators return personalized news results from a broad set of publications with disparate ideological leanings (Das et al. 2007), the overall effect is relatively low segregation. Even for aggregators, though, segregation for opinion (0.13) is far higher than for descriptive news (0.07).
Given that our results are directionally consistent with filter bubble concerns, how is it that in the Overall Segregation section we found largely moderate overall levels of segregation? The answer, as shown in Table 4, is simply that only a relatively small fraction of consumption is of opinion pieces or from polarizing channels (social and search). Indeed, even after removing apolitical categories like sports and entertainment (which account for a substantial fraction of traffic), opinion still constitutes only 6 percent of consumption. Further, for both descriptive news and opinion, direct browsing is the dominant consumption channel (79 and 67 percent, respectively), dwarfing social media and search engines.
Consumption Volume by Content Type and Channel
| Content type | Channel | Fraction of content type | Fraction of total consumption |
|---|---|---|---|
| News | Direct | 0.79 | 0.76 |
| News | Search | 0.14 | 0.13 |
| News | Social | 0.06 | 0.06 |
| News | Aggregator | 0.004 | 0.004 |
| Opinion | Direct | 0.67 | 0.03 |
| Opinion | Search | 0.23 | 0.01 |
| Opinion | Social | 0.10 | 0.004 |
| Opinion | Aggregator | 0.004 | 0.0002 |
To help explain these results, we note that while sharing information is popular on social media, the dissemination of news is not its primary function. In fact, we find that only 1 in 300 clicks of links posted on Facebook lead to substantive news articles; rather, the vast majority of these clicks go to video- and photo-sharing sites. Moreover, we observe that even the most extreme segregation that we see (0.20 for opinion articles returned by search engines) is not, in our view, astronomically high. In particular, that level of segregation corresponds to the ideological distance between Fox News and Daily Kos, which represents meaningful differences in coverage (Baum and Groeling 2008) but is within the mainstream political spectrum. Consequently, though the predicted filter bubble and echo chamber mechanisms do appear to increase online segregation, their overall effects at this time are somewhat limited.
IDEOLOGICAL ISOLATION
We have thus far examined segregation in terms of the distance between individuals’ mean ideological positions. It could be the case, for example, that individuals typically consume content from a variety of ideological viewpoints, though ultimately skewing toward the left or right, leading to moderate overall segregation. Alternatively, individuals might be tightly concentrated around their ideological centers, only rarely reading content from across the political spectrum. These two potential patterns have markedly different implications for the broader issues of political discussion and consensus formation (Benkler 2006).
To investigate this question of within-user variation, we start by looking at the dispersion parameter σd in the overall consumption model described by equations (1) and (2). We find that σd = 0.06, indicating that individuals typically read publications that are tightly concentrated ideologically. This finding of within-user ideological concentration is driven in part by the fact that individuals often simply turn to a single news source for information: 78 percent of users get the majority of their news from a single publication, and 94 percent get a majority from at most two sources. As shown in the online appendix, however, this concentration effect holds even for those who visit multiple news outlets. Thus, even when individuals visit a variety of news outlets, they are, by and large, frequenting publications with similar ideological perspectives.
We now investigate ideological isolation across consumption channels and subjectivity categories. For each of the eight subjectivity-by-channel categories and for each user, we first estimate the variance of the polarities of articles read by a user in that category.10 For each category, we then average these individual-level estimates of variance (and take the square root of the result) to attain category-level estimates. Figure 4a plots these estimates of within-user variation by channel and subjectivity.
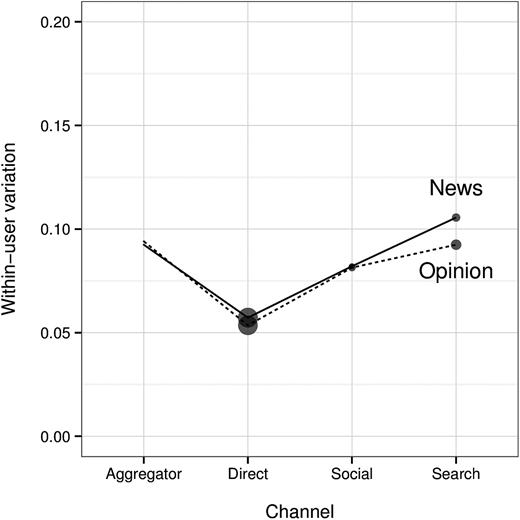
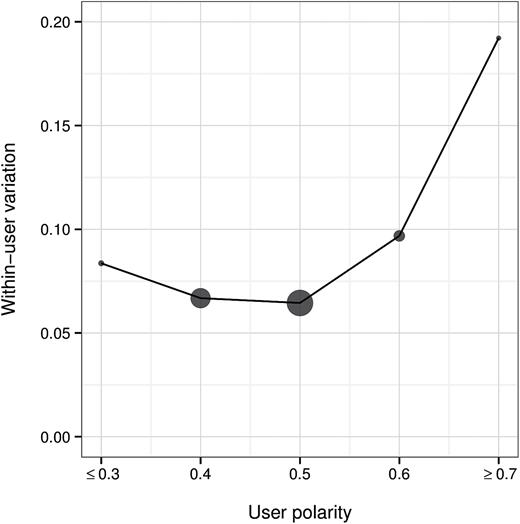
Within-User Variation across Consumption Channel (a) and by Mean Polarity (b).
Across all four consumption channels, figure 4a shows that descriptive and opinion articles are associated with similar levels of within-user variation. Social media, however, is associated with higher variation than direct browsing. Though this may at first seem surprising given that social media also has relatively high segregation, the explanation is clear in retrospect: when browsing directly, individuals typically visit only a handful of news sources, whereas social media sites expose users to more variety. Likewise, web-search engines, while associated with high segregation, have relatively high diversity. Finally, relatively high levels of within-user spread are observed for aggregators, as one might have expected.
We similarly examine within-user ideological variation as a function of user polarity (i.e., mean ideological preference). In this case, we first bin individuals by their polarity—as estimated in the Overall Segregation section—and then compute the individual-level variation of article polarity, averaged over users in each group. As shown in figure 4b, within-user variation is small and quite similar for users with polarity ranging from 0.3 to 0.6. Interestingly, the 2 percent of individuals with polarity of approximately 0.7 or more (significantly to the right of Fox News) exhibit a strikingly high within-user variation of 0.17. This preceding result prompts a question: Does the high within-user variation we see among extreme right-leaning readers result from them reading articles from across the political divide, or are they simply reading a variety of right-leaning publications? More generally, across channels and subjectivity types, what is the relationship between within-user variation and exposure to ideologically divergent news stories? We conclude our analysis of ideological isolation by examining these questions.
We start by defining a news outlet as left-leaning (right-leaning) if it is in the bottom (top) third of the 100 outlets we consider; the full ranked list of publications is given in the online appendix. The left-leaning publications include newspapers from liberal areas, such as the San Francisco Chronicle and the New York Times, as well as blogs such as the Huffington Post and Daily Kos; the right-leaning set includes newspapers from historically conservative areas, such as the Fort Worth Star-Telegram and the Salt Lake Tribune, and online outlets such as Newsmax and Breitbart; and centrist publications (i.e., the middle third) include, for example, Yahoo News and USA Today. We refer to the combined collection of left- and right-leaning outlets as partisan.
For each user who reads at least two partisan articles, define his or her liberal exposure li to be the fraction of partisan articles read that are left-leaning. We define an individual’s opposing partisan exposure as . Thus, for individuals who predominantly read left-leaning articles, oi is the proportion of partisan articles they read that are right-leaning, and vice versa. We note that is defined for only the 82 percent of individuals in our sample that have read at least two partisan articles.
Figure 5 shows average opposing partisan exposure, partitioned by article channel and subjectivity (figure 5a), and by user polarity (figure 5b).11 For every subset we consider, only a small minority of articles—less than 20 percent in all cases, and less than 5 percent for all non-centrist users—comes from the opposite side of an individual’s preferred partisan perspective. Additionally, for every subset, this opposing exposure is lower for opinion. Answering the question posed above, even extreme right-leaning readers have strikingly low opposing partisan exposure (3 percent); thus, their relatively high within-user variation is a product of reading a variety of centrist and right-leaning outlets, and not exposure to truly ideologically diverse content. In contrast, the relatively higher levels of within-user variation associated with social media and web search (figure 4a) do translate to increased exposure to opposing viewpoints, though this effect is still small.
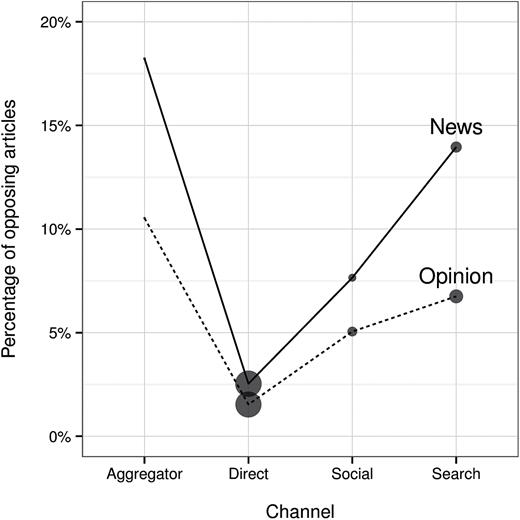
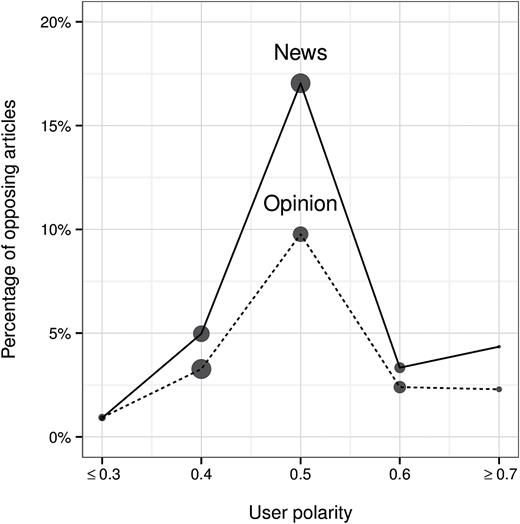
Opposing Partisan Exposure by Channel (a) and Polarity (b). Descriptive news (solid line) and opinion (dotted line). Point sizes indicate the relative fraction of traffic attributed to each source, normalized separately by article category.
The above-defined measure captures the degree to which individuals are exposed to partisan content from both sides of the aisle. One might wonder, though, to what extent are partisans exposed to any cross-cutting sources, including exposure to moderate news outlets? That is, for individuals who read predominantly left-leaning articles, what proportion of articles they view are moderate or right-leaning? And for individuals who read predominantly right-leaning articles, what proportion of their articles are moderate or left-leaning? As must necessarily be the case, opposing exposure is larger under this measure than under the stricter one we use above. Interestingly, however, even under this looser definition, partisans still get the vast majority of their news from either right-leaning or left-leaning sources, with relatively little exposure to even ideologically moderate sources (see figure A5 in the online appendix).
Summarizing our results on ideological isolation, we find that individuals generally read publications that are ideologically quite similar, and moreover, users that regularly read partisan articles are almost exclusively exposed to only one side of the political spectrum. In this sense, many—indeed nearly all—users exist in so-called echo chambers. We note, however, two key differences between our findings and some previous discussions of this topic (Pariser 2011; Sunstein 2009). First, we show that while social media and search do appear to contribute to segregation, the lack of within-user variation seems to be driven primarily by direct browsing. Second, consistent with Gentzkow and Shapiro (2011), the outlets that dominate
partisan news coverage are still relatively mainstream, ranging from the New York Times on the left to Fox News on the right; the more extreme ideological sites (e.g., Breitbart), which presumably benefited from the rise of online publishing, do not appear to qualitatively impact the dynamics of news consumption.
DISCUSSION AND CONCLUSION
Returning to our opening question—the effect of recent technological changes on ideological segregation—there are two competing theories. Some authors have argued that such changes would lead to “echo chambers” and “filter bubbles,” while others predicted that these technologies would increase exposure to diverse perspectives. We addressed the issue directly by conducting a large-scale study of online news consumption. We showed that articles found via social media or web-search engines are indeed associated with higher ideological segregation than those an individual reads by directly visiting news sites. However, we also found, somewhat counterintuitively, that these channels are associated with greater exposure to opposing perspectives. Finally, we showed that the vast majority of online news consumption mimicked traditional offline reading habits, with individuals directly visiting the home pages of their favorite, typically mainstream, news outlets. We thus uncovered evidence for both sides of the debate, while also finding that the magnitude of the effects is relatively modest.
We conclude by noting some limitations of our study. First, as with past work (Groseclose and Milyo 2005; Gentzkow and Shapiro 2010, 2011), for methodological tractability we focus on the ideological slant of news outlets, as opposed to that of specific articles. As such, we would misinterpret, for example, the news preferences of an individual who primarily reads liberal articles from generally conservative sites. We suspect, however, that this type of behavior is relatively limited, in part because individuals typically visit ideologically similar news outlets, suggesting that their own preferences are in line with those of the sites that they frequent. Second, we focus exclusively on news consumption itself, and not on the consequences such choices have on, for example, voting behavior or policy preferences.12 Relatedly, social networks can impact political outcomes through means other than exposure to news, for instance by allowing users to broadcast their decision to vote (Gerber, Green, and Larimer 2008). Third, it is plausible that the stories that have the greatest impact are disproportionately discovered via social networks or search engines, meaning that the true impact of these channels is larger than the raw figures indicate. Fourth, and related to the previous point, as we have focused our study on the (natural) subpopulation of active news consumers, it is unclear what impact recent technological changes have on the majority of individuals who have little exposure to the news, but who may get that limited amount largely from social media. Finally, we note that precisely defining causation in this setting is a difficult issue. For example, is the counterfactual thought experiment one in which social media or search engines do not exist? Or perhaps one imagines the change in experience of a single, prototypical individual who joins (or is prevented from joining) a social media site? Nevertheless, despite these limitations, we believe our findings provide an empirical starting point for understanding how novel means of news consumption affect ideological polarization.
References
———.
———.
We note that this group constitutes a small minority of the overall population. In a 2012 Pew Research survey, only 39 percent of adults claimed to have read online news in the previous day (http://www.people-press.org/2012/09/27/in-changing-news-landscape-even-television-is-vulnerable), while studies recording actual browsing behavior tend to find that this number is quite a bit lower (Goel, Hofman, and Sirer 2012), and a 2014 Pew Research survey reported that while Facebook had risen in popularity as a means of disseminating news, it still trailed both television and radio.
It is likely that we do not have a complete record of a user’s browsing history, in part because an individual may use multiple browsers (e.g., at home and at work), not all of which have the Bing Toolbar installed, and some users browse news on mobile devices, while our sample is restricted to desktop users. Finally, because some sites are constructed such that a single page view can correspond to multiple pieces of distinct content, page view estimates may not reflect the total amount of content an individual sees.
To compute this correlation, we calculated the Spearman correlation of our users’ ranking of Quantcast’s top twenty-five sites to Quantcast’s ranking, and similarly for comparing to Alexa. For comparing Quantcast to Alexa, we used Quantcast’s ranking of Alexa’s top twenty-five sites. In each case, rankings were based on monthly unique visitors.
This list has high overlap with the current Alexa rankings of news outlets (http://www.alexa.com/topsites/category/Top/News).
High precision is possible by focusing on the use of highly polarizing phrases such as “death panel,” but the recall of this method tends to be very low, meaning most pieces of content are not rated. Even with human ratings, the wide variety of sites we investigate—ranging from relatively small blogs to national newspapers—exhibit correspondingly diverse norms of language usage, making any content-level assessment of political slant quite difficult.
One exception is the Wall Street Journal, which we characterize as left-leaning even though it is generally thought to be politically conservative. We note, however, that the most common audience and content-based measures of slant also characterize the paper as relatively liberal (Groseclose and Milyo 2005; Gentzkow and Shapiro 2011). As a robustness check, we repeated our analysis after omitting the Wall Street Journal from our data set, and found that none of our substantive results changed.
Pew Research Center, October 2014, “Political Polarization and Media Habits.” The report is accessible at http://www.journalism.org/interactives/media-polarization/.
While this is standard practice, it ignores, for example, the possibility of a conservative outlet publishing liberal editorials. Ideally, the classification would be done at the article level, but there are no known methods for reliably doing so.
Given the large sample size, all estimates are statistically significant well beyond conventional levels.
For each category, we restrict our data to users who read at least two articles in that category.
To compute the estimates of average opposing partisan exposure shown in figure 5a, is computed separately for each of the eight subjectivity-by-channel categories by restricting our data to the relevant articles, and limiting them to users who read at least two partisan articles in that category.
Establishing and measuring the causal effects of partisan news exposure is difficult, though not impossible (Prior 2013).
Author notes
Address correspondence to Seth Flaxman, Department of Statistics, University of Oxford, 24–29 St. Giles’, Oxford OX1 3LB United Kingdom; e-mail: flaxman@stats.ox.ac.uk.
