


Abstract
This study examined the amount of time married couples share together in a new “encore adult” life course stage around the 50s, 60s, and 70s. Also investigated was the relationship between shared time and experienced well-being for this age group.
Time diary and survey data were used from nationally representative 2003–2014 American Time Use Survey (ATUS) data for 26,303 adults aged 50–79 years. Analyses examined amount of total and exclusive shared couple time and experiences of happiness and stress when together using multivariate models.
Shared time was positively associated with couples living on their own, conjoint employment/nonemployment, and age. Encore women and men reported feeling happier and less stressed when with their spouses. Men seemed to find time with spouses more enjoyable if both partners or just their wives were working.
Encore adults are living longer as couples; results suggest couple relationships may occupy most of their days, with potentially positive implications for emotional well-being. Men and women are happier during time with a spouse when the woman works, with men reporting even higher levels of happiness than women. This is important as contemporary couples navigate increasingly complex work/retirement transitions in gendered ways.
Background
There is evidence that couples’ shared time is important for both marital quality (e.g., Gager & Sanchez, 2003; Milkie & Peltola, 1999) and individual enjoyment and happiness during activities performed with a spouse (Flood & Genadek, 2016; Sullivan, 1996). Research also shows that many people feel they do not have enough time with their spouses and would like to spend more time with them (Bianchi, Robinson, & Milkie, 2006; Nomaguchi, Milkie, & Bianchi, 2005; Roxburgh, 2006). Yet the emphasis of the limited literature is on individuals in the career- and family-building years, with a particular focus on the effects of paid work and parenthood on time spent with a spouse (e.g., Flood & Genadek, 2016; Kingston & Nock, 1987).
This article extends existing research to investigate couples beyond conventional work and family roles, in which one member—or both—has exited the workforce, and after children have largely left home. Given medical advances and lifestyle changes promoting extended life expectancy, people now in their 50s, 60s, and 70s are living longer in coupled relationships than ever before in recorded history. As the frailties associated with old age are postponed, some scholars (e.g., Laslett, 1987; Moen, 2016) see these bonus years as a new life stage. Moen (2016) labels this an “encore” adult stage. Bracketed by prospective and actual work and family transitions away from conventional adult roles on one end and on the other end by the onset of debilitating infirmities associated with being “old,” this stage represents an extension of adulthood and postponement of “old age” as people become retirement eligible or seek new ways of living in their mid-50s, 60s, and 70s. Research shows that there is more heterogeneity in the timing of retirement, that women tend to retire earlier than men, and that a significant number of individuals retire early, in their mid to late 50s (Calvo, Sarkisian, & Tamborini, 2013), suggesting that this large age range is capturing a transitional time in couples’ lives.
This is uncharted terrain. Couples in encore adulthood are not young, but neither are they old in terms of severe infirmities or self-concepts. In fact, 73.6% of Americans ages 65–74 have no disability and live independently (He & Larsen, 2014). Encore adults also tend to feel around ten years younger than they are. One third of Americans ages 65–74 say they feel 10–19 years younger than their actual age; one in six feels at least 20 years younger (Taylor, 2014). There is no singular experience for individuals and couples in this emergent encore to conventional adulthood. Given increasing longevity, better health, and cumulation of advantage/disadvantage processes, there are wide variations in living arrangements, employment status, health behaviors, and retirement circumstances from the mid-50s through the 70s (Flood & Moen, 2015; Moen, 2016; Moen & Flood, 2013; Warner, Hayward & Hardy, 2010).
We know little about how contemporary couples in this age group are spending their time, especially together, and even less about their experienced well-being during time spent with a spouse. Couples’ shared time in earlier life stages is strongly influenced by work and family arrangements, with individuals experiencing more happiness and less stress when sharing time with a spouse (Flood & Genadek, 2016). However, the extent to which work, family, and health shape time-use and well-being patterns during encore adulthood is unknown. We address two primary research questions: How much time do couples spend together during encore adulthood? And, is being with one’s partner associated with experienced happiness or stress?
Global Versus Experienced Well-Being
Note that we are theorizing and measuring well-being differently from most conventional scholarship, which uses global measures of happiness or life satisfaction to assess subjective individual well-being. For example, individuals might be asked “On a scale of 1–10, how satisfied are you with your life?” Global measures of well-being are often influenced by recent experiences, aspirations, and current circumstances (Kahneman & Krueger, 2006). By contrast, momentary or experienced well-being measures tied to specific activities are shown to be more reliable indicators of subjective experienced well-being (2006). These assessments are typically collected either at the time the respondent experiences the activity and emotion or as part of a retrospective time diary. While the first approach is cost prohibitive, burdensome for respondents, and has a higher risk of technical difficulty (Soupourmas, Ironomnger, Brown, & Warner-Smith, 2005), diary-based measures of momentary well-being are reliable (Kahneman, Krueger, Schkade, Schwarz, & Stone, 2004) and available in nationally-representative datasets.
These more contextual, momentary assessments capture emotions at various points during a single day. Assessments of experienced well-being are more granular than global assessments of well-being (e.g., marital quality), with single activities and experience the building blocks of an individual’s global assessment of well-being. Marital relationships are complex and dynamic as are how individuals feel about them; for example, one activity with a spouse may elicit high levels of happiness while another is associated with only moderate happiness, or an activity may be both happy and stressful. Because our data link assessments of happiness and stress with particular activities during a given day, which may or may not have been done with a spouse, we examine how experienced well-being compares when encore adults are with a spouse versus not with a spouse. Our work complements existing research on older adults’ time use and experienced well-being (Carr, Cornman, & Freedman, 2016; Carr, Freedman, Cornman & Schwarz, 2014; Carr & Springer, 2010; Freedman, Cornman, & Carr, 2014) and extends it to focus on couples’ shared time and experiencing feelings of well-being when with a spouse. This research is timely as the large Boomer cohort (born 1946–64) moves to and through this transitionary period.
Life Course Approach
Compared to earlier cohorts, the Boomer cohort is larger, healthier, more likely to work later in life, and more likely to be navigating two retirements per couple as well as bridge or retirement jobs (Moen, 2016). This increasingly complex terrain around paid work and retirement (Moen & Flood, 2013), the positive relationship between marriage and well-being (Carr & Springer, 2010), and the new realities of possibly having more years together in later adulthood than ever in history underscores the importance of understanding how much time older couples are spending with one another, the factors that limit or promote their shared time, and encore adults’ experienced happiness and stress when with their spouses.
Time together
Several key life course themes inform our work. A life course approach emphasizes the importance of locating respondents in historical time (Elder, Johnson, & Crosnoe, 2003). This is key theoretically in understanding the genesis of life stages as resulting from a confluence of institutional forces. Encore adulthood (Moen, 2016) is one such stage in which the bonus years of longevity are coming not at the end of life but around the conventional retirement years. Exhibiting agency, encore adults may have both increased control over their time, such as fewer work and family responsibilities yielding more discretionary time, but also more constraints narrowing their time use, such as declining health (e.g., Carstensen, Fung, & Charles, 2003; Hitlin & Elder, 2007). Accordingly, we expect:
Hypothesis 1: Older couples will spend more time together than those in their 50s.
The life course themes of linked lives and the gendered life course point to the social embeddedness of individuals in relationships (Elder et al., 2003) and different experiences of work and family for men and women (Moen & Spencer, 2006). As they shed career and childcare obligations, couples may have more discretionary time than ever, but whether they spend it together may depend on the extent to which couples are able to coordinate their exits from employment and other types of care obligations for grandchildren, ailing parents, or other infirm relatives.
Hypothesis 2: Encore couples’ work obligations and others living in the household will constrain couples’ time together.
Experienced well-being
The same life course themes are relevant for informing how being with a spouse may be tied to experienced well-being. Recall that our focus is on momentary assessments of happiness and stress during activities performed with or not with one’s spouse. If being with one’s spouse is the result of a constrained choice due to a lack of other engagements, individuals may experience less happiness/more stress when with their spouse. On the other hand, if married individuals want to be together, their well-being may be enhanced during time with a spouse versus apart. Fortunately, American Time Use Survey (ATUS) data allow us to investigate associations between being with a spouse and experienced well-being. Based on research examining happiness and stress during an earlier stage of the life course (Flood & Genadek, 2016), we expect:
Hypothesis 3: Encore adults will feel less stress and more happiness when with their spouses than when apart.
Both men and women may invest more time in and reap more positive emotions from their marriage as paid work roles and relationships recede (Carstensen et al., 2003). As the marital relationship becomes more salient in the absence of other obligations, we expect:
Hypothesis 4: Happiness/stress during time with a spouse will be higher/lower among older respondents compared to younger respondents.
A gendered life course perspective (Moen & Spencer, 2006) suggests time together may result in different emotional experiences for husbands and wives given their distinctive pathways to and through the encore adult years, especially regarding paid work (Ho & Raymo, 2009; Moen, Kim, & Hofmeister, 2001; Kim & Moen, 2002). The relevance of the marital relationship may be different for men and women given the greater salience of paid work for men’s lives and their traditional identities as breadwinners.
Hypothesis 5: Employed husbands will be happier and less stressed when with their spouses compared to men who are not working.
Method
We use integrated yearly ATUS data (Hofferth, Flood, & Sobek, 2015) from 2003 to 2014 to examine time spent with a spouse during the encore adult years. The ATUS is a time diary survey of a nationally representative sample of Americans. One individual aged 15 years or older per household was randomly selected to participate in ATUS following their exit from the Current Population Survey. ATUS data are collected using a computer assisted telephone interview, and the respondents report the activities they engaged in over a 24-hr period from 4:00 a.m. of a specified day until 4:00 a.m. of the following day, as well as where, when, and with whom activities were done. While weekends are oversampled, sample weights correct for the survey design such that aggregating across different days of the week results in a representative picture of average time use among the population. We restrict our sample to married respondents with a spouse in the household at the time of the ATUS interview; both partners’ ages were between 50 and 79 (N =26,303).
We used Ordinary Least Squares (OLS) regression to estimate the relationship between couple-level characteristics and shared time during encore adulthood. We used OLS regression despite having zeroes in our dependent variables (8.35% in total shared time and 14.58% in exclusive time) because recent evidence indicates that OLS produces less biased estimates than Tobit (Stewart, 2013). We have time diary data from one member of each couple, but using the co-presence data within the respondent’s diary, we constructed our dependent variables. The co-presence data was obtained by asking respondents who they were with during most activities during the diary day, excluding paid work, personal care, and sleep activities. We constructed two measures of time shared with a spouse based on the respondent’s time diary. Total shared time is a continuous measure of the total minutes per day with one’s spouse regardless of who else, if anyone, was present. Exclusive time is a subset of total shared time, indicating the minutes per day respondents spent with only their spouses.
The focal independent variables of interest are couple-level family composition, couple-level work status, and (wife’s) age. We also include sociodemographic variables: educational attainment and race for both partners as well as indicators for gender of the respondent, weekend days, holidays, year, and region of the country.
Supplementary Appendix Table 1 documents our sample. The transitionary nature of the encore years is reflected in patterns of employment. One-third (33%) of the couples in our sample had both husband and wife working for pay, one-fifth (20%) had only the husband employed, and 13% had only the wife working for pay. Thus, in only one-third of our sample were neither member of the couple employed. There was less variation in family composition, with 70% of the couples living exclusively with just their spouses. Very few (4%) lived with children or grandchildren under 18, even as over one in five (22%) had an adult child (18+) in the household. Less than one percent was living with an older parent, and only four percent had someone else in the household. Husband and wife ages were highly correlated, so in couple-level models we included the wife’s age and a variable for the difference in age between spouses. Though the incipient encore adulthood stage may be more of a state of mind and a time of work and family transitions than a specific age range, we operationalize it from ages 55–80 (the period of retirement transitions) as a way of capturing this transitionary phase, including as well those ages 50–54 as a comparison group. We measured (wife’s) age in 5-year increments to gauge any potential nonlinear effects of age, with the 5-year categorization being a completely arbitrary division.
Respondents to the ATUS Well-Being Module, fielded in 2010, 2012, and 2013, reported their happiness and stress on a seven-point scale during three randomly selected activities. Respondents were asked “From 0–6, where a 0 means you were not happy/stressed at all and a 6 means you were very happy/stressed, how happy/stressed did you feel during this time?” Using these reports, along with information on who respondents were with during the activity, our analysis compared respondents’ ratings of feelings of happiness and stress during time spent with their spouse versus not with their spouse. Feelings of happiness and stress measures were related but not the obverse of one another (correlation for men is −.346 and for women is −.293). Because the experienced well-being measures were available for respondents in just three years of ATUS data, our well-being analysis was performed for a subset of our original sample, which included 2,917 men and 3,090 women. Nearly all respondents (97.59%) reported well-being for three activities, 2.22% for two activities, and .19% for only one activity.
We leveraged the multiple experienced well-being reports per respondent to estimate an activity-level random effects model to understand whether activities performed with their spouses resulted in more happiness and less stress than activities without their spouses. The random effects model allows for clustering among individual well-being responses and estimating the relationship between being with a spouse and experienced well-being, while controlling for the ongoing activity and individual characteristics that may also affect well-being. The random effects models include the same controls we used in the prior OLS analyses of shared time along with the broad activity, the duration of time spent in that activity on the time-diary day, and the amount of time spouses spent together prior to each activity in the analysis.
Results
Couples’ Time
Married couples in their encore years spent an average of 333 min (5.5 hr) together per day, with most of this spent exclusively with one’s spouse (259 min or 4.3 hr). Consistent with hypothesis 1, in which we expected older couples to spend more time together than younger couples, Table 1 shows that both average total shared and exclusive time together are higher among adults in each subsequent 5-year age group, with differences between each pair of 5-year age groups between ages 55 and 79 statistically significant. Couples on the precipice of the encore years in their early 50s (wife ages 50–54) spent an average of 4.5 hr together each day, while couples in the second half of their 70s (wife ages 75–79) spent an average of 7.6 hr together. Similarly, time spent exclusively with one’s spouse was more than twice as much in the later encore years compared with in the early 50s (3.1 vs 6.5 hr).
Mean Daily Minutes Shared for Couples Aged 50–79 Years
| Total shared time | Exclusive time | |
|---|---|---|
| Family Type | ||
| Spouse only | 358.2 | 298.4 |
| Children (under 18) | 232.9 | 101.9 |
| Children (18+) | 283.1 | 181.1 |
| Parent(s) | 246.2 | 119.1 |
| Other(s) | 307.3 | 187.5 |
| Work Status | ||
| Neither working | 457.0 | 373.1 |
| Both working | 249.5 | 183.0 |
| Only husband works | 289.9 | 213.3 |
| Only wife works | 309.8 | 239.8 |
| Wife’s Age | ||
| 50–54 | 269.8 | 187.5 |
| 55–59 | 292.4 | 217.7 |
| 60–64 | 338.7 | 269.9 |
| 65–69 | 393.9 | 320.3 |
| 70–74 | 438.0 | 365.5 |
| 75–79 | 459.7 | 391.8 |
| Observations | 26,303 | 26,303 |
Note: Sample includes married ATUS respondents ages 50–79 years from 2003 to 2014.
Couples’ shared time varied substantially by household family arrangements and paid work, as expected (hypothesis 2). Couples in the most common living arrangement—living as a couple—spent the most time together. Couples with in-house caregiving responsibilities—those with children under age 18 or one or more older parents in the household—spent the least amount of time together. Shared time also varied by paid work commitments in encore adulthood. Couples in which neither spouse worked for pay spent more time together than did couples where one or both members worked for pay; nonworking couples averaged more than two more per day in total and exclusive shared time.
Table 2 presents results from the OLS regression estimates of the relationship among age, work, and family circumstances, and shared time while controlling for additional demographic characteristics. The age coefficients indicate the difference in shared time for couples in which the wife is in one of the 5-year age groups compared to couples in which the wife is age 50–54. We found differences for those in their 60s and 70s in both total and exclusive shared time compared to 50–54-year olds as expected in hypothesis 1. Differences in shared time were largest for those couples in which the wife was in her late 70s; they spent nearly an hour more per day together (both in total [52 min] and exclusive [64 min] time) than couples in their early 50s.
OLS Estimates of Couples’ Total Shared Time and Exclusive Spousal Time in Encore Adulthood
| Total shared time | Exclusive time | |
|---|---|---|
| Family Type (ref. spouse only) | ||
| Children (under 18) | −55.794***(6.27) | −131.373***(4.88) |
| Children (18+) | −32.140***(4.50) | −78.396***(4.13) |
| Parent(s) | −72.811***(14.56) | −143.099***(12.58) |
| Other(s) | −36.999***(9.17) | −99.393***(8.35) |
| Work Status (ref. neither working) | ||
| Both working | −177.896***(5.39) | −144.708***(5.06) |
| Only husband works | −145.562***(5.38) | −126.960***(4.97) |
| Only wife works | −125.540***(6.04) | −104.235***(5.63) |
| Wife’s Age (ref. 50–54) | ||
| 55–59 | −0.497 (4.62) | −0.493 (4.13) |
| 60–64 | 9.565 (5.30) | 13.419** (4.87) |
| 65–69 | 20.672** (6.37) | 24.403*** (5.88) |
| 70–74 | 38.500*** (7.73) | 45.307*** (7.34) |
| 75–79 | 51.916*** (10.19) | 64.347*** (9.61) |
| Constant | 414.3 | 362.7 |
| R-squared | 0.2132 | 0.1946 |
| F-statistic | 163.41 | 149.37 |
| Observations | 26,303 | 26,303 |
Note: Sample includes married ATUS respondents ages 50–79 years from 2003 to 2014. The regressions include husband and wife’s age difference, husband’s race, wife’s race, husband’s educational attainment, wife’s educational attainment, sex of respondent, year, region, season, holiday, and weekend. Robust standard errors are in the parentheses. OLS = Ordinary Least Squares.
*p < .05 (nothing significant at this level andso, it is not indicated in the table); **p < .01; ***p < .001.
Similar to the descriptive findings and in support of hypothesis 2, multivariate results showed large significant differences in couples’ total and exclusive shared time by household composition and by work status. Residing with anyone in addition to a spouse is associated with less shared time (both total and exclusive), though differences are largest for couples with children under age 18 in the home (56 fewer minutes [total] and 131 fewer minutes [exclusive]) and those with elderly parents in the household (73 fewer minutes [total] and 143 fewer minutes [exclusive]). Couples with adult children at home and those who lived with others (such as a sibling, grandchild, or friend) also spent less time together than those living with a spouse only, though the differences were smaller in magnitude than for those living with young children or parents.
Results in Table 2 showed a strong negative relationship between couple-level paid work status and shared time in the encore adult years, which is consistent with hypothesis 2. When both spouses worked they spent the least amount of time together compared to couples where neither partner worked. Having only one spouse working for pay was also associated with less shared time, both in total and exclusive time together, about two hours less per day, on average.
Experienced Well-Being
Table 3 shows average experiences of happiness and stress during all activities overall and during time in activities with and without one’s spouse broken down by gender, family type, work status, and wife’s age. The overall means show that both men and women in their encore adult years were happier and less stressed when they were with a spouse than not, consistent with hypothesis 3. Results are in the expected direction (more happiness and less stress when with the spouse versus not) for each of our key independent variables even if they do not always reach statistical significance. We turn to multivariate models (see Table 4) to evaluate how experienced well-being varies by gender, age, work status, and family type, net of other factors.
Momentary Assessments of Experienced Happiness and Stress for Married Men and Women
| Happiness | Stress | |||||
|---|---|---|---|---|---|---|
| Overall | Without spouse | With spouse | Overall | Without spouse | With spouse | |
| Overall Mean | 4.45 | 4.34* | 4.63 | 1.27 | 1.46* | 0.95 |
| Gender | ||||||
| Men | 4.37 | 4.28* | 4.53 | 1.22 | 1.41* | 0.88 |
| Women | 4.52 | 4.40* | 4.73 | 1.32 | 1.50* | 1.01 |
| Wife’s Age | ||||||
| 50–54 | 4.26 | 4.09* | 4.67 | 1.56 | 1.79* | 1.00 |
| 55–59 | 4.44 | 4.34* | 4.64 | 1.43 | 1.62* | 1.04 |
| 60–64 | 4.49 | 4.47 | 4.51 | 1.26 | 1.37* | 1.09 |
| 65–69 | 4.48 | 4.37* | 4.64 | 0.94 | 1.09* | 0.75 |
| 70–74 | 4.71 | 4.70 | 4.72 | 0.90 | 0.92 | 0.88 |
| 75–79 | 4.65 | 4.55 | 4.75 | 0.82 | 0.90 | 0.74 |
| Work Status | ||||||
| Neither working | 4.51 | 4.41* | 4.61 | 1.05 | 1.10 | 1.00 |
| Both working | 4.38 | 4.25* | 4.73 | 1.54 | 1.79* | 0.87 |
| Only husband works | 4.48 | 4.42 | 4.61 | 1.21 | 1.33* | 0.98 |
| Only wife works | 4.42 | 4.32* | 4.58 | 1.20 | 1.40* | 0.86 |
| Family Type | ||||||
| Spouse only | 4.49 | 4.41* | 4.62 | 1.18 | 1.35* | 0.92 |
| Children (under 18) | 4.22 | 4.15 | 4.45 | 1.40 | 1.46 | 1.18 |
| Children (18+) | 4.38 | 4.22* | 4.72 | 1.43 | 1.65* | 0.95 |
| Parent(s) | 4.27 | 4.21 | 4.49 | 2.11 | 2.26 | 1.56 |
| Other(s) | 4.34 | 4.19* | 4.63 | 1.57 | 1.76 | 1.19 |
Note: Sample includes three randomly selected activities for married ATUS respondents ages 50–79 years from 2010, 2012, and 2013. The * indicates the mean experienced well-being is statistically different at p < .05 for activities performed with versus without the spouse.
Activity-Level Random Effects Estimates of Happiness and Stress
| Happy | Stress | |
|---|---|---|
| With Spouse | 0.197*** (0.034) | −0.104*** (0.031) |
| Female | 0.161*** (0.040) | 0.212*** (0.040) |
| With Spouse × Female | −0.037 (0.046) | −0.002 (0.046) |
| Family Type (ref. spouse only) | ||
| Children (under 18) | −0.158* (0.073) | 0.091 (0.072) |
| Children (18+) | −0.045 (0.046) | 0.150** (0.049) |
| Parent(s) | −0.424** (0.162) | 0.872*** (0.263) |
| Other(s) | −0.183* (0.088) | 0.267** (0.097) |
| Work Status (ref. neither working) | ||
| Both working | 0.144** (0.052) | −0.175** (0.054) |
| Only husband works | 0.145** (0.055) | −0.123* (0.054) |
| Only wife works | 0.068 (0.058) | −0.163** (0.059) |
| Wife’s Age (ref. 50–54) | ||
| 55–59 | 0.121* (0.050) | −0.137* (0.053) |
| 60–64 | 0.168** (0.056) | −0.177** (0.059) |
| 65–69 | 0.208** (0.066) | −0.414*** (0.066) |
| 70–74 | 0.315*** (0.078) | −0.452*** (0.078) |
| 75–79 | 0.461*** (0.100) | −0.533*** (0.097) |
| Constant | 3.915*** (0.089) | 1.199*** (0.093) |
| Sigma_u | 1.130 | 1.154 |
| Sigma_e | 1.090 | 1.078 |
| Rho | 0.518 | 0.534 |
| Observations | 17099 | 17099 |
| Respondent Observations | 5787 | 5787 |
Note: Sample includes married respondents ages 50 to 79 from 2010, 2012, and 2013. The regressions include husband and wife’s age difference, husband’s race, wife’s race, husband’s educational attainment, wife’s educational attainment, sex of respondent, year, region, season, holiday, weekend, activity, duration of time in activity, amount of time spent with spouse at time of activity. Robust standard errors are in the parentheses.
*p < .05; **p < .01; ***p < .001.
Results from random effects models (Table 4) show that after controlling for individual-level, couple-level, and activity-level characteristics men and women in the encore adult years were happier when with their spouses than not (.197) and less stressed when together (−.104), both yielding support for hypothesis 3. While women reported higher levels of happiness and stress than men when with their spouse, men’s and women’s well-being was similarly enhanced when with their spouse versus not.
To evaluate differences in well-being during time with a spouse by age and employment (hypotheses 4 and 5), we estimated models including three-way interactions among gender, being with a spouse, and age (and employment). To simplify interpretation, we estimated marginal effects and tested differences between margins using Wald tests. We present selected significant differences between margins graphically (full results are available upon request).
Contrary to our expectations in hypothesis 4, we find limited differences in levels of happiness or stress during time with a spouse for men and women who are older compared to younger. Men and women in their 50s and women in their early 70s are happier when they are with their spouse than without their spouse (see Figure 1 for significant differences). When comparing levels of happiness when with a spouse for adjacent 5-year age groups, we found no differences. Men in their 50s and women in their early 50s experience less stress when they are with their spouse versus not. Only for men/women 65–69 compared to men/women 60–64 do we find lower stress when with a spouse at older ages.
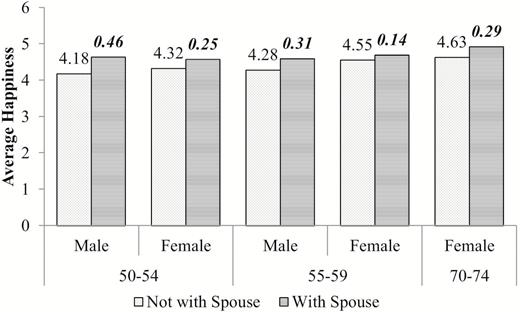
Happier when with a spouse by gender and wife’s age. Note: Numbers above “Not with Spouse” bars are marginal means for happiness during activities not with a spouse. Italicized numbers above “with” bars indicate the size of the difference between activities with versus not with a spouse.
In hypothesis 5, we posited that men who worked would be happier and less stressed when with their wives compared to men who did not work. Figure 2 shows the significant differences in time with versus not with a spouse by gender and employment. Both men and women are happier when sharing time with their spouse when both members of the couple are employed. Women are happier with their husbands than not when neither member of the couple works but this is not the case for men; men are happier during time spent with their wives when their wives work. In terms of stress, we found that men and women experience less stress when they are with their spouses compared to not if both the husband and wife are employed.
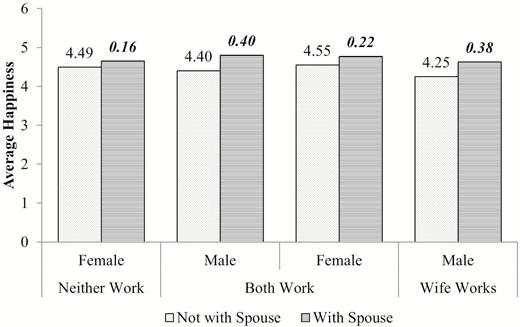
Happier when with a spouse by gender and couple employment status. Note: Numbers above “Not with Spouse” bars are marginal means for happiness during activities not with a spouse. Italicized numbers above “with” bars indicate the size of the difference between activities with versus not with a spouse.
Discussion
Couple relationships today—especially at older ages—are arguably unique. Contemporary married men and women can expect more years of life—and more years together—than ever in recorded history. Their lives are linked, to be sure, but exactly to what degree is unknown. Furthermore, they are living as couples within a confluence of economic, demographic, social, and technological changes transforming expectations about the timing and very meaning of both retirement and couple relationships. How to promote quality time, that is, time together with emotional rewards, matters for individuals, couples, and communities, especially as growing numbers of neighbors, colleagues, relatives, and friends move through this incipient and unprecedented life stage.
We investigated the amount of time encore adult couples spend together, predictors of shared time, and whether being with a spouse was associated with enhanced experienced well-being (more happiness and/or less stress). We found considerable variation in the time couples in these bonus years spend together depending on their ages, employment status, and living arrangements. This heterogeneity points to both the transitional nature of this encore adult stage and the fact that it has not yet been institutionalized in the ways that retirement as a marker of old age was taken for granted 50 years ago (Moen, 2016).
Previous research documents that work and family demands limit younger couples’ shared time; whether this is also the case for older couples was the empirical question we addressed, finding that both work and family circumstances continued to constrain couples’ time together. While family demands are different during encore adulthood—very few members of our sample had young children in the household—the results indicate that having anyone coresiding with the couple is associated with less time couples spend together. Note that having an older parent in the home has the largest impact on limiting couples’ shared time. However, actually living with one or more older parents is rare; only one percent of couples in this encore life stage are doing so.
We have suggestive evidence as well of the continuing importance of employment in shaping older couples’ shared time. Paid work limited the time available to spend together as a couple in encore adulthood, as is true in earlier stages of the life course. Work was associated with less time with a spouse. And yet having both partners employed seems linked to both men’s and women’s well-being, with married men reporting higher levels of happiness when with their wives if both partners or only the wife was working. This suggests the importance of theorizing and testing gender differences in the agency of both partners, the voluntariness of being in or out of the workforce, as well as in the meaning of time together for both health and well-being. It reminds us that life course processes are also gendered, given institutional constraints and options but also different role expectations and identities (Moen, 2001).
For those who are married, considerable time together is apparently the norm at this period of life when couples are neither young nor old. As our life course approach suggested, our results show that such increases reflected the effects of shifts in other age-related circumstances, such as family or paid work responsibilities. Supplemental analyses of shared time for synthetic cohorts reinforce the cross-sectional age patterns we observed. Supplementary Appendix Table 2 shows that for each 5-year age group (50–54 through 65–69 in 2003/2004), average time with a spouse a decade later, that is, in 2013/2014 when members of the cohort are 60–64 through 75–79, increased for those in their 50s and early 60s in 2003/2004.
With age there were also changes in overall health. Self-reported health was only asked of a small subsample of ATUS respondents and not their partners. Still, in post-hoc analysis we used the subsample of respondents from our sample of married couples aged 50–79 to examine the association between respondents’ health and time with their spouses (Tables available from authors). We found that women who rated their health as “excellent” or “very good” spent about 20 more minutes per day with their spouses compared to those in just “good” health as did men in “very good” health compared to men with only “good” health. This points to the importance in future studies of both partners’ health (not available in the ATUS) and spousal caregiving as related to couples’ time together and their well-being, whether together or apart.
Our analysis of not only time but also experienced well-being is an important advancement, promoting greater understanding of couple relationships during this stage of life. Consistent with work by Freedman and colleagues (2014), which showed that caring for a spouse compared to doing chores is associated with better experienced well-being (more happiness and less frustration), we find that being with a spouse (versus not) is associated with enhanced well-being (more happiness and less stress). Our work also reiterates the importance of gender and employment for marital relationships—with men’s happiness during time with a spouse higher than when both members of the couple work or just the wife worked. This is consequential as Americans are working longer, into their 60s and 70s.
Limitations and Future Directions
A major limitation of our study is that our cross-sectional data can only show correlations, not causality. We need longitudinal data to document any actual increase in shared time with age or differences associated in changes in household composition or couple work status. We tried to capture some sense of change by constructing synthetic cohorts to better understand whether the age patterns we see hold as cohorts age (Supplementary Appendix Table 2), showing that within cohorts shared time increases with age.
An equally important, if not greater, limitation is the fact that we have time use and experienced well-being data from one member of the couple only. With couple-level data from the Panel Study of Income Dynamics Disability and Use of Time Supplement, for example, researchers could examine whether couples agree about the time they spend together and whether they have similar shared time experiences
We show the continuing importance of paid work for couple relationships, but lack the data to say why the husband, wife, or both is either working or out of the labor force. This is important: first, more older Americans are working longer, and, second, there is no consensus as to whether working longer is stressful because it is necessary for income or whether those working are happy to remain engaged in paid work. And yet our evidence suggests that having both couples in the workforce, possibly pursuing second acts rather than career jobs, predicts less experienced stress and more happiness for both women and men when they are with a spouse.
Our gendered life course theoretical approach raises the issue of agency, which is also relevant for time spent with a spouse. We cannot say whether men and women differently choose (or feel obligated to) spend time with a spouse. However, the lower happiness returns for older men in time with a spouse suggests that shared time may be a constrained choice for men. Whether marriage is a continuing source of support in the encore years—a sort of social convoy (Antonucci, Fiori, Birditt, & Jackey, 2010) providing companionship and a safety net—or whether it is an enduring social arrangement with repeated routines that give shape to one’s days, weeks, and lives (Pearlin, 1988) is an empirical question. Most likely couples’ relationships at this time of life consist of elements of all these—support, repeated routines, and a shared history—with time together linked to both higher levels of happiness and lower levels of stress. However, additional research using both quantitative and qualitative data is needed to flesh out these mechanisms.
For men especially, it appears when there is less time for being together, happiness is higher—if men are working, they are happier when they are with their wives during randomly selected daily activities, and if their wife is working, regardless of if they are, they enjoy the time with their spouse more. This early suggestive evidence on the employment, time together, and well-being relationship is especially important as growing numbers of women and men in this age group are advancing or delaying their age of retirement and/or are taking on bridge or retirement jobs (Bonsang & Klein, 2012; Calvo et al., 2013). Additional research is needed to consider the dynamics of both the amount of time spent working and the amount of time together, as well as whether working is voluntary for either or both spouses or simply a way to make ends meet. It could well be that time together is more valued when there is less of it, which would account for men being happier when sharing time their wives when they both work or when only the wife works and women being happier when with their spouse when both work or neither works.
As mentioned earlier, we do not have a measure of marital quality. This may be an important as both a predictor and outcome of time spent together. And it may be related in complex ways to stress and happiness. For example, Birditt and colleagues found marital quality to be an important moderator between a global sense of stress and the health of older coupled adults (Birditt, Newton, Cranford, & Ryan, 2016; Birditt, Newton, Cranford, & Webster, 2016). Carr and colleagues (2016) found that more negative assessments of marital quality were associated with lower experienced well-being, which accordingly may influence both the amount and quality of time with a spouse.
In this article, we do not account for couples’ conjoint or separate caregiving for one another or for family members residing elsewhere. Caregiving obligations may impact both time together and the well-being experiences during that time (Freedman et al., 2014). The voluntariness of time together and of caregiving for others (including one’s spouse) would likely matter in shaping the ways men and women experience their shared time as happy or stressful.
Studies of time use and experienced well-being around the transition out of marriage during the encore adult years are also needed, as well as the different experiences of women and men during the process of marital dissolution, whether from divorce or widowhood, or in single-person households. This is an important issue since 72% of men aged 65 and older are living with a spouse compared to only 45% of women in this age group (Vespa, Lewis & Kreider, 2013), suggesting some selection effects (whether from divorce or death) in couples as they age.
Funding
This work was supported by the Minnesota Population Center (HD041023), the Time Use Data Access System (HD053654), and the University of Colorado Population Center (HD066613) all funded through grants from the Eunice Kennedy Shriver National Institute for Child Health and Human Development (NICHD).
Conflict of Interest
None reported.

