


Abstract
The prevalence of adults with Alzheimer disease (AD) aged >65 years is increasing and estimated to quadruple by 2051.
The aim of this study was to investigate postural stability in people with mild to moderate AD and factors contributing to postural instability compared with healthy peers (controls).
A computerized systematic search of databases and a hand search of reference lists for articles published from 1984 onward (English-language articles only) were conducted on June 2, 2015, using the main key words “postural stability” and “Alzheimer's disease.”
Sixty-seven studies were assessed for eligibility (a confirmed diagnosis of AD, comparison of measured postural stability between participants with AD and controls, measured factors potentially contributing to postural instability).
Data were extracted, and Downs and Black criteria were applied to evaluate study quality.
Eighteen articles were analyzed using qualitative synthesis and reported based on the Preferred Reporting Items for Systematic Reviews and Meta-Analyses (PRISMA) guidelines. Strength of evidence was guided by the Grading of Recommendations Assessment, Development and Evaluation. Strong evidence was found that: (1) older adults with mild to moderate AD have reduced static and functional postural stability compared with healthy peers (controls) and (2) attentional demand during dual-task activity and loss of visual input were key factors contributing to postural instability.
Deta-analysis was not possible due to heterogeneity of the data.
Postural stability is impaired in older adults with mild to moderate AD. Decreasing visual input and concentrating on multiple tasks decrease postural stability. To reduce falls risk, more research discerning appropriate strategies for the early identification of impairment of postural stability is needed. Standardization of population description and consensus on outcome measures and the variables used to measure postural -instability and its contributing factors are necessary to ensure meaningful synthesis of data.
By 2050, the prevalence of dementia has been predicted to be 96 million, with 70% attributable to Alzheimer disease (AD).1,2 Late-onset AD occurs in older adults aged 65 years and above.3 The highest prevalence and incidence rates are noted in developed countries; for instance, in the United States, 1 in 9 people aged 65 years and older (11%) has AD, and this rate increases to 32% by 85 years of age.3 That is, incidence increases exponentially with age.4
Alzheimer disease is a neurodegenerative cortical disorder that affects cognitive function, resulting in poor executive function and attention, as well as functional capacity and behavior.5–7 The exact mechanism of the pathological changes for this disorder remains unclear. Throughout the progress of the disease, motor changes are noticeable,8–10 including difficulty in movement planning11,12 and a disturbed and cautious gait.13–15 One recent study in elderly people with dementia showed that postural stability performance was 32% poorer compared with that of peers without cognitive impairments.16 That study16 and other studies17–19 also showed a high risk of falls in older adults with AD. Falls are a frequent cause of hospitalization and institutionalization in people with AD.20,21
Ability to control body sway or postural stability is important for movement control of everyday functional activity, such as walking and transferring body weight from one position to another. It is achieved by the successful integration of many systems and factors, including the cortical system,22,23 the sensory system,24–26 the musculoskeletal system,26–28 and the environment to which the body is reacting.26 Impairment of any one of these systems and factors or alteration in standing support surface may challenge postural stability and increase the probability of falling.
One systematic review29 and 2 narrative reviews13,30 have discussed the falls risk factors related to people with dementia, but these reviews did not focuse on AD. Harlein et al29 suggested that the factors contributing to falls in older adults with dementia and cognitive impairment are multifactorial. Physiological changes (eg, impaired vision, low bone mineral density), medication (eg, neuroleptics), impaired functional performance, and even a history of falls were all found to increase the risk of falls.29 As AD is a prevalent form of dementia in older adults, understanding the risk factors for falls and effects of postural instability is imperative in this clinical group.
Currently, the cognitive function of older adults with AD is assessed widely using the Mini-Mental State Examination (MMSE)31 and the Clinical Dementia Rating (CDR).32 Specific score values within these scales are used to determine mild, moderate, and severe cognitive impairment.31,32 Studies exploring the effects of physical intervention for older adults with AD typically include those with mild to moderate cognitive impairment and exclude those with severe impairment.33–36 People with mild to moderate cognitive impairment are of interest because this population has usually retained sufficient components of cognitive function and maintained physical function to a level that ensures the completion of postural stability tests and interventions safely.37–40 This population also is likely to receive the greatest benefits from any intervention.41 It is important, therefore, to identify the factors that predict, are associated with, or contribute to postural instability in people with mild to moderate AD so that appropriate falls prevention interventions in this clinical group can be developed and implemented. No previous review, to our knowledge, has specifically explored these factors in people with mild to moderate AD; therefore, this review is novel. The research questions for this systematic review were: (1) Do people with mild to moderate AD have reduced postural stability compared with a healthy peers (control) group? and (2) What factors contribute to, or have an impact on, postural instability in people with mild to moderate AD?
Method
Data Sources and Searches
To identify articles, a computerized systematic search of the MEDLINE, Embase, AMED, PubMed, Scopus, and Web of Science databases and a hand search of reference lists for articles published from 1984 onward, limited to English-language articles, were undertaken. Gray literature was excluded. The search period was determined by the publication of the classification for clinical diagnosis of AD in 1984 by the National Institute of Neurological and Communicative Disorders and Stroke and the Alzheimer's Disease and Related Disorders Association (NINCDS-ADRDA).5,42 The searches were carried out on June 2, 2015, using the main key words “postural stability” and “Alzheimer's disease” (see eAppendix 1, available at academic.oup.com/ptj, for detailed search strategy). The Boolean operators “AND” and “OR” were used to combine the key words. The title and abstract of identified papers were screened by 2 independent reviewers (N.M., M.K.) to identify relevant articles. The full texts of these articles were obtained and reviewed by 2 independent reviewers (N.M., M.K.) against predetermined inclusion criteria. Disagreements were discussed and resolved by consensus with a third reviewer (L.H.).
Study Selection
Design
Study designs included in the review were observational study designs (prospective cohort study, case-control study, longitudinal study, and cross-sectional study) that included people with AD and healthy peers (controls).
Participants
Participants had to be diagnosed with AD, confirmed by medical specialists based on NINCDS-ADRDA criteria,5,42 or dementia of AD type confirmed by the Diagnostic and Statistical Manual for Mental Disorders (DSM)43 or the International Classification of Disease and Related Health Problems, 10th revision (ICD-10).44 Further criteria included participants’ being aged 40 years and above and the presence of mild to moderate cognitive impairment, as this population is likely to benefit the most from any physical intervention.41
Level of cognitive impairment score had to be assessed with a validated global cognitive function test such as the MMSE31 or the CDR.32,45 Mini-Mental State Examination scores range between 0 and 30. Normal cognition is classified as a score between 23 and 30, and mild, moderate, and severe cognitive impairment is classified as scores of 18 to 23, 10 to 17, and < 10, respectively.31 The classification for the CDR is 0 (normal), 0.5 (questionable cognitive impairment), 1 (mild), 2 (moderate), and 3 (severe) to indicate the level of cognitive function.32
Articles were included in the review if more than 80% of the participants were diagnosed with AD and had mild to moderate cognitive impairment or there were separate data based on level of cognitive impairment and the comparison group comprised peers who were cognitively intact.
Outcome measures. Studies had to use validated measures of postural stability. These measures included: (1) a measure of static, dynamic, or functional performance of postural stability, either a laboratory measure (eg, computerized dynamic posturography platform [EquiTest, Neurocom International Inc, Clackamas, Oregon] or force platform [AccuGait, Advanced Mechanical Technology Inc, Watertown, Massachusetts]) or a clinical measure (eg, Berg Balance Scale,46 Step Test47) used in conditions that ensure vision, somatosensory, and vestibular senses are available, and (2) an analysis of factors contributing to or affecting postural stability (eg, a measure of muscle power or of the somatosensory, visual, or vestibular system). For the purposes of this systematic review, static postural stability was defined as the ability to maintain the body within the limits of stability during quiet standing.28Dynamic postural stability was defined as the ability to maintain or regain stability after an external threat or change in the platform sufficient to challenge the balance occurred.28Functional performance of postural stability was defined as a rate of performance in a set of tasks to evaluate the ability to maintain stability in a particular posture or activity.48
Data Extraction and Quality Assessment
Data were extracted from the included studies by one reviewer (N.M.) independently and cross-checked by a second reviewer (M.K.) to a standardized extraction form. Information and data were extracted about the study method (design, participant sample data [sample size, age, sex, cognitive function, diagnosis criteria, duration of illness, setting, and country]), details of postural stability measures (postural stability testing, protocol, measurement of postural stability, and finding of the studies), and details of factors contributing to postural instability.
The quality of included studies was assessed using a modified checklist by Downs and Black (Tab. 1).49 The Downs and Black checklist was designed to accommodate various study methods. When items are not relevant due to methodology, they are not included. The interrater reliability of the modified Downs and Black checklist, which was used in our study, is moderate to good (intraclass correlation coefficient = .73; 95% CI = .47, .88).50 For our review, out of 28 items, 14 items were used to represent 4 categories: reporting, external validity, internal validity (bias), and internal validity (confounding). Items 4, 8, 9, 13 through 15, 17, 19, 21, 23 through 24, and 26 were not used because they are not relevant for observational study designs51 and relate more specifically to randomized trials (eg, inclusion of an independent control group). Each item was assessed by 2 independent raters (N.M., M.K.), with a third rater (M.P.) resolving any disagreements for each study. A study was considered of high quality if the combined item score was 75% or greater, of moderate quality if it scored 50% to 74%, and of low quality if it scored less than 50%.51 The score from this quality assessment was used to justify the risk of bias and the strength of evidence to address the research questions of this systematic review. Absent information was marked “unclear.”
Modified Downs and Black Quality Scores of the Included Studiesa
| Study | Reporting | External Validity | Internal Validity (Bias) | Internal Validity (Selection Bias) | |||||||||||||||
|---|---|---|---|---|---|---|---|---|---|---|---|---|---|---|---|---|---|---|---|
| 1 | 2 | 3 | 5 | 6 | 7 | 10 | % | 11 | 12 | % | 16 | 18 | 20 | % | 22 | 25 | % | Average Score (%) | |
| Allan et al (2005)21 | 1 | 1 | 2 | 1 | 1 | 1 | 1 | 44.4 | 0 | 0 | 0.0 | 1 | 1 | 1 | 16.7 | 1 | 1 | 11.1 | 72 |
| Andrade et al (2014)55 | 1 | 1 | 1 | 2 | 1 | 1 | 1 | 44.4 | 0 | 0 | 0.0 | 1 | 1 | 1 | 16.7 | 0 | 0 | 0.0 | 61 |
| Chong et al (1999)56 | 1 | 1 | 1 | 1 | 1 | 1 | 0 | 33.3 | 0 | 1 | 5.6 | 1 | 1 | 1 | 16.7 | 1 | 0 | 5.6 | 61 |
| Chong et al (1999)57 | 1 | 1 | 1 | 1 | 1 | 1 | 1 | 38.9 | 0 | 1 | 5.6 | 1 | 1 | 1 | 16.7 | 1 | 0 | 5.6 | 67 |
| Dickin and Rose (2004)58 | 1 | 1 | 2 | 2 | 1 | 0 | 0 | 38.9 | 1 | 1 | 11.1 | 1 | 1 | 1 | 16.7 | 0 | 1 | 5.6 | 72 |
| Elble and Leffler (2000)59 | 1 | 1 | 1 | 2 | 1 | 1 | 1 | 44.4 | 1 | 0 | 5.6 | 1 | 1 | 1 | 16.7 | 0 | 0 | 0.0 | 67 |
| Franssen et al (1999)60 | 1 | 1 | 1 | 1 | 1 | 0 | 1 | 33.3 | 1 | 0 | 5.6 | 1 | 1 | 1 | 16.7 | 0 | 1 | 5.6 | 61 |
| Gago et al (2015)61 | 1 | 1 | 2 | 2 | 1 | 0 | 1 | 44.4 | 1 | 0 | 5.6 | 1 | 1 | 1 | 16.7 | 0 | 1 | 5.6 | 73 |
| Gras et al (2015)62 | 1 | 1 | 1 | 1 | 1 | 0 | 1 | 33.3 | 1 | 0 | 5.6 | 1 | 1 | 1 | 16.7 | 0 | 0 | 0.0 | 56 |
| Kato-Narita et al (2011)63 | 1 | 1 | 1 | 2 | 1 | 1 | 1 | 44.4 | 1 | 1 | 11.1 | 1 | 1 | 1 | 16.7 | 0 | 0 | 0.0 | 72 |
| Kido et al (2010)64 | 1 | 1 | 1 | 0 | 1 | 1 | 1 | 33.3 | 1 | 0 | 5.6 | 1 | 1 | 1 | 16.7 | 1 | 0 | 5.6 | 61 |
| Leandri et al (2009)65 | 1 | 1 | 1 | 1 | 1 | 1 | 1 | 38.9 | 0 | 0 | 0.0 | 1 | 1 | 1 | 16.7 | 0 | 0 | 0.0 | 56 |
| Manckoundia et al (2006)66 | 1 | 1 | 1 | 1 | 1 | 1 | 0 | 33.3 | 1 | 1 | 11.1 | 1 | 1 | 1 | 16.7 | 0 | 0 | 0.0 | 61 |
| Mignardot et al (2014)67 | 1 | 1 | 2 | 2 | 1 | 1 | 1 | 50.0 | 1 | 0 | 5.6 | 1 | 1 | 1 | 16.7 | 1 | 1 | 11.1 | 83 |
| Nakamura et al (1997)68 | 0 | 1 | 2 | 2 | 1 | 1 | 0 | 38.9 | 1 | 0 | 5.6 | 1 | 1 | 1 | 16.7 | 0 | ø | 0.0 | 61 |
| Pettersson et al (2002)70 | 1 | 1 | 2 | 2 | 1 | 0 | 1 | 44.4 | 0 | 0 | 0.0 | 1 | 1 | 1 | 16.7 | 1 | 0 | 5.6 | 67 |
| Pettersson et al (2005)69 | 1 | 1 | 2 | 2 | 1 | 0 | 0 | 38.9 | 1 | 1 | 11.1 | 1 | 1 | 1 | 16.7 | 1 | 1 | 11.1 | 78 |
| Suttanon et al (2012)71 | 1 | 1 | 2 | 2 | 1 | 1 | 1 | 50.0 | 1 | 0 | 5.6 | 1 | 1 | 1 | 16.7 | 0 | ø | 0.0 | 72 |
≥75% = high quality, 50%–74% = moderate quality, < 50% = low quality. 1 = yes (1), 0 = no, ø = unable to determine.
Data Synthesis and Analysis
The data were pooled in respect to postural stability performance and contributing factors of postural instability in people with mild to moderate AD. Heterogeneity of the data was calculated to evaluate the possibility of conducting a meta-analysis. The I2 value was estimated to be between 75% and 100% (ie, that of considerable heterogeneity of the data).52 This estimate was likely due to clinical heterogeneity with differences in participants recruited, outcome measures used, or methodological heterogeneity due to differences in study design evident among studies. Therefore, the data were analyzed using qualitative synthesis and reported using a narrative approach based on the Preferred Reporting Items for Systematic Reviews and Meta-Analyses (PRISMA) guidelines.53 The strength of evidence was guided by the Grading of Recommendations Assessment, Development and Evaluations (GRADE) approach and indicated as (1) “strong evidence,” with at least of one high-quality study and supported by 3 moderate-quality observational studies with high consistency of findings; (2) “moderate evidence,” with ≥4 moderate-quality observational studies with high consistency of findings; or (3) “weak evidence,” with ≤3 moderate- or low-quality observational studies with inconsistency of findings.54
Results
Results of Study Search
The initial computerized search returned 1,394 articles. Seven additional records were identified through other sources, such as Google Scholar. After the first screening of titles and abstracts, 67 articles were retrieved for full-text evaluation. A final total of 18 studies met the inclusion criteria and were included in the review. A hand search of the reference lists did not yield any additional studies for inclusion. Details of the included and excluded studies are shown in the Figure. The list of excluded studies is presented in eAppendix 2 (available at academic.oup.com/ptj).
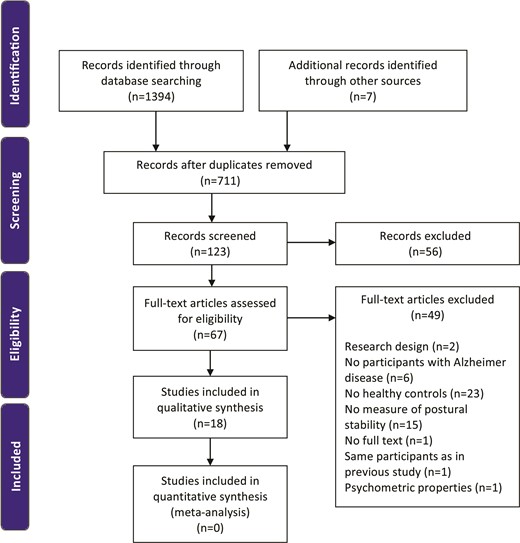
Flow of studies through the review.
Study Design
A summary of the included studies is presented in Table 2. Eighteen cross-sectional studies investigated and compared postural stability in people with mild to moderate AD who were cognitively intact and healthy peers.21,55–71
Characteristics of the Included Studiesa
| Participants | ||||
|---|---|---|---|---|
| Study | Design | AD Group | Control Group | Country |
| Allan et al (2005)21 | CS | n = 40 | n = 42 | United Kingdom |
| Age (y) = 78.6 (5.6) | Age (y) = 75.9 (6.7) | |||
| Sex = 18 M, 22 F | Sex = 22 M, 20 F | |||
| CAMCOG = 59.0 (14.5) | CAMCOG = 94.0 (4.7) | |||
| Diagnosis = NINCDS-ADRDA | Recruitment = community | |||
| Duration of illness = 3 y (2–67 mo) | ||||
| Recruitment = cases in neurology, geriatric -psychiatry, and geriatric medical services | ||||
| Andrade et al (2014)55 | CS | n = 12 | n = 13 | Brazil |
| Age (y) = 72.2 (7.3) | Age (y) = 65.8 (4.5) | |||
| Sex = 3 M, 9 F | Sex = 6 M, 7 F | |||
| MMSE = 20.7 (4.0) | MMSE = 27.6 (2.5) | |||
| Diagnosis = DSM-IV/ICD-10 | Recruitment = participants in specific physical activity program | |||
| Duration of illness = not reported | ||||
| Recruitment = participants in specific physical activity program | ||||
| Chong et al (1999)56 | CS | n = 11 | n = 12 | United Kingdom |
| Age (y) = 72 (10) | Age (y) = 62 (5) | |||
| Sex = 5 M, 6 F | Sex = 7 M, 5 F | |||
| MMSE = 19 (5) | MMSE = unable to determine | |||
| Diagnosis probable AD = NINCDS-ADRDA | Recruitment = unable to determine | |||
| Duration of illness = not reported | ||||
| Recruitment = unable to determine | ||||
| Chong et al (1999)57 | CS | n = 11 | n = 17 | United Kingdom |
| Age (y) = 73 (10) | Age (y) = 65 (6) | |||
| Sex = 6 M, 5 F | Sex = 9 M, 8 F | |||
| MMSE = 19 (6) | MMSE = unable to determine | |||
| Diagnosis = NINCDS-ADRDA | Recruitment = unable to determine | |||
| Duration of illness = not reported | ||||
| Recruitment = unable to determine | ||||
| Dickin and Rose (2004)58 | n = 6 | n = 10 | United States | |
| Age (y) = 82.0 (3.6) | Age (y) = 76.5 (3.8) | |||
| Sex = not reported | Sex = not reported | |||
| MMSE = 22.2 (2.8) | MMSE = 29.0 (0.7) | |||
| n = 6 | Recruitment = unable to determine | |||
| Age (y) = 79.3 (5.5) | ||||
| Sex = not reported | ||||
| MMSE = 10.2 (2.6) | ||||
| Diagnosis = NINCDS-ADRDA | ||||
| Duration of illness = not reported | ||||
| Recruitment = community and long-term care facilities | ||||
| Elble and Leffler (2000)59 | CS | n = 11 | n = 27 | United States |
| Age (y) = 76.3 (4.9) | Age (y) = 74.7 (5.7) | |||
| Sex = 6 M, 5 F | Sex = 15 M, 12 F | |||
| MMSE = 25 (2.3) | MMSE = 28.70 (1.3) | |||
| Diagnosis = NINCDS-ADRDA | Recruitment = community | |||
| Duration of illness = not reported | ||||
| Recruitment = outpatients of Department of Neurology and Center for Alzheimer's Disease and Related Disorders | ||||
| Franssen et al (1999)60 | CS | n = 101 | n = 195 | United States |
| Age (y) = 73.3 (7.7) | Age (y) = 68.1 (9.6) | |||
| Sex = not reported | Sex = not reported | |||
| MMSE = 22.1 (3.9) | MMSE = 29.2 (0.9) | |||
| GDS = 4 | GDS = 1 and 2 | |||
| Diagnosis = NINCDS-ADRDA | Recruitment = spouse of participants with AD | |||
| Duration of illness = not reported | ||||
| Recruitment = outpatient at Aging and Dementia Research Centre | ||||
| Gago et al (2014)61 | CS | ADNF | n = 16 | Portugal |
| n = 9 | Age (y) = 72.3 (7.1) | |||
| Age (y) = 73.6 (8.7) | Sex = 10 M, 6 F | |||
| Sex = 2 M, 7 F | CDR = unable to determine | |||
| CDR = 1 (range = 0.5–2) | Recruitment = caregivers of participant with AD | |||
| Duration of illness (y) = 2.3 (1.9) | ||||
| ADF | ||||
| n = 11 | ||||
| Age (y) = 77.6 (4.8) | ||||
| Sex = 4 M, 7 F | ||||
| CDR = 2 (range = 0.5–2) | ||||
| Duration of illness (y) = 2.8 (1.5) | ||||
| Diagnosis = DSM-IV and NINCDS/ADRDA | ||||
| Recruitment = hospital outpatient neurology department | ||||
| Gras et al (2015)62 | n = 13 | n = 13 | United States | |
| Age (y) = 72.9 (4.7) | Age (y) = 72.6 (4.6) | |||
| Sex = 10 M, 3 F | Sex = 10 M, 3 F | |||
| MMSE = 24.8 (2.6) | MMSE = 29.0 (1.0) | |||
| CDR = 0.5 | Recruitment = personal contact of -researchers | |||
| Diagnosis = a board-certified neurologist specializing in AD | ||||
| Duration of illness = not reported | ||||
| Recruitment = University of Kansas Alzheimer's Disease Center | ||||
| Kato-Narita et al (2011)63 | n = 48 | n = 40 | Japan | |
| Age (y) = 77 (6.3) | Age (y) = 74.5 (7.3) | |||
| Sex = 14 M, 34 F | Sex = 18 M, 22 F | |||
| MMSE = 16.2 (5.1) | MMSE = 26.8 (3) | |||
| Diagnosis = NINCDS-ADRDA | Recruitment = unable to determine | |||
| Duration of illness = not reported | ||||
| Recruitment = outpatient service at a university hospital | ||||
| Kido et al (2010)64 | CS | n = 21 | n = 390 | Japan |
| Age (y) = 79 (6) | Age (y) = 67 (7) | |||
| Sex = 6 M, 15 F | Sex = 151 M, 239 F | |||
| Hesegawa Dementia Scale = 16 (4) | Hesehawa Dementia Scale = unable to determine | |||
| Diagnosis = NINCDS-ADRDA | Recruitment = Medical Check-Up Program, Ehime University Hospital | |||
| Duration of illness = not reported | ||||
| Recruitment = Ehime University Hospital | ||||
| Leandri et al (2009)65 | CS | n = 15 | n = 15 | Italy |
| Age (y) = 77.6 (range = 69–84) | Age (y) = 76 (range = 70–86) | |||
| Sex = 7M, 8F | Sex = 7 M, 8 F | |||
| MMSE = not available | MMSE = >28 | |||
| Diagnosis = NINCDS-ADRDA and DSM-IV | Recruitment = unable to determine | |||
| Duration of illness = 2 y | ||||
| Recruitment = unable to determine | ||||
| Manckoundia et al (2006)66 | CS | n = 13 | n = 17 | France |
| Age (y) = 79.7 (5.1) | Age (y) = 78.5 (4.4) | |||
| Sex = 6 M, 7 F | Sex = 9 M, 8 F | |||
| MMSE = 21 (2) | MMSE = 28.5 (4) | |||
| Diagnosis = NINCDS-ADRDA and DSM-IV | Recruitment = community | |||
| Duration of illness = not available | ||||
| Recruitment = living at home or in a nursing home specializing in AD | ||||
| Mignardot et al (2014)67 | CS | n = 243 | n = 228 | France |
| Age (y) = 83 (5.8) | Age (y) = 72.5 (6.1) | |||
| Sex = 93 M, 150 F | Sex = 136 M, 92 F | |||
| MMSE = 19.3 (4.4) | MMSE = 28 (2.3) | |||
| Diagnosis = NINCDS-ADRDA and DSM-IV | Recruitment = unable to determine | |||
| Duration of illness = not reported | ||||
| Recruitment = memory clinic, Angers University Hospital | ||||
| Nakamura et al (1997)68 | CS | n = 15 | n = 15 | Japan |
| Age (y) = 75.9 (3.6) | Age (y) = 77.1 (3.4) | |||
| Sex = 5 M, 10 F | Sex = 5 M, 10 F | |||
| MMSE = 18.6 (1.7) | MMSE = 27.4 (1.3) | |||
| CDR = 1 | Recruitment = day care program at a local nursing home | |||
| Duration of illness (y) = 2.2 (1.8) | ||||
| n = 15 | ||||
| Age (y) = 77.5 (4.0) | ||||
| Sex = 4 M, 11 F | ||||
| MMSE = 11.4 (2.6) | ||||
| CDR = 2 | ||||
| Duration of illness (y) = 4.3 (1.6) | ||||
| Diagnosis = NINCDS-ADRDA and DSM-III | ||||
| Recruitment = inpatients of geriatric hospitals | ||||
| Pettersson et al (2005)69 | n = 22 | n = 33 | Sweden | |
| Age (y) = 68 (9.9) | Age (y) = 57 (9.2) | |||
| Sex = 12 M, 10 F | Sex = 20 M, 13 F | |||
| MMSE = 24 (range = 17–30) | MMSE = 29 (range = 27–30) | |||
| Diagnosis = DSM-IV | Recruitment = unable to determine | |||
| Duration of illness = not reported | ||||
| Recruitment = referral from general practitioners, specialists, company health care doctors, and other clinics in Stockholm | ||||
| Pettersson et al (2002)70 | CS | n = 17 | n = 18 | Sweden |
| Age (y) = 74 (range = 67–82) | Age (y) = 74 (range = 64–84) | |||
| Sex = 9 M, 8 F | Sex = 9 M, 9 F | |||
| MMSE = 25 (range = 21–29) | MMSE = 29.5 (range = 27–30) | |||
| Diagnosis = NINCDS-ADRDA and DSM-III | Recruitment = relative of participant with AD/pre-existing register of healthy control | |||
| Duration of illness = not reported | ||||
| Recruitment = memory clinics at Huddinge University Hospital | ||||
| Suttanon et al (2012)71 | CS | n = 25 | n = 25 | Australia |
| Age (y) = 80.4 | Age (y) = 80.4 | |||
| Sex = 9 M, 16 F | Sex = M 9, F 16 | |||
| MMSE = 21.1 | MMSE = 29.2 | |||
| Diagnosis = NINCDS-ADRDA | Recruitment = community and existing -volunteer database at a research institute | |||
| Duration of illness = not reported | ||||
| Recruitment = memory clinic and community | ||||
All values expressed as mean (SD) or as indicated. AD = Alzheimer disease; ADF = faller with AS; ADNF = nonfaller with AD; CAMCOG = Cambridge Cognition Examination; CDR = Washington University Clinical Dementia Rating; CS = cross-sectional study; DSM-III = Diagnostic and Statistical Manual for Mental Disorders, Third Edition; DSM IV = Diagnostic and Statistical Manual for Mental Disorders, Fourth Edition; GDS = Global Deterioration Scale; ICD-10 = International Classification of Disease and Related Health Problems, 10th Revision; MMSE = Mini-Mental State Examination; NINCDS-ADRDA = National Institute of Neurological and Communicative Disorders and Stroke and Alzheimer's Disease and Related Disorders Association; M = male; F = female.
Setting
The trials were conducted across different countries, including the United Kingdom,21,56,57 Brazil,55 United States,58–60,62 Portugal,61 Japan,63,64,68 Italy,65 France,66,67 Australia,71 and Sweden.69,70 Eleven studies21,59–64,67–70 were conducted in a laboratory setting of a university or a hospital. Two studies58,66 were conducted in a long-term care facility and a community setting. One study55 recruited participants from a specific physical activity program, 1 study71 recruited participants from a memory clinic and the community, and 3 studies56,57,65 did not specify how participants were recruited.
Participants
Sample sizes of individual studies ranged from 22 to 471 participants. The distribution of female participants was 318/512 in the mild to moderate AD group and 503/986 in the control group. However, one study60 did not report sex distribution. The mean age of participants with mild to moderate AD across studies was 76 years (SD = 4, range = 68–83). In the control group, the mean age was 72 years (SD = 6, range = 57–82).
Diagnosis
The diagnosis of AD was based on the NINCDS-ADRDA criteria21,56–61,63–68,70,71; Diagnostic and Statistical Manual for Mental Disorders, Fourth Edition (DSM-IV),55,61,65–67,69Diagnostic and Statistical Manual for Mental Disorders, Third Edition (DSM-III),68,70 and ICD-10.55 The determination of AD was based on clinical assessments and subsequently confirmed by a medical specialist in one study.62
Cognitive Function
Cognitive function was tested using the MMSE,55–58,60,63,65–67,69–71 CDR,62,68 Cambridge Cognition Examination (CAMCOG),21 Hesegawa Dementia Scale,64 Alzheimer's Disease Assessment Scale–Cognitive subscale (ADAS-cog),65 and Global Deterioration Scale (GDS).60 All studies classified people with AD as having mild to moderate cognitive impairment, with MMSE values ranging from 10 to 30, CAMCOG values ranging from 34.5 to 73.5, CDR values ranging from 0.5 to 2, and a GDS score of 4. Leandri et al65 used the MMSE and ADAS-cog subscale to classify mild to moderate cognitive impairment but did not state their cutoff scores.
For the control group, 14 studies21,55,58–60,62,63,65–71 reported the score of “normal” from cognitive function tests. The remaining studies simply stated that cognitive function of healthy peers was normal.
Measurement of Postural Stability
This review includes studies that used both laboratory (Tab. 3) and clinical outcome (Tab. 4) measures of postural stability. Ten different laboratory-based measures were used to evaluate postural stability: EquiTest computerized dynamic posturography platform,57 AccuGait force platform,55 BioRescue,67 SMART Balance Master,58 computerized motion analysis system,59 triaxial accelerometers and gyroscopes,61 stabilometry,65 Techno Concept force platform,66 Gravicoder,68 and NeuroCom Balance Master.71 The postural stability measurement variables used were center-of-pressure–based variables,55,65–67 root mean square,68 center-of-mass–based variables,57,59,61 sway velocity,71 limit of stability variables,71 and center of gravity and percent equilibrium.58
Summary of the Included Laboratory-Based Studiesa
| Study | Postural Stability Testing | Task/Protocol/Instruction | Measurement of Postural Stability | Results | Quality |
|---|---|---|---|---|---|
| Andrade et al (2014)55 | Force platform, AMTI model (AccuGait) | Upright stance, arms alongside the body and gaze on the target. | Static postural stability, | No significant difference (COP displacement P = .98 and COP area P = .96) | 61 |
| Sampling rate = 100 Hz | COP position-based: | ||||
| Trial length = 40 s | 1. COP displacement (mm) | ||||
| No. of trials = 3 | 2. COP area (mm2) | ||||
| Chong et al (1999)57 | Computerized dynamic posturography platform (EquiTest) | Participants’ ability to maintain in-place postural stability under combination of normal, absent, and incongruent visual, vestibular, and somatosensory support surface conditions were tested | The calculated ankle and hip angles from the trigonometric conversions were used to derive the participant's AP COM | No significant -difference (P > .05) in C1 and C4 | 61 |
| Upright stance ⋅ 6 conditions | Static (C1) and dynamic (C4) postural stability: | ||||
| (C1: EO_NS, C2: EC_NS, C3: IV_NS, C4: EO_IS, C5: EC_IS, C6: IV_IS) | 1. PTP AP COM sway on -successful trials | ||||
| Sampling rate = 50 Hz | 2. PTP AP COM sway amplitude | ||||
| Trial length = 20 s | |||||
| No. of trials = C1-C2, 2 trials; C3-C6, 3 trials | |||||
| Dickin and Rose (2004)58 | SMART Balance Master | Participants’ ability to maintain in-place postural stability under combination of normal, absent, and incongruent visual, vestibular, and somatosensory support surface conditions were tested | Static (C1) and dynamic (C4) postural stability: | No significant difference in COG movement velocity (P > .05) in C1 and C4 | 72 |
| Upright stance ⋅ 6 conditions | 1. COG movement velocity | Significant difference for percent equilibrium (P = .07) in C1 and C4 | |||
| (C1: EO_NS, C2: EC_NS, C3: IV_NS, C4: EO_IS, C5: EC_IS, C6: IV_IS) | 2. Percent equilibrium | ||||
| Sampling rate = 50 Hz | |||||
| Trial length = 20 s | |||||
| No. of trials = 18 | |||||
| Computerized motion analysis system | Participants were instructed to push or pull the force cursor into the target box as quickly and as accurately as possible while maintaining stable erect stance without leaning into or away from the bar | Dynamic postural stability, | No significant difference (P > .15) | 67 | |
| Stable erect stand (elbow flexion at 30° and shoulder flexion at 45° in sagittal plane) ⋅ 4 conditions (75% push, 50% push, 75% pull, 50% pull) | COM position-based: | ||||
| No. of trials = 4 | 1. COM displacement (cm) | ||||
| Gago et al (2014)61 | Triaxial accelerometers and gyroscopes | Quiet Romberg stance (medial aspect of the feet touching together) ⋅ 2 conditions (EO and EC) ⋅ 3 platforms (flat surface, backward and forward inclination) | Static and dynamic postural -stability, COM position-based: | No significant difference in all conditions (P > .05) | 73 |
| Sampling rate = 113 Hz | 1. Total COM displacement (cm) | ||||
| Trial length = 30 s | 2. Maximum COM displacement (cm)–safety limit | ||||
| No. of trials = the trial was invalidated and started again if participants moved any part of their body, spoke, opened eyes, or did a corrective step | 3. AP COM displacement (cm) | ||||
| 4. ML COM displacement (cm) COM velocity-based: | |||||
| 5. Maximum COM velocity (cm−1) | |||||
| Leandri et al (2009)65 | Stabilometry | Upright stance ⋅ 2 conditions (EO and EC) | Static postural stability, | Significant difference in all conditions and directions (P < .05) | 56 |
| Sampling rate = 100 Hz | COP position-based: | ||||
| Trial length = NA | 1. AP COP displacement (mm) | ||||
| No. of trials = NA | 2. ML COP displacement (mm) | ||||
| 3. COP area (mm2) | |||||
| Manckoundia et al (2006)66 | Force platform (Techno Concept) | Upright stance with EO and looking straight at a 13 circle on the wall 2 m away for approximately 13 s | Static postural stability: | Significant difference in all directions (P < .05) | 61 |
| COP position-based | |||||
| 1. COP displacement (mm) | |||||
| 2. COP area (mm2) | |||||
| Mignardot et al (2014)67 | Force platform (BioRescue) | Upright stance ⋅ 2 conditions (EO and EC) | Static postural stability: | Significant difference in all conditions and directions (P < .05) | 83 |
| COP velocity-based | |||||
| Sampling rate = 5 Hz | AP COP velocity (AAMV) (mm·s−1) | ||||
| Trial length = 51.2 s | |||||
| No. of trials = 2 | |||||
| Nakamura et al (1997)68 | Gravicorder | Romberg stance for 60 s | Static postural stability: | Significant differences (P < .05) | 61 |
| Sampling rate = 20 Hz | RMS | ||||
| Trial length = 60 s | |||||
| No. of trials = NA | |||||
| Suttanon et al (2012)71 | NeuroCom Balance Master | Upright stance ⋅ 4 conditions (EO, EC, EOF, ECF) (mCTSIB) | Variables: | No significant difference in all conditions, except in mCTSIB (EO P = .06 and ECF P < .001), LOS_MXE P < .001 and LOS_DCL (P < .001) | 72 |
| Upright stance ⋅ 8 directions | Static postural stability: | ||||
| Sit-to-stand sway | 1. Sway velocity (°/s) | ||||
| Dynamic postural stability: | |||||
| 2. LOS_MVL (°/s) | |||||
| 3. LOS_MXE (% LOS boundary) | |||||
| 4. LOS_DCL (%) | |||||
| Functional postural stability: | |||||
| 5. Sit-to-stand sway velocity (°/s) |
AMTI = Advanced Medical Technology Inc, AAMV = average absolute maximal velocity; AP = anterior-posterior; EC, eyes closed; EO, eyes open; C1 = EO_NS, condition 1: eyes open with a stable support surface and stable visual around; C2 = EC_NS, eyes closed with a stable support surface; C3 = IV_NS, eyes open with a stable support surface and sway-referenced visual surround; C4 = EO_IS, eyes open with sway-referenced support surface and a stable visual surface; C5 = EC_IS, eyes closed with a sway-referenced support surface; C6 = IV_IS, eyes open with both the support surface and the visual surround sway-referenced support surface; COP = center-of-pressure; DCL = directional control; EOF, eyes open on foam surface; ECF = eyes closed on foam surface; LOS = limits of stability; mCTSIB = modified Clinical Test of Sensory Interaction on Balance; COM = center of mass; ML = medial-lateral; MVL = movement velocity; MXE = maximum excursion; PTP AP COM = peak-to-peak center of mass in anterior-posterior direction; RMS = root mean square; IS = incongruent surface; IV = incongruent visual, COG = center of gravity, NA = not available.
Summary of the Included Clinically Based Studiesa
| Study | Postural Stability Testing | Task | Measurement of Postural Stability | Result | Quality |
|---|---|---|---|---|---|
| Allan et al (2005)21 | POMA | Functional performance: | Scale: | Participants with AD had worse POMA scores than healthy peers (P = .01) | 72 |
| 13 balance items were rated from 0 to 2, with a maximum score of 26 | 1. Mild | Subanalysis showed no significant differences between participants with mild AD and healthy peers (P > .05) | |||
| 9 gait items were rated from 0 to 1, with a maximum score of 9 | 2. Moderate | ||||
| The scores were classified as mild, moderate, and severe impairments | 3. Severe | ||||
| Franssen et al (1999)60 | Parametric rating scale for equilibrium and limb coordination | Functional performance: | Score: | Significantly decreased performance on all 5 clinical tests (P < .05) | 61 |
| There were 5 tests: | Equilibrium and limb coordination The higher the score, the better the postural stability | ||||
| 1. SLS 10 s (both legs) | |||||
| 2. TW 10–30 s | |||||
| 3. FTT 5 s (both feet) | |||||
| 4. Bilateral PS 5 s (both hands) | |||||
| 5. FTH 5 s (both hands) | |||||
| An individual performance of each test was graded on a 7-point rating scale. All tests were performed with eyes open. | |||||
| Three trials were performed, and the highest score was counted for total score. For the bilateral test, the highest of the 2 lateral scores obtained was used for analysis. | |||||
| Gras et al (2015)62 | Tandem stance | ||||
| TUG | Static postural stability: | 1. Time tandem stance maintained (seconds) | Significant difference in all conditions (tandem stance EO and TUG, P < .001) | 56 | |
| 1. Tandem stance × 2 conditions (EO and EC) | 2. Time to complete the task (seconds) | ||||
| Trial length = 60 s | |||||
| Functional performance: | |||||
| 2. TUG measures the time taken to rise from an armchair, walk 3 m, turn, walk back, and sit down again | |||||
| Kato-Narita et al (2011)63 | BBS | Functional performance: | Variable: | Significant difference only in participants with moderate (CDR2) AD (nonfaller group) compared with healthy peers (P < .001) | 72 |
| The 56-point BBS grades. There were 14 tasks, including sitting, rising, transferring, reaching, picking up object from the floor, turning around in a full circle, stepping, and standing on one leg | Score based on specific time and distance requirements | ||||
| Kido et al (2010)64 | SLS | Static postural stability: | One-leg standing time (s) | Significant difference (P < .001) | 61 |
| One-leg standing time with eyes open; maximum time of 60 s. Two trials were given, and the shorter time was used for statistical analysis. | |||||
| Pettersson et al (2005)69 | 1. BBS | Functional performance: | Variables: | Significant difference for TUG (P ≤ .05) | 78 |
| 2. TUG | 1. The 56-point BBS grades. There were 14 tasks, including sitting, rising, transferring, reaching, picking up object from the floor, turning around in a full circle, stepping and standing on one leg. | ||||
| 1. Score based on specific time and distance requirements | |||||
| 2. The TUG measures the time taken to rise from an armchair, walk 3 m, turn, walk back and sit down again. | 2. Time to complete the task (s); the less time, better | ||||
| Pettersson et al (2002)70 | 1. BBS | Functional performance: | Variables: | Significant difference for all clinical tests (P < .001) | 67 |
| 2. TUG | 1. The 56-point BBS grades. There were 14 tasks, including sitting, rising, transferring, reaching, picking up object from the floor, turning around in a full circle, stepping, and standing on one leg. | 1. Score based on specific time and distance requirements | |||
| 3. Figure of eight | 2. The TUG measures the time taken to rise from an armchair, walk 3 m, turn, walk back, and sit down again | 2. Time to complete the task (s) | |||
| 3. The participants were asked to walk twice in figure of 8 twice following the marked figure on the floor | 3. Time to complete the task (s), less steps out of the marked figure of eight, better | ||||
| Suttannon et al (2012)71 | 1. FRT | Dynamic postural stability: | Variables: | Significant difference (P < .001) for all clinical measures | 72 |
| 2. Step Test | 1. This test measures the maximum distance that participants can reach forward with their dominant arm raised 90° without moving their feet, which were positioned 10 cm apart | ||||
| 3. TUG | 2. Participants step with one foot fully on and then off a 7.5-cm-high block as quickly as possible in 15 s | 1. Distance reached from starting position (cm) | |||
| Functional performance: | 2. Number of steps | ||||
| 3.The TUG measures the time taken to rise from a chair, walk 3 m, turn, walk back, and sit down again | 3. Time to complete the task (s) |
AD = Alzheimer disease, BBS = Berg Balance Scale, CDR = Clinical Dementia Rating, EO = eyes open, EC = eyes closed, FRT = Functional Reach Test, FT = foot tapping, FTH = finger to thumb, POMA = Performance-Oriented Mobility Assessment, PS = pronation and supination, SLS = single-leg stance, TUG = Timed “Up & Go” Test, TW = tandem walk.
The clinically based outcome measures were single-leg stance,64 Step Test,71 Functional Reach Test,71 Berg Balance Scale,63,69,70 Performance-Oriented Mobility Assessment,21 Timed “Up & Go” Test,62,69–71 figure-of-eight test,70 and parametric rating scale for equilibrium and limb coordination.60 The variables used for clinical outcome measures of postural stability were: time to complete the tasks, limits of stability measured as a distance (in centimeters), number of steps taken in a set time, classification (mild, moderate, or severe) based on the score of postural stability performance or on the score for a set of tasks to measure functional postural stability performance for equilibrium and limb coordination, and Berg Balance Scale.
Postural stability was tested in quiet single-64 or double-leg stance,55,57–59,65–67,71 tandem stance,62 or Romberg stance61,68 on a normal surface with eyes open55,57–59,61,62,65–67,71; on a normal surface with eyes closed57,58,61,65,67,71; under different circumstances altering sensory feedback (vestibular, vision, somatosensory)57,58,71; and in different platform conditions (incongruent surface, toes-up rotations, rise to toes, backward or forward inclination, and soft surface).57,58,61,71 Functional postural stability performance was tested with a variety of tasks (eg, sit to stand, turning 360°, picking up an object from the floor).21,60,63,69,70
Measurement of Contributing Factors
Factors potentially affecting postural stability were divided into 5 categories (Tab. 5): brain pathology (regional blood flow),68 cognitive (eg, measured with the MMSE),56,61,65 attentional demand (ie, dual-task activity such as carrying a full cup of water),55,66,69,71 motor (lower limb muscle activity and latency56 and preparatory postural activity and reaction time measured with electromyography),59 and sensory (availability of vision, somatosensation, and vestibular)57,58,61,65,67,71 factors.
Factors Identified That Contributed to Reduced Postural Balancea
| Study | Postural Testing | Task or Postural Stability Measure | Causes/Factors Association Measures | Statistics | Statistics and Results | Significantb |
|---|---|---|---|---|---|---|
| 1. Brain pathology | ||||||
| Nakamura et al (1997)68 | Gravicorder | Romberg stance for 60 s RMS | 1. rCBF in the cortex (CDR1–mild) | Pearson correlation | Significant negative correlation (P < .05, rs = –.1 to –.6); postural sway increase with progression of CDR in participants with AD | + |
| 2. rCBF in the cortex and frontal lobe (CDR2–-moderate) | ||||||
| 2. Cognitive | ||||||
| Chong et al (1999)57 | Computerized dynamic posturography platform (EquiTest) | PTP COM sway amplitude | MMSE score | Pearson correlation | No correlation (P>.05) | - |
| Leandri et al (2009)65 | Stabilometry | COP position based in EO and EC -conditions | ADAS-cog | Bivariate Spearman correlation coefficient | Positive linear correlation (P < .05, rs = .7) between ADAS-cog orientation and AP COP sway with EC but not with EO. Other test conditions were only moderately correlated with ADAS-cog scores (rs = .5) | +/- |
| 1. AP COP path (mm) | ||||||
| 2. ML COP displacement (mm) | ||||||
| 3. COP area (mm2) | ||||||
| Gago et al (2014)61 | Kinetic sensing modules embedded in triaxial accelerometers and gyroscopes | Kinetic variables | CDR | Spearman test | No correlation (P = .72) | - |
| 3. Attentional demand | ||||||
| Andrade et al (2014)55 | Force platform (AccuGait) | 1. COP displacement (mm) | Dual task: | Mann-Whitney post hoc test | Significant differences in number of errors in the cognitive task (P ≤.001). Participants with AD had more errors than healthy controls. | + |
| 2. COP area (mm2) | Counting backward by one digit from 30 | |||||
| Manckoundia et al (2006)66 | Force platform (Techno Concept) | Upright stance | Dual task: | Wilcoxon matched-pairs test | Significant difference (P < .05) | + |
| 1. COP displacement (mm) | Differences between ST: upright stance and DT: upright stance and -answer 3 questions about the video sequence | |||||
| 2. COP area (mm2) | ||||||
| Pettersson et al (2005)69 | TUG | TUG (s) | Dual task: | Kruskal-Wallis ANOVA | Significant difference (P ≤ .05) | + |
| Carrying a cup of water | ||||||
| Suttanon et al (2012)71 | TUG | TUG (s) | Dual task: | Independent-sample t test Significant after Bonferroni adjustment | Significant difference (P ≤. 001) | + |
| 1. Counting backward by 3s (missing 5 data) | ||||||
| 2. Carrying full cup of water | ||||||
| 4. Motor | ||||||
| Chong et al (1999)56 | Computerized dynamic posturography platform (EquiTest) | Motor control test: | Muscle activity and latency: | Repeated-measures ANOVA | No significant difference in muscle activity and latency in all tasks and conditions (P > .05). Participants with AD did not have difficulty in changing postural set. During holding trials, participants with AD reduced muscle activity as much as healthy controls. | – |
| The influence of changes in support conditions on postural set was tested in the following sequence: backward translations, toes-up rotations, voluntary rise to toes, and perturbed sitting | 1. Tibialis anterior muscle response | |||||
| Five free-stance trials (participants standing with the arms crossed over their chest) and 5 holding trials (participants hold firmly on to a horizontal, stable frame that was placed at participant's waist | 2. Soleus muscle response | |||||
| 3. Tibialis anterior muscle activity | ||||||
| Elble and -Leffler (2000)59 | Computerized motion analysis system | Stable erect stand (elbow flexion at 30° and shoulder flexion at 45° in sagittal plane) ⋅ 4 conditions (75% push, 50% push, 75% pull, 50% pull) | Preparatory postural activity: | Repeated-measures ANOVA | No significant difference in all tasks (P > .05) | – |
| COM displacement | Preparatory postural activity (was estimated by measuring the net ankle torque and the rate of change of net ankle torque at the time of the initial change in bar force) | |||||
| Computerized motion analysis system and electromyography | Stable erect stand (elbow flexion at 30° and shoulder flexion at 45° in sagittal plane) ⋅ 4 conditions (75% push, 50% push, 75% pull, 50% pull) | Reaction time: | Repeated-measures ANOVA after log10 transformation | Significant difference (P < .001) | + | |
| COM displacement | 1. Upper limb RT (times of initial change in bar force) | Participants with AD had longer mean RT | ||||
| 2. Postural RT (times of initial change in ankle torque) | ||||||
| 5. Sensory system | ||||||
| Chong et al (1999)57 | Computerized dynamic posturography platform (EquiTest) | Upright stance ⋅ 6 conditions: | 1. Vision, somatosensation, and vestibular (C2, C3, C4, C5, C6) | Chi square test | No significant difference except in C2 (P > .05). In C2, participants with AD had less sway compared with healthy peers | –/+ |
| (C1: EO_NS, C2: EC_NS, C3: IV_NS, C4: EO_IS, C5: EC_IS, C6: IV_IS) | 2. Romberg -ratio (comparison of EO and EC conditions) | Romberg ratio: | ||||
| PTP COM sway amplitude | Participants with AD did not sway as much as healthy controls when standing with EC (p < .01) | |||||
| Dickin and Rose (2004)58 | SMART Balance Master | Upright stance ⋅ 6 conditions: | Vision, somatosensation, and vestibular (C2, C3, C4, C5, C6) | ANOVA | No significant difference between groups in all conditions and all levels of cognitive function measured by COG movement velocity (P > .01) | -/+ |
| (C1: EO_NS, C2: EC_NS, C3: IV_NS, C4: EO_IS, C5: EC_IS, C6: IV_IS) | Significant difference between participants with mild SDAT and healthy peers in C2, C4, and C5 measured by percent equilibrium (P ≤ .01–.05). Other conditions and cognitive functions were not significantly different (P > .01–.05). | |||||
| 1. COG movement velocity | ||||||
| 2. Percent equilibrium | ||||||
| Gago et al (2014)61 | Kinetic sensing modules embedded in triaxial accelerometers and gyroscopes | Romberg stance ⋅ 2 conditions (EO and EC) ⋅ 3 platforms (flat surface, backward and forward inclination) | Vision EC and Romberg ratio (comparison of EO and EC conditions) | Kruskal-Wallis test (EC) | Romberg stance EC: | +/- |
| 1. Total COM displacement (cm) | Wilcoxon matched-pairs test (Romberg ratio) | Significant difference among groups on flat surface (total [P < .05], maximum [P < .01], ML [P < .01] range displacement) | ||||
| 2. Maximum COM displacement (cm) | Romberg ratio: | |||||
| 3. Maximum COM velocity (cm−1) | Significant difference on flat surface in ADF (P < .05) (total, maximum, and AP displacement) | |||||
| 4. AP displacement (cm) | Significant difference (P < .01) on backward inclination in ADF (total and AP displacement) | |||||
| 5. ML displacement (cm) | Almost significant difference on forward inclination in ADF (P = .05) | |||||
| Others variables under specific condition were not significantly different (P>.05) | ||||||
| Leandri et al (2009)65 | Stabilometry | Comparison of differences with EC and between measures with EO and EC | Vision EC and Romberg ratio (comparison of EO and EC conditions) | ANOVA | EC: Significant difference in all variables with EC (P < .01) | +/- |
| 1. COP AP sway (mm) | Romberg ratio: | |||||
| 2. COP ML sway (mm) | Significant difference COP AP sway and COP ellipse area (P < .01) | |||||
| 3. COP ellipse area (mm2) | No significant difference in COP ML sway (P = .46) | |||||
| Mignardot et al (2014)67 | Force platform (BioRescue) | AP COP velocity (AAMV) (mm·s−1) | Vision (EC) | MANCOVA | Significant difference (P < .05) | + |
| Suttanon et al (2012)71 | NeuroCom Balance Master | Upright stance (mCTSIB) | Vision (EC on firm and foam surfaces) | Mann-Whitney U test | Significant difference for EC on firm surface (P = .04) and for EC on foam surface (P < .01) | + |
| Sway (°/s) | ||||||
AD = Alzheimer disease; ADAS-cog = Alzheimer's Disease Assessment Scale–Cognitive subscale; ADF = Alzheimer disease fall group; ANOVA = analysis of variance; AP = anterior-posterior; CDR = Clinical Dementia Rating: C1 = condition 1, C2 = condition 2, C3 = condition 3, C4 = condition 4, C5 = condition 5, C6 = condition 6; COM = center of mass; COP = center of pressure; DT = dual task; EO = eyes open; EC = eyes closed; IS = incongruent surface; IV = incongruent visual; MANCOVA = multivariate analysis of covariance; ML = medial-lateral; MMSE = Mini-Mental State Examination; PTP = peak-to-peak; rCBF = regional central blood flow; RMS = root mean square; ST = single task; TUG = ”Timed “Up & Go” Test; RT = reaction time; mCTSIB = modified Clinical Test of Sensory Interaction on Balance; SDAT = senile dementia of the Alzheimer type, AAMV = average absolute maximal velocity.
+ = significant correlation/significant differences, - = no correlation/no significant differences, +/- = mixed result.
Quality
The quality of the 18 studies is shown in Table 1. Two studies67,69 had high quality, ranging from 78% to 83% of the total score, whereas the other 16 studies21,55–66,68,70,71 had moderate quality, ranging from 50% to 72% of the total score. Only 4 studies21,60,67,69 provided findings with adequate adjustment for confounding in the analyses. Nine moderate-quality studies21,55,59,62,63,65,66,68,71 lost scores due to unclear reporting of participant recruitment and selection.
Research Question 1
Seventeen studies met the inclusion and exclusion criteria to answer research question 1. These results were separated into 2 sections: laboratory-based studies (Tab. 3) and clinically based studies (Tab. 4). Of these 17 studies, only 1 study71 used both laboratory- and clinically based outcome measures.
Laboratory-based measures. he static postural stability of participants with mild to moderate AD was shown to be significantly reduced compared with healthy peers (6 studies) for the following measurements: center-of-pressure average absolute maximal velocity in an anterior-posterior direction,67 percent equilibrium,58 center-of-pressure position-based variables,65,66 root mean square,68 and sway velocity.71 One of these studies67 was rated of high quality, and the other 5 studies58,65,66,68,71 were of moderate quality. No significant differences were found in 5 moderate-quality studies for peak-to-peak center-of-mass sway amplitude,57 center-of-gravity movement velocity,58 center-of-mass–based measurement,59,61 and center-of-pressure–based measurement.55
Dynamic postural stability measured by maximum excursion of limits of stability, percentage of limits of stability directional control,71 and percent equilibrium was found to be significantly different.58 No statistically significant difference was found between people with mild to moderate AD and healthy peers for measures of peak-to-peak center-of-mass sway amplitude,57 center-of-gravity movement velocity (eyes open, support on incongruent surface),58 center-of-pressure–based variables,61 center-of-mass displacement,59 and movement velocity.71 These were moderate-quality studies.
Functional dynamic postural stability was measured in only one laboratory study71 and was not significantly different between groups as measured by the functional test of sit-to-stand sway velocity on the NeuroCom Balance Master.
Clinically based measures. Table 4 reports the results of the 8 clinically based postural stability tests.21,60,62–64,69–71 All tests were measured with eyes open and on a flat surface. Static balance was significantly different in 2 moderate-quality studies measured by tandem stance62 and single-leg stance.64
Dynamic postural stability was significantly reduced in older adults with mild to moderate AD compared with healthy peers for the Functional Reach Test and Step Test in one moderate-quality study.71
Functional performance of postural stability for participants with mild to moderate AD was significantly reduced compared with healthy peers for the measures of Performance-Oriented Mobility Assessment,21 Berg Balance Scale,63,70 parametric rating scale for equilibrium and limb coordination,60 Timed “Up & Go” Test,62,69–71 and figure-of-eight test.70 However, when the Performance-Oriented Mobility Assessment was analyzed based on the level of cognitive impairment, the result showed no significant difference between participants with mild AD and healthy peers.21 One study69 was rated as high quality, and the remaining studies included in this review were of moderate quality. The high-quality study using a clinically based functional measure of postural stability (Berg Balance Scale) was not significantly different between groups.69
Research Question 2
Twelve studies were included that measured the factors affecting postural instability in people with mild to moderate AD (Tab 5).
Postural stability, measured by root mean square in Romberg stance, was significantly negatively correlated (r = –.5, P < .05) with regional blood flow to the cortex in people with mild AD and to the cortex and frontal lobe in people with moderate AD.68 This study was rated as moderate quality.
Three moderate-quality studies57,61,65 measured the correlation between postural stability and cognitive function, and only the study by Leandri et al65 showed a significant positive correlation (P < .05) between anterior-posterior center of pressure with eyes closed and ADAS-cog orientation score (rs = .7).
Attentional demand in dual-task conditions significantly (P < .05–P ≤ .001) reduced the performance of postural stability in people with mild to moderate AD in 4 studies.55,66,69,71 The variables of postural stability used were center of pressure for static stability and time measured in the Timed “Up & Go” Test for functional stability while undertaking a second task, such as counting backward.55,66,69,71 These studies were all of moderate quality, except the study by Pettersson et al,69 which was rated as high quality.
Motor performance, including muscle activity and latency of muscle response of the lower limb, preparatory postural activity, postural and upper limb reaction times during perturbation or changing position tasks was measured in 2 moderate-quality studies.56,59 Only the measurements of postural and upper limb reaction times were found to be significantly greater (P < .001) in people with AD compared with healthy peers in both 75% and 50% push-and-pull conditions in the study by Elble and Leffler.59
The studies that investigated sensory contribution to postural stability using computerized posturography demonstrated that in the eyes-closed and normal firm surface condition, there were significant between-group differences in 7 postural stability studies for percent equilibrium (P ≤. 01)58; total, maximum, and mediolateral displacement of center of mass (P < .01)61; center-of-pressure position (P < .01)65; center-of-pressure velocity (P < .01)67; and sway in the modified Clinical Test of Sensory Interaction of Balance (P = .04).71 Two studies reported that participants with AD swayed significantly more in the condition of quiet standing with eyes closed on a foam surface and the condition of quiet standing with eyes closed on an incongruent surface measured by percent equilibrium (P ≤. 01–.05)58 and sway (P < .01),71 respectively. No statistically significant difference was found between participants with AD and healthy peers for center-of-gravity movement velocity.58 All 5 studies were rated as being of moderate quality, except the study by Mignardot et al,67 which was of high quality.
Romberg ratio, a measurement of eyes open divided by eyes closed, was significantly different between people with mild to moderate AD and healthy peers in 2 studies, with the measurement of total, maximum, and anterior-posterior displacement during standing on a flat surface; measurement of total and anterior-posterior displacement on backward inclination (P < .01–.05)61; and measurement of center of pressure in anterior-posterior displacement and ellipse area (P < .01).65 Both studies were of moderate quality.
Conversely, in one study,57 significant differences were found during the test of standing on a firm surface with eyes closed and for comparison between eyes closed and eyes open during Romberg stance between groups; that is, healthy peers swaying more than older adults with AD.
Strength of Evidence
Eight studies showed statistically significant findings for 10 different variables of static postural stability, and only 3 studies showed no significant difference. These 8 studies were 1 high-quality study and 7 moderate-quality studies (quality range = 56%–83%). Thus, there is strong evidence that static postural stability is reduced in older adults with mild to moderate AD compared with healthy peers.
Inconsistent findings were found for dynamic postural stability, as only 2 studies showed significant differences (quality = 72%) and 3 studies did not show significant differences (quality range = 61%–73%). Thus, there is weak evidence of dynamic postural stability being reduced in older adults with mild to moderate AD compared with healthy peers.
Five moderate- to high-quality studies demonstrated significant differences (quality range = 56%–78%). Two studies showed no significant differences. Thus, there is strong evidence that functional postural stability is reduced in older adults with mild to moderate AD compared with healthy peers.
There was strong evidence for 2 factors contributing to postural instability in older adult with AD: attentional demand and vision (standing with eyes closed on a firm surface). Attentional demand during dual-task activity was positively associated with postural instability in 1 high-quality study and 3 moderate-quality studies (quality range = 61%–78%), whereas postural stability performance, measured in standing with eyes closed on a firm surface, was significantly different in 1 high-quality study and 4 moderate-quality studies (quality range = 56%–78%).
There was weak evidence for other factors, including brain pathology, cognitive function, and motor performance, as either there was only 1 study evaluating a similar contributing factor or there were fewer than 3 studies that showed consistency with statistically significant differences when comparing between people with mild to moderate cognitive impairment and healthy peers.
Discussion
This systematic review aimed to explore postural stability in people with mild to moderate AD and contributing factors to postural instability compared with healthy peers. Results show that people aged 50 years and above who have been diagnosed with mild to moderate AD have reduced static and functional postural stability compared with healthy peers when measured with laboratory and clinical outcome measures. Due to the heterogeneity of variables, population, and study design used by studies to measure postural instability, meta-analysis of data was not possible.
Postural instability was significantly associated with attentional demand and decreased visual input. Participants with mild to moderate AD either increased their focus on their postural stability during a measurement test, and thus had more error in the concomitant cognitive task compared with healthy peers, or swayed more while doing a dual cognitive task compared with healthy peers.55,66,71 The reduced ability to focus on both a cognitive task and postural stability increases the risk for falling. Moreover, postural instability increases with the increment of cognitive load.72 During the measurement of postural stability performance with eyes closed and stable platform, older adults with mild to moderate AD rely on their vestibular and somatosensory senses to maintain postural stability.
The environment from which participants were recruited is an important consideration, as it provides context with respect to the findings of this review. In one study,68 participants with mild to moderate AD were inpatients from a hospital, and 2 studies58,66 involved participants who were recruited from the community and long-term care or nursing home facilities. Not unexpectedly, participants with mild to moderate AD had lower functional ability and poorer postural stability compared with those living in the community. The incidence of falling in nursing homes has been reported to be as high as 1.5 per person per year, with the range of 0.2 to 3.6 falls per year, primarily due to multifactorial reasons.73 It might be that people who are more frail have greater postural instability than people with mild to moderate AD who are still living in the community.
Some of the inconsistent findings of this review may be due to the heterogeneity of the participants with mild to moderate AD. For instance, the duration of participants having mild to moderate AD was reported in only 4 studies (range = 1.8–6 years of illness).21,61,65,68 In the study by Nakamura et al,68 the researchers grouped the participants with mild to moderate AD into 2 groups: mild cognitive impairment (mean MMSE score = 18.6, SD = 1.7) with a duration of illness of 2 years and moderate cognitive impairment (mean MMSE score = 11.4, SD = 2.6) with a duration of illness of 4 years. Consideration of illness duration is important, as a decline of cognitive function occurs over time; disease progresses as people with AD age.6 People who have lived with mild to moderate AD for a long duration may have reduced postural stability compared with those who have more recently been diagnosed with AD. Moreover, MMSE is influenced by education; therefore, higher level of education might conceal the cognitive impairment.74,75 In the study by Leandri et al,65 all participants with AD had at least 8 years of education, which was categorized as “high level of education”76; however, there was unclear information with regard to the severity of cognitive impairment.
Moreover, the studies that utilized the MMSE used different cutoff points to classify mild cognitive impairment. For instance, participants in the studies by Pettersson and colleagues69,70 who had scored more than 27/30 were classified as having mild cognitive impairment, whereas other studies77,78 used the specific cutoff point of 27/30 for normal cognition, especially for participants who were highly educated. Therefore, although our aim was to explore factors affecting postural sway in people with mild to moderate cognitive impairment, there were studies that classified the same value as normal cognition, whereas other studies categorized it as mild cognitive impairment. This is a limitation of our study, and consensus on the cutoff points for each impairment level would help to mitigate this issue.
The MMSE was used widely by the studies included in this review, possibly because it is an easy screening tool that identifies a level of cognitive impairment. However, the MMSE does not determine the cause of the underlying conditions (ie, it does not provide a diagnosis).79 Further evaluation by specific diagnostic tests would be necessary to confirm the underlying condition causing the mild to moderate cognitive impairment. Therefore, in one of the studies,80 although a mild to moderate cognitive impairment was present, it is not possible to say that this impairment was due to AD. Consequently, this is also a limitation of this review.
The studies in our review typically used the DSM-III and DSM-IV when a diagnosis of AD was given.55,61,65–70 The Diagnostic and Statistical Manual for Mental Disorders, Fifth Edition (DSM-V), however, is the latest edition published by the American Psychiatric Association. This edition presents criteria to identify the pre-dementia stage of cognitive impairment included within mild neurocognitive disorders.81 These new criteria were developed because there were concerns with the classification of the initial phase of cognitive disorders, which may lead to major neurocognitive disorders (ie, comparable to a diagnosis of dementia). These criteria could strengthen the validity of classifying people as having mild to moderate cognitive impairment, especially when initially measured by the MMSE.
The presence of neurological symptoms other than mild to moderate AD also may influence stability. Postural instability was found to be high in participants with mild to moderate AD compared with healthy peers in 4 studies that excluded people who had extrapyramidal presentations.60,65,70,71 However, 3 studies56–58 showed that people with mild to moderate AD who did not have extrapyramidal presentations had similar postural stability performance as healthy peers. The similar performance of postural stability between participants with mild to moderate AD and healthy peers in these 3 studies could be due to small sample size (n = 25,56 n = 23,57 and n = 2258). In the study by Nakamura et al,68 2 participants with mild AD (n = 2/15) and 7 participants with moderate AD (n = 7/15) had an extrapyramidal presentation, whereas others did not. This study showed high postural instability in the participants with mild to moderate AD, which suggests that postural instability was being influenced by the presence of extrapyramidal signs. Interestingly, extrapyramidal signs are reported to have a high prevalence in older adults with parkinsonism who also might develop AD in the latter stages, with a characteristic of postural instability.8
Twelve studies21,58–63,65,66,68,70,71 included participants who were age matched (< 5 years difference) with healthy peers. In 4 studies,56,64,67,69 there were age differences of more than 10 years between groups, with participants classified as having mild to moderate AD being older than healthy peers. Three studies64,67,69 showed high postural instability in people with mild to moderate AD compared with healthy peers. Previous studies82–85 have shown that the magnitude of change in postural stability is highly influenced by age (ie, the older the person, the greater postural instability appears to be). Therefore, if the unmatched control group is significantly younger, any postural instability differences observed will be inflated.
In 4 studies,21,59,63,67 the control group was reported to have one or more medical problems, such as hypertension and diabetes, and these conditions could have affected their postural stability and thus the findings of this review. Admittedly, recruiting adults with no underlying medical conditions and of a comparable age to the participants with mild to moderate AD is logistically difficult. However, it is possible that this factor influenced the outcomes of these studies’ respective results and, in particular, the reported “non-difference” results.
Factors such as duration of illnesses, severity of cognitive decline, age, and the presence of neurological and medical problems were rarely controlled for and thus potentially confound the findings of this review. Confounders are the characteristics that could change the estimate of the final results.86 We acknowledge that collecting data from a cognitively challenged population is difficult, yet controlling for factors known to confound results is considered to be important for the correct interpretation of findings.
Interpreting the results of this review was challenging for 2 reasons. There is a lack of consensus in the variables chosen to measure postural stability among the researchers, which meant that a meta-analysis could not be undertaken. A consensus statement to standardize measures of postural stability, therefore, is recommended. Furthermore, there is limited evidence to demonstrate the robustness of some outcomes to measure specific variables. For example, only Mignardot et al67 described the accuracy of the center-of-pressure velocity variable, which was chosen as the primary outcome to differentiate changes in postural stability in people with mild to moderate AD.87 These authors also explored the usefulness of center-of-pressure velocity-based variables in people with mild to moderate AD prior to their observational study.87 Mignardot et al67 found that center-of-pressure velocity was an excellent variable to compare the differences of postural stability between individuals with mild to moderate AD and mild to moderate cognitive impairment and healthy peers in regard to visual condition, age, and cognitive function. The previous studies also demonstrated the accuracy of velocity-based variables to measure the performance of postural stability.88,89 The accuracy of velocity information may be attributable to the proprioception, tactile, and visual systems, all of which are influenced by velocity.88,89 Furthermore, one study71 showed that sway velocity was more altered and could discriminate the differences in individuals with mild-to moderate AD compared with cognitively healthy peers.
This review shows that many outcome measures have been used to evaluate postural stability in people with mild to moderate AD (Tabs. 3 and 4). However, only 9 studies55–57,59–61,67,68,71 reported the validity and reliability of these measures for this population and explicitly explained the protocol of the postural stability testing. For example, in a study by Suttanon et al,71 the researchers validated the tests for postural stability in older adults with mild to moderate AD. Suttanon et al37 investigated test-retest reliability of the modified Clinical Test of Sensory Interaction on Balance, limits of stability using NeuroCom Balance Master, Functional Reach Test, Step Test, and Timed “Up & Go” Test and found fair to excellent reliability of all measures. In a study by Franssen et al,60 the clinical instrument parametric rating scale for equilibrium and limb coordination used to measure postural stability was new, and intrarater reliability of the measure was conducted within the same study and showed significant correlation in each of the items scored by the same examiner. The remaining 9 studies reported only that the instruments are validated for an older adult population. Therefore, although we found strong evidence for static and functional postural instability in participants with mild to moderate AD and for attentional demand and vision as factors associated with postural instability, there was a paucity of data demonstrating the validity of outcome measures (eg, SMART Balance Master, stabilometry, force platform [Techno Concept], Performance-Oriented Mobility Assessment).90,91 If outcome measures that have not been validated are used, the level of impairment on the construct of interest (ie, balance) remains uncertain. However, there is currently no gold standard outcome measure to evaluate postural stability in this population. Thus, more work is needed to establish consensus on which are the measures of most promise and thus gold standard, and then to evaluate the psychometric properties of each of these measures in older adults with mild to moderate AD.
In conclusion, this systematic review of the literature was performed to elucidate postural instability and the factors associated with postural instability in older adults with mild to moderate AD. This review showed strong evidence that static and functional postural stability are reduced in people with mild to moderate AD compared with healthy peers. There was strong evidence that postural instability was associated with increasing attentional demand (dual task) and the availability of visual input. Included studies typically had a small sample size (< 20 participants), and only 2 studies were rated as high quality with low risk of bias. Only 12 studies have identified and quantified factors associated with postural instability in this population; therefore, there is a need for further research in this area. Consensus on outcome measure values for classifying normal cognition, mild and moderate cognitive impairment, and the primary variables of interest for measuring postural instability in older adults with mild to moderate AD is needed to enable pooling of data in the future. The DSM-V, the new criteria for dementia, should be used in the diagnosis phase to classify people with mild to moderate cognitive impairment in addition to major neurocognitive disorders. Furthermore, research to determine the psychometric properties of the primary outcome measure for each variable in this specific population is necessary, yet there is currently no gold standard outcome measure to evaluate postural stability in this population. Thus, these limitations suggest that the synthesis of results from this review should be treated cautiously. Until consensus regarding a gold standard measure is reached, the degree of postural instability in this population and contributory factors that may be amenable to intervention will remain unclear.
Author Contributions
Concept/idea/research design: N. Mesbah, M. Perry, K.D. Hill, L. Hale
Writing: N. Mesbah, M. Perry, K.D. Hill, L. Hale
Data collection: N. Mesbah, M. Kaur
Data analysis: N. Mesbah, M. Perry, L. Hale
Project management: N. Mesbah
Clerical/secretarial support: N. Mesbah
Consultation (including review of manuscript before submitting): M. Perry, K.D. Hill, L. Hale
The authors acknowledge Richard German, Divisional Librarian, and Trish Leishman, Subject Librarian, University of Otago, for assistance in developing the search strategy for this systematic review.
Funding and Disclosures
This research is part of a doctoral study funded by the School of Physiotherapy, University of Otago. Ms Mesbah received a scholarship from the Ministry of Education, Malaysia, during the study period. The authors state no conflicts of interest.
References
Author notes
[Mesbah N, Perry M, Hill KD, et al. Postural stability in older adults with Alzheimer disease. Phys Ther. 2017;97:–1]

Comments