


Abstract
This paper examines apparent fraud among securitized nonagency loans using three indicators: unreported second liens, owner occupancy misreporting, and appraisal overstatements. We find that around 48% of loans exhibited at least one indicator of misrepresentation. Surprisingly, misreporting is similar in both low and full documentation loans and is associated with a 51% higher likelihood of delinquency. Two-thirds of loans with unreported second liens had the same originator issuing both the first and second lien. Misrepresentations in MBS pools can explain substantial cross-sectional differences in future losses. Losses were predictable and initiating from apparent fraud by MBS underwriters and loan originators.
Received August 24, 2015; accepted September 11, 2015 by Editor Matthew Spiegel.
At the heart of the recent financial crisis was an extremely rapid deterioration in the value of nonagency mortgage-backed securities (MBS) and collateralized debt obligations (CDO), derived from MBS. To fully understand the crisis, one needs to thoroughly understand the nature and incentives of the collateral that later underpinned many types of structured products. Mortgage fraud is a subject of interest to the financial press. However, it is very difficult to determine if cases in the news, prosecuted cases, and/or settlements are rare events or indicative of widespread patterns, and who are the responsible parties. This paper fills these voids by examining the role that borrowers, appraisers, originators, and MBS underwriters may have played in three different types of mortgage misrepresentations and their effects on MBS losses.
A matching algorithm allows us to link large data sets of nonagency MBS loan data from 2002 to 2007 with county-level transaction information and perform loan monitoring along three dimensions. First, we examine the prevalence of loans recorded in MBS loan-level data as having only a first lien, yet when matched to county-level information show a second-lien loan issued together (on the same day) with the first-lien loan. Second, we examine cases in which loan-level MBS data indicate that a house is owner occupied, but county-level data show that the tax records are sent to a different, nonbusiness address. Third, we examine the extent to which appraisal values are overstated using an industry-leading automated valuation model (AVM) that provides a statistical valuation for a house at the time of loan origination.
We find that 13.4% of loans reported as having no second lien (10.2% of all loans) do have a second lien. Approximately 7.7% of loans marked as owner occupied (6.7% of all loans) may not be owner occupied. Further, 44.9% of homes have appraisals that are 5% higher than an industry-leading AVM. Even though we only examine three forms of potential misreporting, our overall frequency of misreporting across all three dimensions is 48.8%.1 Aggregate misreporting frequencies are similar for low and full documentation loans, suggesting that misreporting is not simply due to lack of information disclosure. We also find that loans with an unreported second lien, occupancy status misreporting, or appraisal overstatement indicator are 97%, 8%, and 34% more likely to become delinquent than loans with no misreporting indicator. The findings are robust to using a measure of direct default and to the inclusion of core-based statistical area (CBSA)-origination quarter fixed effects and many other loan-level controls, indicating that our results are not simply explained by geographic patterns or loan characteristics.
Next, we examine the role of borrowers, appraisers, originators, and MBS underwriters in misreporting. In more than two-thirds of the cases of unreported second liens, the same originator issued the first and second liens on the same day, indicating that originators were aware of the second lien. Loans with unreported second liens were originated with interest rates similar to those of first-lien loans with correctly reported second liens, further indicating that originators were seemingly aware of and accounted for the second-lien risk. We find that the fraction of unreported second liens jumps around securitization thresholds, which suggests that originators misreported second liens with the intention of ultimate loan securitization. We examine the possibility that loan originators accurately reported second-lien data to underwriters, who later omitted this information at issuance. However, in explaining unreported second liens, both originator and underwriter fixed effects are economically important.
Owner occupancy misreporting is not accompanied by a materially higher interest rate, indicating that originators may have been largely unaware of buyers' intended usage of the property. Loans with inflated appraisal values sold with some premium, indicating that loan originators viewed these loans as riskier. For the most part, owner occupancy and appraisal overstatement misreporting do not change around securitization thresholds or vary much across originators, indicating that these practices were not driven by securitization.
In contrast, second-lien misreporting varies considerably across originators, whether standalone or as part of a large corporation. Originators with high levels of second-lien misreporting also have abnormally poor loan performance even after controlling for the individual loan-level misrepresentation indicators. This suggests that our indicators are not capturing the full extent of fraud or some other aspect of origination practices that is correlated with mortgage misreporting. The prevalence of misreporting by originator and originator loan performance are fairly persistent over time. Second-lien misreporting increases from 2002 to 2005, primarily due to a gain in market share by originators that exhibited similarly high levels of second-lien misreporting even back in 2002. Second-lien misreporting plummets in early 2007 as originators with the highest levels of second-lien misreporting go out of business.
The strong relation between the appraisal indicator and future delinquency indicates that the AVM statistical model is substantially more accurate than most appraisers, but does not speak to whether the poor appraiser performance was due to random appraiser error or appraisers catering to loan officers. To examine these differences, we focus on refinances, where the value of the transaction is set purely by the appraisal. Appraisal overstatement is 74% more likely to occur on refinances than on purchases. Moreover, 49% of appraisals used for refinance cluster exactly on loan-to-value ratios in five-unit increments. This could be due to either appraisers targeting the amounts that loan officers wish to lend, or lenders setting loan amounts relative to the appraisals. Consistent with appraisers targeting numbers from loan officers, the clusters at round-number thresholds have consistently higher levels of appraisal overstatements and higher future delinquency rates as shown in panels A through C of Figure 4. The evidence demonstrates that appraisers largely target numbers from loan officers and that this leads to significantly higher future loan losses.
The evidence that loan originators were likely aware of second-lien misrepresentation raises the question of what bank underwriters knew. Monitoring services, such as Clayton Holdings, provided loan monitoring for a sample of loans for each individual MBS. These monitoring services list the three types of misreporting that we study, among others. This suggests that MBS underwriting banks knew that some of the MBS representations at issuance were incorrect. Thus, extremely poor MBS performance was not just a function of disclosure or bad luck; some information available before MBS issuance predicted their future demise.
Our paper adds to a growing literature examining mortgage misreporting that finds evidence typically for one measure in a particular county or bank (Ben-David 2011; Jiang, Nelson, and Vytlacil 2014; Garmaise 2015; Carrillo 2013).2 In a parallel study, Piskorski et al. (2015) use credit bureau data together with loan-level data from 2005 to 2007 to show that around 10% of nonagency loans exhibit owner occupancy and second-lien misreporting, which is later associated with a 60% higher probability of default, yet misreporting was not reflected in MBS pricing or subordination. The higher aggregate levels of misreporting that we find is explained by our inclusion of appraisal overstatements.3 It is comforting that although the papers use entirely different data sources, they reach similar conclusions concerning the existence of large-scale misreporting and its effects on loan performance. Piskorski et al. (2015) show that the effects of misreporting are not reflected in MBS pricing or subordination and yet misrepresentation is harmful to all rating classes, even senior tranches. Our combined inferences suggest that MBS investors were unaware of, yet adversely affected by, misrepresentation.
Drafts of our paper were posted online in April 2013 and pre-date any of the large Department of Justice (DOJ) settlements. Although all large banks in our sample also had large levels of apparent fraud, the ten banks with the most misreporting with our indicators are Barclays, JP Morgan, Morgan Stanley, Merrill Lynch, Lehman Brothers, HSBC, Deutsche Bank, Nomura Securities, Goldman Sachs, and Bank of America. Our findings provide detailed evidence that the large DOJ settlements with some of these banks are definitely justified and not an unjust shakedown as some pundits have suggested.4 They also suggest that more DOJ settlements should occur.
In addition to shedding light on the nonagency loan market, our paper is related to a large literature on problems in structured finance in the period prior to the recent crisis. Explanations for the extremely poor loan performance include a decrease in loan quality (Demyanyk and Van Hemert 2011) or a decrease in housing prices (Mayer, Pence, and Sherlund 2009), and poor incentives tied to the “originate-to-distribute” model (Keys et al. 2010; Purnanandam 2011; Keys, Seru, and Vig 2012). Our findings show that the loan-level problems were much greater than previously recognized. Ashcraft et al. (2010) show that residential mortgage-backed securities (RMBS) subordination standards deteriorated from 2005 to 2007. For CDOs, Griffin and Tang (2012) and Griffin et al. (2013) show that rating agencies issued inflated ratings, adjusted credit rating models upwards from 2004 to 2007, and sought to match their competitors' ratings to please issuers. Additionally, second liens, owner occupancy, and loan-to-value are key inputs in credit rating models, and rating agencies seemed to have accepted bank loan-level data as without verification. If investors were purchasing based on rating agency and investment bank certification, then there would be a strong incentive for underwriters to misreport. Together these findings suggest that there is considerable private information across deals and challenge the view that the crisis was a completely random event unrelated to structuring incentives. Following on this line of examination, in Griffin and Maturana (2016) analyze to what extent the fraud documented here caused differential patterns in house price inflation.
1. Mortgage Fraud, Data, and Measures
1.1 Mortgage fraud
Fraud refers to financial misrepresentation with the intent to deceive. The FBI distinguishes between two types of mortgage fraud: (1) fraud for property/housing, and (2) fraud for profit (Federal Bureau of Investigation 2011). The first type consists of misreporting by the borrower in order to obtain funding to purchase a primary property. The second type involves more sophisticated schemes to obtain illicit monetary gains from property sales. Methods to facilitate fraud include inflated appraisals, occupancy status misreporting, unreported second liens, property flipping, and falsification of the borrower's financial information, such as bank statements, tax return documents, income, assets, and liabilities. The three indicators of potential misrepresentation that we focus on are unreported second liens (often referred to as “silent seconds”), owner occupancy misreporting, and appraisal overstatements. We focus on these indicators because (1) they can be constructed on a large scale from available data, (2) they are commonly discussed forms of misrepresentation, and (3) they are used by firms in the loan monitoring industry (such as Clayton). We call these variables “indicators” because while they are constructed to identify loans associated with misrepresentation or fraud, they may capture loans that appear suspicious but have a legitimate justification.
Ultimately, whether a fraud indicator captures actual misrepresentation is an empirical question. In the first part of our analysis, we focus on misreporting without looking at which of the relevant parties are responsible. We then analyze the information that may have been known by buyers, appraisers, mortgage originators, and MBS underwriters. All of our indicators are constructed with information from public records on the closing date of the transaction, which means that in most cases, with the proper identifying information that were available to originators and underwriters, our indicators could have been constructed prior to MBS origination. Since the misreporting also has the profit-making motives of intent, and the facts suggest that the relevant parties had information to be sufficiently aware of the misreporting, fraud seems the more accurate, but less politically correct wording.
1.2 Data
The data for this study come from four main sources: Lewtan's ABSNet Loan and HomeVal data sets, along with DataQuick's Assessor and History files. The Lewtan data sets provide loan-level and home valuation information, and DataQuick provides house characteristic and transaction information. Lewtan is an industry leader in providing performance metrics and origination information on the mortgage loans that back U.S. nonagency MBS. Lewtan compiles and cleans loan-level information as reported in nonagency MBS raw servicer/trustee loan-level data tapes, like the one available in free writing prospectus documents. Lewtan's ABSNet Loan contains information about more than 18 million residential loans issued for the purchase or refinancing of properties between January 2002 and December 2011 and provides origination information, such as the appraised value of the property, the documentation provided by the borrower, the purpose of the property as reported by the borrower (owner occupied, second home, or investment), the loan amount, the loan-to-value ratio, the interest rate, the credit score of the borrower, and the origination date. Additionally, the database provides the payment history for each loan and other metrics. HomeVal, in contrast, provides home valuations at the time of origination based on Lewtan's ABSNet proprietary AVM. The AVM is developed by Collateral Analytics, a firm that specializes in AVM models and mortgage risk tools.5
DataQuick is one of the largest providers of real estate data in the United States. DataQuick's Assessor file holds detailed information on residential properties as registered from county assessors. In turn, the history file records more than 175 million transactions from January 2002 to December 2011, involving almost 62 million properties from the assessor file. The history file gives information on the transfer date of the property, the identities of the buyer and seller, the mailing address of the buyer, and the various loans involved in the transaction, among other information.
1.3 Merging process
The identity of the buyer and the property address are available in DataQuick, but not in ABSNet, which only provides the ZIP code. Since erroneous matching can lead to overstating misrepresented loans, we take a conservative approach and perform extensive diagnostics on our matching procedure.
Residential loans are matched with transactions according to their ZIP code, loan amount, interest rate type (fixed- or adjustable-rate mortgage), loan type (conventional, Federal Housing Administration (FHA), or veteran), originator, and purpose of transaction (refinance or purchase). Additionally, the transfer date is required to be within a [−15, 30]-day interval around the loan origination date, and the differences in transaction prices, when available, are required to be within $1,000. We only consider a transaction-loan pair a match when it is unique.
The algorithm matches 34.6% of the first liens with an initial loan amount over $30k in ABSNet. We compare characteristics between matched and unmatched loans and find that both samples are quite similar. In terms of geographic distribution, we obtain a higher matching rate in California and Florida, which are the most important states in our sample in terms of number of loan originations. These results, along with a detailed evaluation of the matching procedure and a description of the sample selection process, are available in the Internet Appendix.
1.4 Sample description
Table 1, panels A through C, provides a description of the main sample. After applying the filters above, we end with a sample of 3,143,755 loans.6 The median loan amount is $234k; the median LTV is 80%; and the median credit score is 675. The sample consists of 16.4% prime loans, 47.6% subprime loans, and 36% Alt-A, negative amortization, or scratch-and-dent loans. Additionally, 87% of the loans are reported as owner occupied, with the remaining reported as investments or second homes. The proportion of loans with an adjustable rate is 67.4%, and the remaining have a fixed rate. Low/no documentation loans comprise 55.8% of the sample, and full documentation loans comprise 44.2%. With respect to loan performance, 33.1% of the sample loans became seriously delinquent (past due 90 days or more), while 26.1% entered foreclosure before July 2012; 8.2% of the loans entered foreclosure with the borrower not making any payment between the first payment that was missed and the foreclosure date (direct default), and 2.2% of the loans entered early delinquency, meaning that the loan became seriously delinquent within six months of the first payment date.
Sample and variable description
| Panel A: Loan characteristics | |||
|---|---|---|---|
| Mean | Median | SD | |
| Original loan amount | 292,721.6 | 234,000.0 | 203,532.1 |
| Loan-to-value | 76.7 | 80.0 | 13.0 |
| Combined loan-to-value | 79.8 | 80.0 | 14.9 |
| Credit score | 671.5 | 675.0 | 73.6 |
| Original interest rate | 6.6 | 6.7 | 2.2 |
| Panel B: Distribution by characteristics (%) | |||
|---|---|---|---|
| Asset type | Documentation type | ||
| Prime | 16.4 | low/no | 55.8 |
| Subprime | 47.6 | full | 44.2 |
| Alt-A, NegArm, other | 36.0 | other/unreported | - |
| Loan purpose | Reported occupancy status | ||
| purchase | 43.8 | owner occupied | 87.0 |
| refinance | 56.2 | investment/second home | 13.0 |
| Interest rate type | Prepayment penalty | ||
| adjustable | 67.4 | no | 38.4 |
| fixed | 32.6 | yes | 61.6 |
| Panel C: Loan performance (%) | |||
|---|---|---|---|
| delinquent | 33.1 | direct default | 8.2 |
| foreclosure | 26.1 | early delinquency | 2.2 |
| Number of loans | 3,143,755 | ||
| Panel C: Loan performance (%) | |||
|---|---|---|---|
| delinquent | 33.1 | direct default | 8.2 |
| foreclosure | 26.1 | early delinquency | 2.2 |
| Number of loans | 3,143,755 | ||
This table presents descriptive statistics for the main sample. The sample consists of ABSNet-DataQuick-matched securitized first-lien loans used for the purchase of a home with an initial loan amount over $30k and a loan-to-value (LTV) ratio less than or equal to 103%. We drop loans associated with the largest 1% of the transactions in each state, loans reported as being for homes having more than one unit, and loans that belong to MBS deals in which all mortgages are recorded to have an LTV equal to their combined LTV. Panel A presents descriptive statistics for the loan characteristics. Panel B presents the sample distribution by loan characteristic. Panel C describes loan performance.
2. Misrepresentation Indicators and Summary Statistics
2.1 Unreported second lien
A second lien allows a borrower to take additional debt, giving the borrower less incentive to repay the loans and making the initial debt riskier. Therefore, to evaluate the risk of a first-lien loan, it is important to know whether the borrower has a second lien. Accordingly, we construct the dummy variable Unreported second, which takes the value of one if the loan in ABSNet associated with the transaction does not disclose a second lien (i.e., LTV = combined LTV) but both a first and second lien are recorded in county-level records as captured by DataQuick. To be flagged as potentially misreported, we also conservatively require the LTV of the first lien to be greater than or equal to 80%.
2.2 Occupancy misreporting
Borrowers who own and occupy a property are less likely to default than borrowers who do not occupy the property. Consequently, originators charge lower interest rates and require smaller down payments for owner occupants. This gives borrowers and/or originators the incentive to misreport occupancy status.
We are able to estimate occupancy status from county-level transactions using the DataQuick database. We compare the mailing address (where the county sends the tax bill) to the purchased property address. If the mailing address differs from the property address, then we take the property to be a second home or an investment property. Some people might have their taxes sent to their business address or a post office box, so we additionally require that the mailing address not correspond to a commercial address or a PO Box. The variable Occupancy misreporting takes the value of one if the self-reported occupancy status associated with the loan in ABSNet is “owner occupied,” but we estimate otherwise from DataQuick's county-level data. Since owner occupancy status is based on where the purchaser files to have their first tax bill sent, the measure may capture purchasers who later become owner occupants. Piskorski et al. (2015) use credit data that note where a person is having their bills sent. They define a house as nonowner occupied if bills are never sent to the property in the first 12 months after purchase. Their measure is 86% as large as our measure over their sample period, indicating that a limitation of our owner occupancy measure is that it likely captures a small set of late movers who do not occupy the home immediately after purchase but later become owner occupants.
2.3 Appraisal overstatement
If the appraiser gives an inflated appraised value for the property, the borrower can secure a larger loan. If the difference between the appraised value of the property and its fair value is large enough, the borrower can obtain a monetary gain at the expense of the lender by defaulting on the mortgage payments (i.e., misrepresentation for profit). Even if the borrower has no intention to default, the borrower can put less money down (i.e., misrepresentation for housing).
As a proxy for the fair value of a property at the time of origination, we use Lewtan's proprietary AVM.7 In contrast to the two measures above, the AVM originates from models. Both the appraisals and the AVM will have estimation error. Ultimately, it is an empirical question as to whether the appraisals or the AVM is more accurate. If AVMs are more accurate than appraisers, this would suggest that either appraisers made mistakes or appraisals were potentially inflated. Below, we try to separate these two possibilities. Empirically, we show in the Internet Appendix Figure IA. 4 that loan performance considerably deteriorates for appraisals 5% larger than the AVM value. Hence, we use the 5% threshold in some aggregate findings. However, in our more detailed tests that rely upon the measure for other purposes, such as regressions, we use a 20% threshold. We use the higher threshold in subsequent results to account for potential estimation error from the AVM originating from a model, in spite of the findings in the Internet Appendix indicating that this is likely too conservative. We define Misreported as a dummy variable that takes the value of one if one or more of the three misrepresentation indicators is true.
2.4 Summary statistics
The mean values of the misrepresentation indicators defined previously are presented in Table 2. We find that 10.2% of first-lien loans contain a second lien that is not disclosed. This percentage is 13.4% when considered as a fraction of all loans marked with no second lien. The occupancy misreporting indicator appears in 6.7% of the sample. The most common misrepresentation indicator is appraisal overstatements, which appear in 44.9% of loans when using the 5% threshold and in 17.8% of the loans when using the 20% threshold. Aggregating across all indicators, 48.8% of the loans exhibit at least one misreporting indicator (30.1% when using the overly conservative 20% threshold). The correlations between the three misreporting indicators are fairly low (3% on average).
Misreporting variables
| Main sample | Low/no doc | Full doc | Purchase | Refinance | Common sample | |
|---|---|---|---|---|---|---|
| Unreported second | 10.2 | 9.5 | 11.1 | 19.6 | 2.9 | 8.5 |
| Unreported second (from loans reported as having no second lien) | 13.4 | 13.1 | 13.8 | 29.3 | 3.5 | 11.2 |
| Misreported occupancy | 6.7 | 7.2 | 6.0 | 11.7 | 2.6 | 6.0 |
| Misreported occupancy (from loans reported for owner occupancy) | 7.7 | 8.5 | 6.7 | 14.0 | 2.9 | 6.8 |
| Appraisal overstatement | 17.8 | 17.5 | 18.1 | 13.2 | 20.5 | 17.8 |
| Appraisal overstatement (using a 5% threshold) | 44.9 | 44.3 | 45.7 | 36.5 | 49.9 | 43.8 |
| Misreported | 30.1 | 29.6 | 30.6 | 35.9 | 25.6 | 29.3 |
| Misreported (using a 5% threshold) | 48.8 | 48.0 | 49.8 | 47.0 | 50.2 | 51.9 |
This table presents means for the misreporting variables (in percent). We construct three mortgage misreporting indicators to capture unreported second liens, occupancy status misreporting, and appraisal overstatements. Unreported second is a dummy variable that takes the value of one if the loan in ABSNet associated with the transaction does not disclose the existence of a second lien (i.e., LTV = combined LTV) but both a first and a second lien are recorded in county-level records as reflected by DataQuick. Occupancy misreporting is a dummy variable that takes the value of one if the self-reported occupancy status associated with the loan in ABSNet (using data from MBS prospectus documents) is marked as “owner occupied,” but we estimate otherwise from DataQuick's county-level data. Appraisal overstatement is a dummy variable that takes the value of one if the appraised value recorded before origination exceeded ABSNet's AVM value by more than 20%. Misreported is a dummy variable that takes the value of one if one or more of the four misreporting indicators is true.
Appraisals can be understated as well. Nevertheless, as shown in the Internet Appendix, the distribution of appraisal overstatements is neither symmetric nor centered at 0%. Inconsistent with random appraisal errors, we find that 44.9% of the loans show appraisals that are 5% or above the AVM, but only 23.3% of the loans show the AVM being 5% or above the appraised value.8
Additionally, unreported second liens and occupancy misreporting are considerably higher in purchases than in refinances. The opposite is true for appraisal overstatements. This is interesting since appraisals are the sole determinant of the transaction price with refinances. Lenders would also presumably be aware if the house was owner occupied or had a second lien with a refinance. Interestingly, misreporting does not seem to be a simple function of available information at origination. Both unreported second liens and appraisal overstatements are slightly higher in full documentation loans than in low/no documentation loans (1.6% and 0.6% higher, respectively).
Figure 1 shows the evolution of the different misrepresentation indicators by quarter for the period from 2002 to 2007. The prevalence of unreported second liens increases rapidly and peaks about a year before the top of the housing market in the first quarter of 2005. Owner occupancy misreporting appears to gradually decrease from an average of 8.3% in 2002 to an average of 5.1% at the beginning of 2007. Appraisal overstatement varies but remains at high levels throughout the period.
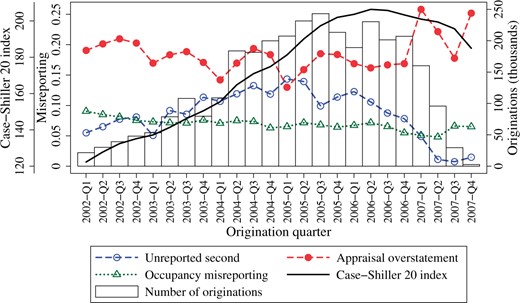
Misreporting indicators by quarter
This figure shows the evolution of the different misreporting indicators by quarter. The indicators Unreported second, Occupancy misreporting, and Appraisal overstatement are defined in Table 2. The bars represent the number of first-lien loan originations in each quarter, and the black line shows the evolution of housing prices as captured by the Case-Shiller 20 Index. The main sample consists of ABSNet-DataQuick-matched securitized first-lien loans used for the purchase or refinance of a home with an initial loan amount over $30k and a loan-to-value (LTV) ratio less than or equal to 103%. We drop loans associated with the largest 1% of the transactions in each state, loans reported as having more than one unit, and loans that belong to MBS deals in which all mortgages are recorded to have an LTV equal to their combined LTV.
In the second and third quarters of 2007, the prevalence of unreported second liens plummets. Since reported second-lien origination stays at a similar high level, the drop is not due to a decline in second-lien origination.
3. Does Misreporting Affect Loan Performance?
In the previous section we present evidence consistent with an extremely large amount of potential misrepresentation. However, our measures need external validation. If the indicators are capturing mortgage misreporting, then the misreported loans should underperform loans that are not affected by misreporting or misrepresentation. In most of our tests we focus on serious delinquencies, followed by direct defaults, as our measure of loan performance.
3.1 Summary analysis
Figure 2 depicts loan performance over the credit score spectrum, separated by low/no documentation loans and full documentation loans. Panel A shows that the delinquency effect is strong for second-lien misreporting. Misreporting is strongly related to delinquencies across all ranges of the credit score distribution, but particularly for low credit scores. The relationship is considerably weaker for occupancy misreporting (panel B). The effect is strong for appraisal overstatements (panel C).
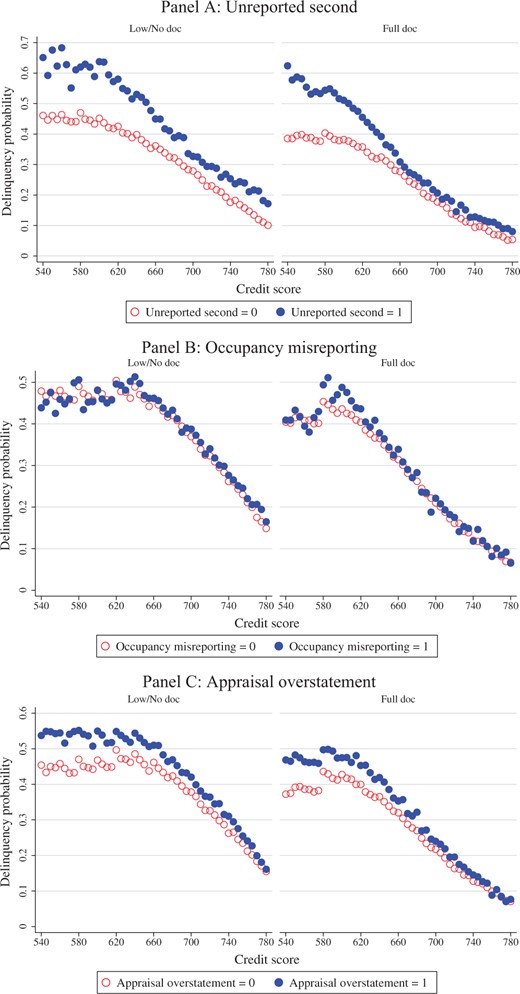
Probability of delinquency by credit score bin
This figure compares the probability of delinquency by credit score bin of loans that exhibit misreporting (solid circles) and loans that do not exhibit misreporting (hollow circles). Each credit score bin has a size of five units. We construct three mortgage misreporting indicators to capture unreported second liens, occupancy status misreporting, and appraisal overstatements (the indicators are defined in Table 2). The comparisons based on unreported second liens, occupancy misreporting, and appraisal overstatements are shown in panels A, B, and C, respectively.
3.2 Regression analysis
We now turn to a more formal framework. We estimate logit regressions in which the dependent variable is the delinquency dummy and the independent variables of interest are the different misreporting indicators. To ensure that our misrepresentation variable is not simply capturing a correlation with some other aspect of loan riskiness, we control for the typical determinants of loan performance found in previous literature (Mayer, Pence, and Sherlund 2009). In addition, we include controls for complex mortgages, the original interest rate (fixed- and adjustable-rate mortgages), reported second liens, and reported occupancy status.9 To allow coefficients to be interpreted more easily, all continuous variables are standardized by subtracting their mean and dividing by their standard deviation. CBSA-quarter fixed effects are included in all specifications to ensure that our variables are not capturing some correlated aspect of regional home price movements. We also cluster standard errors by CBSA-quarter. Results in Table 3, panel A, show the odds ratios and z-statistics (in parentheses) of the regressions when including Unreported second in the set of explanatory variables. After controlling for the strict set of controls and fixed effects, we find that a first lien that has an unreported second lien is 97% more likely to become seriously delinquent than loans that were not misreported. The strong effect on loan performance of our indicator of second-lien misreporting is not driven by loans originated in California or Florida, since the odds ratio remains exactly the same when excluding these two states from the main sample. Panels B and C show that the effect of occupancy misreporting and appraisal overstatements on loan performance is lower than the effect of unreported second liens, though it is still important. Loans that misreport their occupancy status are 8% more likely to become delinquent than truthfully reported loans. The effect of appraisal overstatements is also material. Loans that have appraisals 20% or higher than the AVM at the time of origination are 34% more likely to become delinquent. Results are not driven by loans originated in California or Florida. Panel D presents results when using our aggregate indicator of misreporting. A misreported loan is associated with a 51% higher likelihood of becoming delinquent. The effect of all the misreporting indicators is also economically and statistically significant when analyzing purchases and refinances separately. Finally, using a common sample in which all loans are required to have all three misreporting indicators, the regressions confirm that the misreporting indicator with the most influence on performance is Unreported second, followed by Appraisal overstatement and then Occupancy misreporting. Interestingly, the reported variables are important in predicting delinquencies, demonstrating that not all information in the structured finance space was useless. Tinkering with an indicator that predicts default would be valuable if one were to engage in misreporting.
Effect of misreporting on delinquency
| Panel A: Unreported second | |||||
|---|---|---|---|---|---|
| Main sample | Main sample ex CA, FL | Common sample | Purchases | Refinances | |
| Unreported second | 1.97*** | 1.97*** | 2.13*** | 2.03*** | 1.81*** |
| (50.26) | (46.50) | (54.38) | (39.90) | (40.99) | |
| Reported second | 2.14*** | 2.10*** | 2.06*** | 2.63*** | 1.65*** |
| (90.00) | (61.29) | (88.55) | (72.93) | (59.84) | |
| Controls | yes | yes | yes | yes | yes |
| CBSA × Quarter FE | yes | yes | yes | yes | yes |
| Observations | 3,140,472 | 1,687,283 | 2,306,331 | 1,371,552 | 1,764,505 |
| Pseudo | 0.26 | 0.21 | 0.26 | 0.28 | 0.25 |
| Panel B: Occupancy misreporting | |||||
|---|---|---|---|---|---|
| Occupancy misreporting | 1.08*** | 1.14*** | 1.08*** | 1.06*** | 1.05*** |
| (7.18) | (9.99) | (6.67) | (5.00) | (3.38) | |
| Reported nonowner occupied | 1.15*** | 1.30*** | 1.16*** | 0.93*** | 1.46*** |
| (10.43) | (19.97) | (11.35) | (-3.99) | (30.60) | |
| Controls | yes | yes | yes | yes | yes |
| CBSA × Quarter FE | yes | yes | yes | yes | yes |
| Observations | 2,807,954 | 1,391,821 | 2,306,331 | 1,252,643 | 1,551,027 |
| Pseudo | 0.25 | 0.20 | 0.25 | 0.27 | 0.25 |
| Panel C: Appraisal overstatement | |||||
|---|---|---|---|---|---|
| Appraisal overstatement | 1.34*** | 1.36*** | 1.34*** | 1.50*** | 1.23*** |
| (46.57) | (43.33) | (43.30) | (31.51) | (31.66) | |
| Controls | yes | yes | yes | yes | yes |
| CBSA × Quarter FE | yes | yes | yes | yes | yes |
| Observations | 2,576,423 | 1,334,103 | 2,306,331 | 949,997 | 1,622,278 |
| Pseudo | 0.25 | 0.20 | 0.25 | 0.27 | 0.25 |
| Panel D: Misreported | |||||
|---|---|---|---|---|---|
| Misreported | 1.51*** | 1.53*** | 1.49*** | 1.69*** | 1.30*** |
| (64.50) | (62.09) | (59.57) | (46.33) | (43.59) | |
| Controls | yes | yes | yes | yes | yes |
| CBSA × Quarter FE | yes | yes | yes | yes | yes |
| Observations | 3,141,156 | 1,687,666 | 2,306,331 | 1,371,613 | 1,765,126 |
| Pseudo | 0.25 | 0.21 | 0.26 | 0.28 | 0.25 |
This table presents the odds ratios of logit regressions in which the dependent variable is Delinquent, a dummy variable that takes the value of one if the loan was more than 90 days late. Panels A, B, C, and D show the results for unreported second liens, occupancy status misreporting, appraisal overstatements, and aggregated misreporting, respectively. The variables Unreported second, Occupancy misreporting, Appraisal overstatement, and Misreported are defined in Table 2. The set of controls includes Reported second, a dummy variable that takes the value of one if the loan is reported as having a second lien (i.e., LTV≠ combined LTV), and Reported nonowner occupant, a dummy variable that takes the value of one if the loan is reported to be for an investment property or a second home. Additional controls include controls for low/no doc loans, loans used for refinancing, the borrower's credit score, loan amount, LTV, interest rate at origination, presence of a prepayment penalty, adjustable-rate loans, and complex loans. All continuous variables are standardized by subtracting their means and dividing by their standard deviations. All regressions include core-based statistical area (CBSA) times quarter of origination fixed effects (CBSA × Quarter FE). Standard errors are clustered by CBSA × quarter of origination. The coefficients for all the additional controls are reported in the Internet Appendix. z-statistics are presented in parentheses. , , .
We find similar results when using foreclosures and early delinquencies (as shown in the Internet Appendix) as performance variables.
4. What Is the Role of Borrowers, Appraisers, Lenders, and Underwriters in Misreporting?
In this section we use a variety of empirical methods to examine what we can learn about who seemed to be aware of the misreporting.
4.1 Was misreporting adequately priced by lenders?
If lenders take loan features into account when they set interest rates, then this will suggest that they recognize when loans have a higher level of risk. To test this conjecture, we regress loan interest rate at origination against the misreporting indicators and our strict set of loan level controls and fixed effects. Table 4 reports the coefficient estimates for the variables of interest (t-statistics in parentheses). Panel A shows that second-lien misreporting, which is most prominent and impacts performance the most, is also associated with the largest increase in interest rates (14 bps). This result indicates that lenders knew about undisclosed second-lien loans. Indeed, the interest rate charged is 4 bps larger than that on loans with reported second-lien loans (the difference is statistically significant, with an F-statistic of 25.37). Loans with occupancy misreporting (panel B) are 5 bps higher on average. The interest rate is significantly less than that on loans reported as investments or second homes. Loans that exhibit appraisal overstatements appear to have a slightly higher interest rate at origination on average (7 bps). In summary, we find that lenders detect and internalize unreported second liens, and, to a lesser extent, appraisal overstatements. With respect to occupancy misreporting, it seems to be instigated by buyers, or originating lenders do not require extra compensation for loans associated with owner-occupied purchases that may not be the borrower's primary residence.
Effect of misreporting on the interest rate at origination
| Panel A: Unreported second | |||
|---|---|---|---|
| Main sample | Main sample ex CA, FL | Common sample | |
| Unreported second | 0.14*** | 0.10*** | 0.14*** |
| (19.35) | (11.48) | (15.33) | |
| Reported second | 0.10*** | 0.06*** | 0.09*** |
| (11.31) | (7.72) | (9.81) | |
| Controls | yes | yes | yes |
| CBSA × Quarter FE | yes | yes | yes |
| Observations | 3,140,472 | 1,687,283 | 2,306,331 |
| Adj. | 0.62 | 0.60 | 0.62 |
| Panel B: Occupancy misreporting | |||
|---|---|---|---|
| Occupancy misreporting | 0.05*** | 0.07*** | 0.04*** |
| (9.73) | (11.19) | (8.51) | |
| Reported nonowner occupied | 0.32*** | 0.42*** | 0.32*** |
| (45.54) | (54.41) | (43.51) | |
| Controls | yes | yes | yes |
| CBSA × Quarter FE | yes | yes | yes |
| Observations | 2,807,954 | 1,391,821 | 2,306,331 |
| Adj. | 0.63 | 0.60 | 0.62 |
| Panel C: Appraisal overstatement | |||
|---|---|---|---|
| Appraisal overstatement | 0.07*** | 0.09*** | 0.07*** |
| (25.37) | (23.82) | (23.52) | |
| Controls | yes | yes | yes |
| CBSA × Quarter FE | yes | yes | yes |
| Observations | 2,576,423 | 1,334,103 | 2,306,331 |
| Adj. | 0.62 | 0.60 | 0.62 |
This table presents OLS regressions in which the dependent variable is the interest rate at origination. Panels A, B, and C show the results for unreported second liens, occupancy status misreporting, and appraisal overstatements, respectively. The variables Unreported second, Occupancy misreporting, and Appraisal overstatement are defined in Table 2. The set of controls includes Reported second, a dummy variable that takes the value of one if the loan is reported as having a second lien (i.e., LTV≠ combined LTV), and Reported nonowner occupant, a dummy variable that takes the value of one if the loan is reported to be for investment property or a second home. Additional controls include controls for low/no doc loans, loans used for refinancing, the borrower's credit score, loan amount, LTV, interest rate at origination, presence of a prepayment penalty, adjustable-rate loans, and complex loans. LTV is separated into two components: values of 80 or lower (LTV Low) and values over 80 (LTV High). All continuous variables are standardized by subtracting their means and dividing by their standard deviations. All regressions include core-based statistical area (CBSA) times quarter of origination fixed effects (CBSA × Quarter FE). Standard errors are clustered by CBSA × quarter of origination. The coefficients for all the additional controls are reported in the Internet Appendix. t-statistics are presented in parentheses. , , .
4.2 Did securitization provide incentives to misreport?
If misrepresentation increases around a credit score used for securitization, then the originator may be intentionally or unintentionally facilitating borrowing with improper disclosure to obtain loans with the objective of securitizing. If there is no jump in the amount of misrepresentation around the credit score threshold, then the misrepresentation is unlikely to be a function of the originator screening process.
As background, we find results similar to those of Keys et al. (2010): low/no documentation loans whose associated credit score is slightly over 620 are significantly more likely to be securitized.10Keys et al. (2010) focus on delinquencies around the thresholds, whereas we focus on the amount of potential misrepresentation around the thresholds.
Panel A of Figure 3 displays the results for unreported second liens. Unreported second liens increase significantly in loans with credit scores of 620 compared to loans with a credit score of 619, for both low/no doc and full doc loans. The percentage of unreported second liens increases by 2.5% for low/no doc loans and 7.3% for full doc loans. This result suggests that this type of misreporting derives from the originator's incentives to securitize. We find a small significant increase of 0.8% in the amount of occupancy misreporting only in low/no documentation loans (panel D). We do not find a significant increase in the amount of misreporting for appraisal overstatement (see the Internet Appendix). This evidence suggests that these forms of misreporting are not directly related to the originator's motive to securitize.
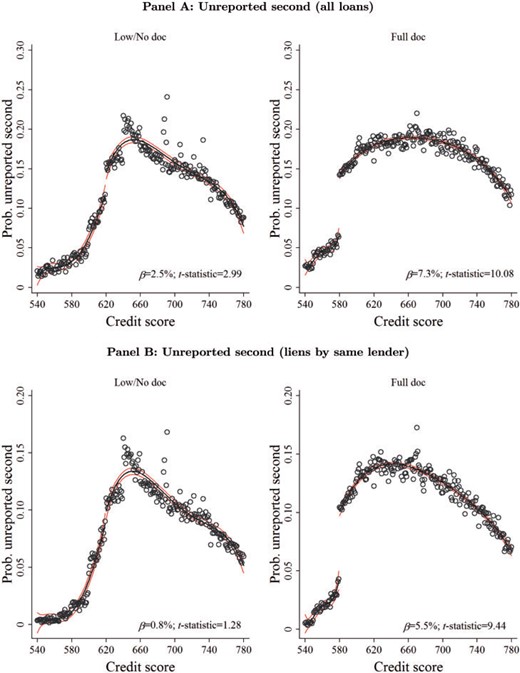
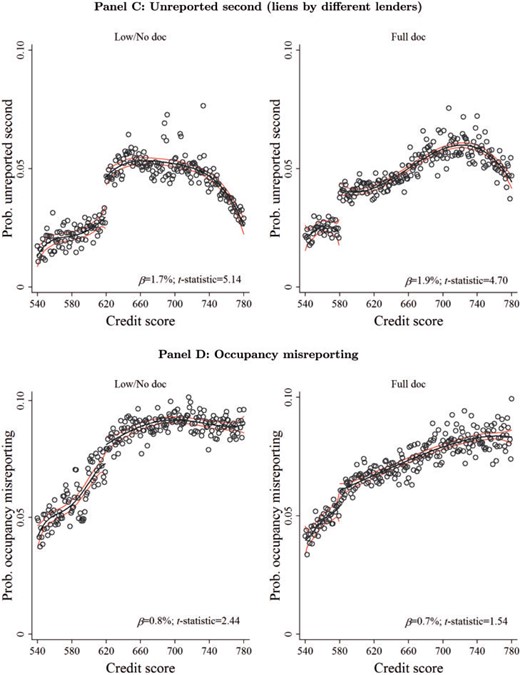
Probability of second-lien and occupancy status misreporting around credit score thresholds
This figure shows the probability of second-lien and occupancy status misreporting by credit score. The hollow circles represent the average probability of misreporting for each credit score. The dark black line fits a fourth-order polynomial approximation at both sides of the credit score threshold (620 for low/no documentation loans and 580 for full documentation loans). The light lines delimit the 95% confidence level interval for the approximation. Panel A considers second-lien misreporting when the first-second lien pair was originated either by the same lender or a different lender (all loans). Panels B and C present results for the decomposition of second-lien misreporting. Specifically, panel B shows the probability of second-lien misreporting when the first-second lien pair was originated by the same lender, and panel C shows the probability of second-lien misreporting when the first-second lien pair was originated by different lenders. Panel D shows results for occupancy misreporting. The exact magnitude of the jumps at the discontinuities () along with their t-statistics are also shown in the graphs. The corresponding regression results are shown in the Internet Appendix.
4.3 Was second-lien misreporting facilitated unintentionally or intentionally?
The jumps in the probability of second-lien misreporting at the credit score threshold in low/no doc and full doc loans suggest that originators facilitated misreporting either unintentionally (lax screening process) or intentionally (misrepresentation). To distinguish between these two possible explanations, we further decompose our unreported second-lien indicator into two components: (1) unreported second liens in which the second lien was originated by the same lender that originated the first lien, and (2) unreported second liens in which the second lien was originated by a different lender than the one that originated the first lien. Of the 10.2% of loans associated with second-lien misreporting in our sample, 67.6% (6.9% /10.2%) consist of cases in which the same lender originated the first-second lien pair. In the remaining cases the first and second liens had different originators. The fact that more than two-thirds of the second-lien misreporting occurs among loans originated by the same lender is surprising. Unless the bank had extremely poor record keeping, the issuer should have known about the second lien. The second-lien misreporting is thus likely due to intentional misreporting, either by the originators or by MBS underwriters who realize the loan has a second lien but do not report this information to investors.
We repeat the RDD analysis discussed above for the two types of second-lien misreporting. Panels B and C of Figure 3 display the discontinuity results for the same originator and different originators. Panel B shows that when the same originator is on both the first and the second lien, there is a misreporting jump of 5.5% (significant at the 1% level) at the credit score threshold of 580. For low/no doc loans, the amount of misreporting increases rapidly beyond the credit score threshold of 620, reaching the same levels present in full doc loans above 580. Nevertheless, because of the scattered loan pools between the 600 and 620 marks, there is no statistically detectable jump in the case of low/no doc loans. Likewise, panel C shows that when different originators issue the first and second liens, there continues to be a significant jump in second-lien misreporting (1.7% for low/no doc loans and 1.9% for full doc loans). These results confirm that second-lien misreporting is due at least in part to the incentives of the lender to securitize the loan.
It remains unclear whether the misreporting is due to the loan originator or the bank underwriter. It could be the case that the originators intended to securitize and reported the second-lien information properly to the bank underwriters, who later did not report it. To shed light on whether the misreporting was driven by loan originators or MBS underwriters, we regress our misreporting indicators on loan originator and underwriter fixed effects. If loan originators contributed more to a certain type of misreporting, then the loan originator fixed effects should be more important in explaining the indicator for that type of misreporting, while if underwriting practices contributed more, then underwriter fixed effects should explain more of the misreporting variation.
In Table 5 we also include CBSA-quarter fixed effects and other controls. For second-lien misreporting, loan originator fixed effects explain a larger proportion of the second-lien misreporting variation than do underwriter fixed effects. The regression that includes all controls with CBSA-quarter fixed effects (but neither originator nor underwriter fixed effects) yields an of 0.10. Adding originator, but not underwriter fixed effects, yields an of 0.152, compared to 0.129 when adding only underwriter fixed effects. This suggests that second-lien misreporting seems to be more aligned with originator practices than with underwriter practices. Nevertheless, since underwriter fixed effects explain additional variation beyond originator fixed effects ( of 0.168), second-lien reporting may also be influenced by the underwriter. For appraisal overstatement and owner occupancy misreporting, Table 5 shows that the originator and underwriter fixed effects do not explain much of the misreporting. These types of misreporting did not vary widely across originators and underwriters.
Determinants of misreporting
| Unreported second | Occupancy misreporting | Appraisal overstatement | |||||||||
|---|---|---|---|---|---|---|---|---|---|---|---|
| Adj. | Relative increase (%) | Adj. | Relative increase (%) | Adj. | Relative increase (%) | ||||||
| Baseline | 0.100 | - | 0.087 | - | 0.085 | - | |||||
| w/Originator FE | 0.152 | 52.2 | 0.089 | 1.4 | 0.086 | 1.7 | |||||
| w/Underwriter FE | 0.129 | 29.1 | 0.087 | 0.1 | 0.085 | 0.4 | |||||
| w/Originator and | 0.168 | 68.2 | 0.089 | 1.5 | 0.086 | 1.8 | |||||
| Underwriter FE | Sample size | 1,726,075 | |||||||||
This table compares the adjusted s obtained from OLS regressions of the misreporting indicators on loan-level controls and different combinations of originator and underwriter fixed effects. Underwriter information comes from Bloomberg. Only loans belonging to MBS deals in which one main underwriter is listed are considered. The variables Unreported second, Occupancy misreporting, and Appraisal overstatement are defined in Table 2. The complete regressions are shown in the Internet Appendix.
4.4 Why are appraisals overstated?
Our analysis above shows that it is much more common for appraisals to be substantially above AVM model values than the opposite, and that these appraisal overstatements are strongly related to future loan performance. This pattern could be due to: (1) appraisers doing their best but making random mistakes in their appraisals, or (2) appraisers targeting the expectations of loan officers and thus biasing their appraisals upward. To examine which of these explanations is more prevalent, we examine refinances. With purchases, which are at arm's length, the buyer has an incentive to purchase at a low price. With refinances, in contrast, the price of the house depends solely on the appraisal. If appraisers are generally trying to please loan officers, then we should see more inflated appraisals for refinances. Among refinances, appraisal inflation might be largest among cash-out refinances, where the buyer's goal is to not only repay the previous debts on the property but also maximize the loan value taken. The loan officer may also have an incentive to maximize the loan size, as his or her commission is a function of the dollar value of the loan.
As shown in Table 2, appraisal overstatements are significantly more common in refinances. In panel A of Table 6, we estimate logit regressions for the frequency of appraisal overstatement (using the 20% threshold) and confirm that the higher levels of overstatements for refinances are not driven by loan characteristics. Appraisals in refinances are 74% more likely to be overstated than purchases. Additionally, we find that cash-out loan appraisals are more likely to be overstated than term refinance loan appraisals (odds ratio of 1.81 compared to 1.57, different at the 1% level).
Appraisal overstatements in refinances
| Panel A: Appraisal overstatement and refinances | ||
|---|---|---|
| Appraisal Overstatement | ||
| Refinance | 1.74*** | |
| (39.56) | ||
| Cashout refinance | 1.81*** | |
| (42.09) | ||
| Term/rate refinance | 1.57*** | |
| (28.80) | ||
| Controls | yes | yes |
| CBSA × Quarter FE | yes | yes |
| Observations | 2,575,484 | 2,560,060 |
| Pseudo | 0.09 | 0.09 |
| Panel B: Delinquencies and appraisal overstatements | ||
|---|---|---|
| Delinquent | ||
| Appraisal overstatement × LTV5 | 1.25*** | |
| (22.85) | ||
| Appraisal overstatement | 1.34*** | 1.16*** |
| (46.57) | (15.68) | |
| Controls | yes | yes |
| CBSA × Quarter FE | yes | yes |
| Observations | 2,576,423 | 2,576,423 |
| Pseudo | 0.25 | 0.25 |
This table shows the odds ratios of logit regressions in which the dependent variable is Appraisal overstatement or Delinquent. Refinances are split into cash-out refinances and term refinances. Appraisal overstatement × LTV5 captures appraisal overstatements for loans that have five-unit LTVs. The regression controls for reported second liens, reported nonowner occupied, low/no doc loans, loans used for refinancing, the borrower's credit score, loan amount, LTV, interest rate at origination, presence of a prepayment penalty, adjustable-rate loans, and complex loans. All regressions include core-based statistical area (CBSA) times quarter of origination fixed effects (CBSA × Quarter FE). Standard errors are clustered by CBSA × quarter of origination. The complete regressions are reported in the Internet Appendix. z-statistics are presented in parentheses. , , .
To delve deeper into the two explanations for the predictive ability of appraisal overstatements for refinances, we exclude refinance loans where there are second liens and focus on loans that occur at LTV increments of five. We might see loans clustering at five-unit increments for two reasons. Consistent with explanation (1) above, the loan officer may ask for an unbiased appraisal and then extend a loan up to the value of the appraisal rounded up to increments of five. Consistent with explanation (2), the loan officer may decide what the value of the loan needs to be and then tell the appraiser what valuation to target. Consistent with both explanations, 49% of appraisals for refinances with no second lien are at or within 0.5 units of a five-unit increment. This is shown by the bars in Figure 4, panel A.11 For term refinances, the home owner is only paying back previous debt. To the extent that the home price has changed, there is little reason under the first explanation to think that house values should cluster exactly at five-unit increments. Nevertheless, we find that the percentage of loans occurring at five-unit increments is still high for term refinances (33%).
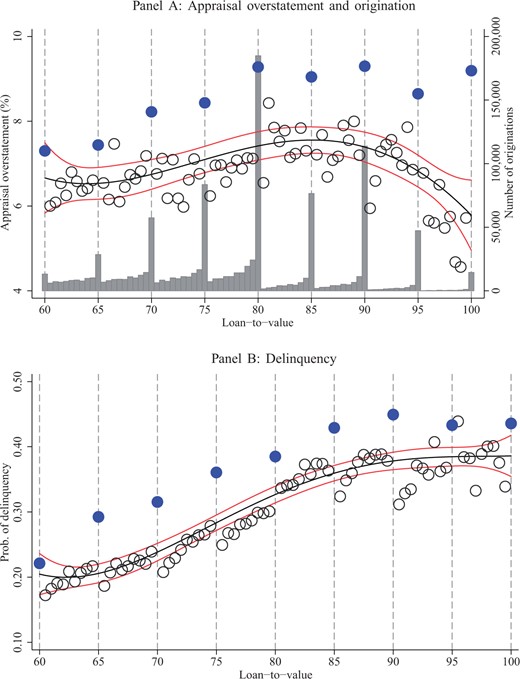
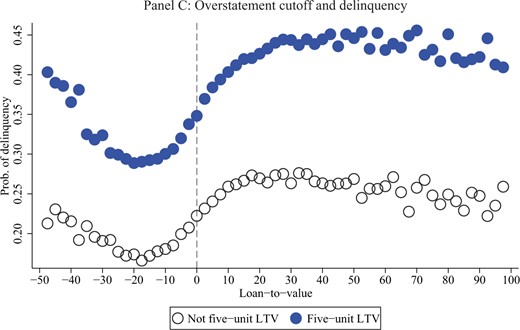
Appraisal overstatements in refinances with no second liens
This figure summarizes various features of refinances with no second liens. Panel A shows the mean percentage overstatement of an appraisal compared to the AVM model for each LTV ratio. The black line fits a fourth-order polynomial for appraisal overstatements. The light lines delimit the 95% confidence interval. Solid circles highlight appraisal overstatements at five-unit LTVs. The bars show the amount of loan originations by LTV. Panel B shows the probability of delinquency by LTV. As in panel A, solid circles highlight delinquency probabilities at five-unit LTVs. Panel C shows the probability of delinquency for different levels of appraisal overstatements. The solid circles represent five-unit LTVs. In all panels, the hollow circles represent loans at the remaining LTV levels.
Next, we examine the amount of appraisal overstatement at the five-unit increments. If appraisal overstatements are random errors (explanation (1)), then overstatements should not be more or less likely at five-unit increments, whereas the targeting explanation (2) suggests that appraisals are more overstated at five-unit increments because the appraiser is told to deliver a high appraisal. As shown by the solid circles in panel A of Figure 4, appraisal overstatements are consistently 1% to 2% higher on every five-unit increment. Panel B shows that loans on the five-unit increments also default at a much higher rate. Both of these findings are consistent with appraisers following instructions from loan officers to target high valuations to meet a certain LTV. Finally, in panel C we examine the relationship between the level of appraisal overstatement and default separately for loans at five-unit increments and loans not at five-unit increments. Delinquency rates are considerably higher across LTV ratios for loans that fall on five-unit increments. Additionally, the delinquency rates rise rapidly from 0% to 5% overstated. Even loans with an appraisal overstatement of 5% default at a much higher rate, and this increase is more pronounced for loans at five-unit increments.
If appraisal clustering on five-unit increments is driven by targeting values given by loan officers, then the overstatement indicator at five-unit increments should be more important for predicting default. To test this conjecture, we return to our logit delinquency regressions. Panel B of Table 6 shows that for loans at five-unit increments, appraisal overstatements lead to a further increase in the likelihood of delinquency (the odds ratio of appraisal overstatements at five-unit LTV increments is 1.25 compared to 1.16 not at these increments).
Our analysis presents strong evidence that our appraisal overstatement variable captures a significant aspect of misreporting by appraisers and loan officers. It also suggests that the ability of the appraisal overstatement indicator to predict delinquency is strongly related to appraisal targeting and not just to random errors by appraisers.
4.5 What role did MBS underwriters play in misreporting?
So far, we have focused on the role of borrowers, appraisers, and loan originators, but not on that of MBS underwriters. Owner occupancy percentages, LTV ratios, and second-lien percentages are typically reported in MBS prospectuses. Detailed loan-level data, including the second-lien information we use, typically originate from raw servicer/trustee loan-level data tapes, but are also similarly displayed in many free writing prospectuses. From the testimony of Vicki Beal of Clayton Holdings before the Financial Crisis Inquiry Commission (FCIC), we know that firms like Clayton Holdings performed due diligence of MBS pools and provided this information to most MBS underwriters. For MBS pools, approximately 3% to 10% of the underlying loans were picked and sent to a firm like Clayton Holdings for detailed loan-level monitoring.12 Interestingly, for sample deals provided in the congressional inquiries, Clayton found that about 28% of loans did not meet credit and compliance guidelines. Yet the banks would typically conclude that the problem was limited to only the sample and replace only part of the troubled loans.13 Additionally, if assertions that monitoring firms had lax practices are true, then the actual extent of misrepresentation could be substantially higher.
Silent second, owner occupancy, and appraisal verification are all services listed by Clayton Holdings and long used by monitoring services. Nevertheless, the information provided by Clayton and publicly released by the FCIC is not detailed enough to see the exact standards that Clayton used for MBS monitoring. It is worth noting that although the originator fixed effects explain more of the variation of the silent seconds indicator in Table 5, the underwriter fixed effects still explain a considerable amount of variation. This indicates that MBS underwriting disclosure practices mattered beyond the originators that they chose to underwrite and that underwriters were active participants in misreporting.
5. Is Originator Performance Related to Misrepresentation Indicators?
Given the substantial amount of misreporting in nonagency MBS pools and its negative effect on loan performance, a natural question that arises is whether misreporting was widespread or concentrated in a few originators.
5.1 Performance and second-lien misreporting
As we have shown in the previous section, originators seemed to be aware of second-lien misreporting. In this subsection we evaluate mortgage lenders in terms of the performance of the loans they originated. We then relate performance to the amount of second-lien misreporting.
Using the loans issued by the 25 largest mortgage originators in the main sample,14 we estimate an OLS regression in which the dependent variable is the delinquency dummy and the explanatory variables are the loan-level controls used in Table 3, not including the misrepresentation indicators. CBSA-quarter and originator fixed effects are also included. The variable of interest is the estimate on the originator fixed effect. This estimate captures the excess delinquency rate experienced by an originator after controlling for observed risk, relative to an originator of reference. We interpret originators with the highest originator fixed effect estimates as having a worse origination process than those with the lowest estimates.
Panel A of Figure 5 plots the originator fixed effect estimates on the vertical axis and the percentage of misreporting exhibited by each lender on the horizontal axis. Several observations stand out. First, there is significant variation in loan quality (i.e., performance) across lenders. Fixed effects range from −0.101 to 0.078, which implies that loans originated by the best-performing originator default 17.9% less on average than loans originated by the worst-performing originator. Second, there is also significant variation in the amount of second-lien misreporting across lenders, with misreporting ranging from 0.56% to 40.2%.15 This result suggests that some lenders played a more important role in facilitating misrepresentation than others. Third, there is a positive relationship between performance and misreporting across lenders. The fixed effects estimate and the amount of second-lien misreporting have a positive correlation of 0.79 (significant at the 1% level). In sum, panel A of Figure 5 indicates that poor originator performance is not just random, but rather is strongly correlated with the average amount of misrepresentation within the loan originator.
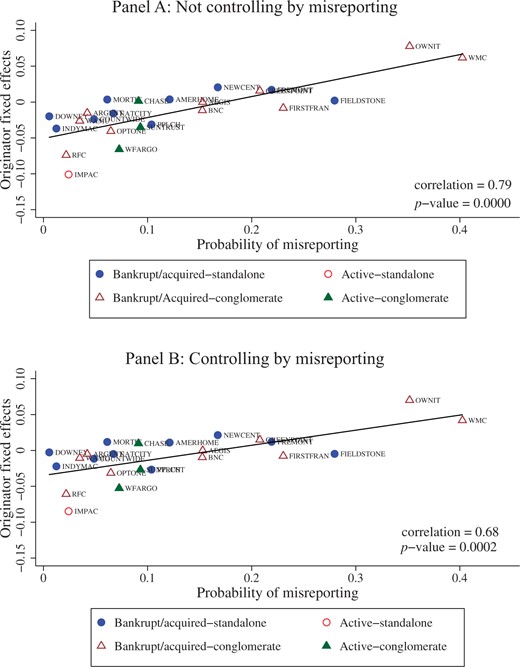
Originator fixed effects and misreporting
We estimate an OLS regression in which the dependent variable is the delinquency dummy and the explanatory variables are the set of loan-level controls, CBSA × quarter fixed effects, and originator fixed effects. Panel A shows the relation between the originator fixed effect estimates and the percentage of loans that exhibit second-lien misreporting, by originator. Panel B shows the relation between the originator fixed effect estimates after adding the three misreporting indicators (second-lien misreporting, occupancy misreporting, and appraisal overstatement) as controls for the previous specification and the percentage of loans that exhibit second-lien misreporting, by originator. Solid circles represent originator fixed effects/probability of misreporting pairs of standalone originators that became bankrupt or were acquired during or soon after the recent financial crisis. Hollow circles correspond to standalone originators that are still active in business. Hollow triangles correspond to originators related to a large bank or conglomerate that became bankrupt or were acquired during or soon after the recent financial crisis. Solid triangles correspond to originators related to a large bank or conglomerate that are still active in business. The black line fits a linear regression and the correlation is shown at the bottom of each graph. The Internet Appendix lists the names that correspond to each originator's abbreviation.
5.2 Do the misrepresentation indicators capture the full extent of misrepresentation?
Here, we examine the same relationship as in the previous subsection, but we remove the original effects of our misrepresentation indicators. If the misrepresentation indicators are capturing the full extent of mortgage misrepresentation, then there should be no relationship between originator fixed effects (after controlling for mortgage misrepresentation) and the extent of second-lien misreporting at each originator. Panel B of Figure 5 plots originator fixed effects, except that this time we add the three misreporting variables as additional controls to the regression in Section 5.1. The correlation between the originator fixed effects estimates and the amount of second-lien misreporting weakens only slightly; there is still a positive correlation of 68%. The percentage of loans misrepresented by the lender remains strongly related to lender performance, even after controlling for the loans flagged as misrepresented. Lenders who have a large percentage of misrepresented loans observe abnormal negative performance due to either more misrepresented loans or some other aspect of originating practices that is correlated with the extent of mortgage misrepresentation, but not captured in our detailed loan-level data controls.
5.3 Does misreporting around securitization thresholds vary across lenders?
To understand how mortgage originator performance varies with mortgage misrepresentation indicators around securitization thresholds, we define the best (worst) performers as the tercile of originators with the smallest (largest) originator fixed effects based on the specification described in Section 5.1. We then repeat the RDD analysis presented in Section 4 but only consider these two subsets of lenders. Figure 6 shows that for loans originated by bad lenders, the amount of second-lien misreporting increases 3.2% at the credit score threshold of 620 for low/no documentation loans and 14.3% at 580 for full documentation loans. These values are much larger than the jumps for the best lenders, which show a small negative jump of 1.5% in the case of low/no doc loans and a jump of 4.2% in the case of full doc loans.
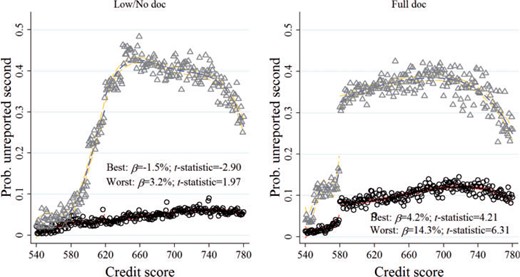
Misreporting around credit score thresholds, best and worst originators
This figure shows the probability of second-lien misreporting by credit score for the subset of loans originated by the best-performing originators and the worst-performing originators. The best performers correspond to the tercile of originators with the smallest fixed effect estimates from a regression of the delinquency dummy on loan-level controls, CBSA × quarter fixed effects, and originator fixed effects. The worst performers correspond to the tercile of originators with the largest fixed effects. We consider the 25 largest originators. The hollow circles represent the probability of second-lien misreporting of the best performers for each credit score. The black line fits a fourth-order polynomial approximation at both sides of the credit score threshold (620 for low/no documentation loans and 580 for full documentation loans). The light lines delimit the 95% confidence level interval for the approximation. The hollow triangles represent the probability of second-lien misreporting of the worst-performing originators for each credit score. The dashed dark line fits a fourth-order polynomial approximation at both sides of the threshold. The dashed light lines delimit the 95% confidence level interval for the approximation. The exact magnitude of the jumps at the discontinuities () along with their t-statistics are also shown in the graphs. The corresponding regression results are presented in the Internet Appendix.
For both the worst- and the best-performing lenders, more than two-thirds of loans are originated by the same lender. Hence, both good- and bad-performing lenders should be aware of unreported second liens, though poor performers seem to be intentionally facilitating second-lien misreporting to a larger degree than good performers.
5.4 Is misreporting persistent?
In this subsection we examine whether misreporting within lenders is persistent and, if so, whether this had implications for the broader market. For this analysis, we split the sample into loans originated during 2002 to 2005 and loans originated during 2006 to 2007. Once again we estimate the specification in Section 5.1 separately for each of these subsamples. Figure 7 shows that second-lien misreporting is persistent within lenders in both periods. The correlation between periods is 0.64.16 Thus, securitizing misrepresented loans was pervasive and persistent across originators for quite some time.
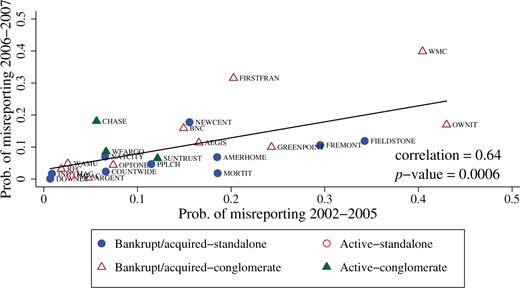
Misreporting persistence
This figure shows the relation between the amount of second-lien misreporting by originator during the 2002 to 2005 period and the amount of second-lien misreporting by originator during the 2006 to 2007 period. Solid circles represent standalone originators that became bankrupt or were acquired during or soon after the recent financial crisis. Hollow circles correspond to standalone originators that are still active in business. Hollow triangles correspond to originators related to a large bank or conglomerate that became bankrupt or were acquired during or soon after the recent financial crisis. Solid triangles correspond to originators related to a large bank or conglomerate that are still active in business. The black line fits a linear regression, and the correlation is shown at the bottom of each graph. The Internet Appendix lists the names that corresponds to each originator's abbreviation.
Above, in Figure 1, we document a massive run-up and subsequent run-down in unreported second liens. It is natural to ask how the persistence of second-lien misreporting can be reconciled with such a pattern. To address this question, in Figure 8 we examine originators in the top and bottom terciles of second-lien misreporting in 2006. The bottom tercile of originators with the highest amount of misreporting was issuing high levels of poorly performing loans at least as far back as the beginning of our sample in 2002. Even though the proportion of origination volume from issuers with high second-lien misreporting was small in the early part of the sample, it grew and peaked from 2005-2006. In the third quarter of 2007, issuance volume dropped dramatically to 2002 levels. Thus, the overall dramatic rise and fall in second-lien misreporting seems to be due to issuers with high levels of misreporting capturing a larger share of the market and ultimately falling due to financial trouble from poor-performing issuances in prior years. This is again consistent with persistent misreporting but wide variation in misreporting across issuers. The findings also further indicate that poor loan performance is not an accident but rather a function of lender practices.
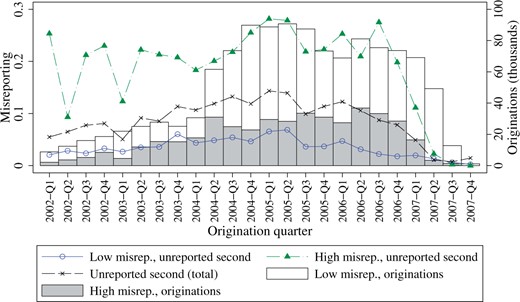
Unreported seconds by level of second-lien misreporting
We rank originators based on the proportion of unreported second liens in 2006. The hollow circles show the level of second-lien misreporting of the originators in the lowest tercile (“Low misreporting”). The triangles show the level of second-lien misreporting of the originators in the top tercile (“High misreporting”). The black dashed line shows the total unreported second-lien level in the full sample (as in Figure 1). The hollow bars and gray bars represent the number of first-lien mortgage originations of low-misreporting and high-misreporting originators, respectively.
6. Did Misreporting Vary by Underwriter?
We examine differential reporting by underwriters. The top graph in each panel of Figure 9 depicts misreporting by underwriters. Panel A shows there are substantial differences in the amount of second-lien misreporting across underwriters.17
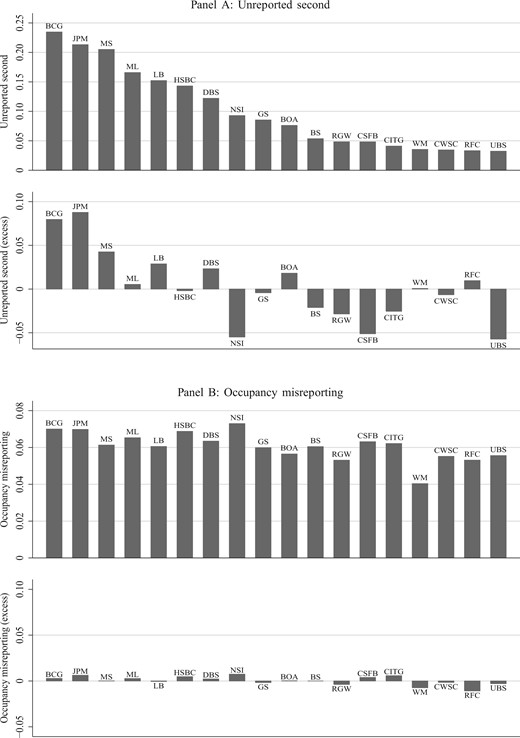
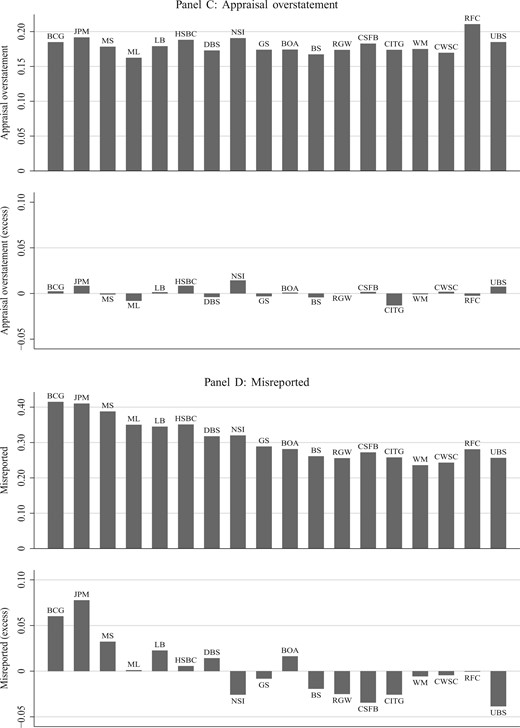
Misreporting by underwriter
This figure examines differential reporting by underwriters. The top graph in each panel shows misreporting by underwriters, and the bottom graph in each panel shows the excess misreporting compared to a benchmark based on the average amount of misreporting of each originator and the importance of each originator in the pools securitized by each underwriter. The comparisons for unreported second liens, occupancy misreporting, appraisal overstatements, and the aggregate misreporting indicator are shown in panels A, B, C, and D, respectively.
It could be that the large cross-sectional differences in misreporting by underwriters are due to the securitization of loans issued by originators with high levels of misreporting. To test this conjecture, we construct a benchmark for misreporting based on the average amount of misreporting of each originator and then calculate an underwriter's abnormal misreporting as actual misreporting minus benchmarked misreporting. Underwriters with high second-lien misreporting tend to display more misreporting than the benchmark. This result indicates that the cross-sectional differences in misreporting across underwriters are due in part to differences in the quality of their second-lien practices. For owner occupancy and appraisal overstatements, there are only small differences across underwriters after controlling for the average amount of misreporting by originator.
From the eighteen largest players in the securitized market, the highest aggregated misreporting is by Barclays and JP Morgan. Consistent with our findings, as part of a recent $13 billion settlement with the DOJ, JP Morgan admitted mortgage misrepresentations on MBS they issued.18 Nevertheless, misreporting is high for all underwriters in general; the least amount of misreporting is for Washington Mutual.19 It is also important to remember that our analysis covers only three types of mortgage misrepresentation and uses overly conservative estimates, so our estimates are likely a lower bound on the extent of misrepresentation.
7. Conclusion
Using a large sample of nonagency securitized loans originated between 2002 and 2007, we find sizeable amounts of mortgage fraud in the form of unreported second liens, owner occupancy misreporting, and inflated appraisals. These apparent misrepresentation patterns are surprisingly similar for full and low/no documentation loans. Loans with a misrepresentation indicator are 51% more likely to become seriously delinquent. These indicators, which can be measured at issuance, are widely informative about future loan performance. Since lenders do not charge higher interest rates for loans with owner occupancy misreporting and the amount does not vary around securitization thresholds, the misrepresentation we document appears to be driven largely by borrowers. However, higher interest rates for loans with unreported second-lien loans and loans with inflated appraisal values suggest that lenders were aware of this risk. Indeed, in more than two-thirds of the cases in which a first-lien loan has an unreported second-lien loan, both loans were issued simultaneously by the same originator. Second-lien misreporting among low and full documentation loans is considerably greater around credit score thresholds, suggesting that second-lien misreporting occurs in part because the originator intended to securitize the loans. Appraisal overstatements are much greater around LTV thresholds, and these thresholds are associated with higher default rates, indicating that appraisers were often targeting valuations from loan officers.
Owner occupancy and appraisal overstatement misreporting does not vary widely across originators and underwriters. The importance of both originator and (to a lesser extent) underwriter fixed effects in explaining cross-sectional differences in whether a second lien is misreported suggests that misstatements were a function of both the originator and the underwriter. Underwriters should have been aware of reporting discrepancies for all three forms of misreporting to the extent that loan monitoring was performed by, or on behalf of, underwriters. Even after removing the component of performance explained by our misreporting indicators, originator loan performance is strongly related to originator-level second-lien misreporting. This suggests that our misreporting indicators are not capturing the full extent of misreporting or other poor origination practices.
In the sense that accurate weights and measures are essential for trade, an accurate description of an asset seems to be a minimum condition for a sustainable market. Surprisingly, these basic conditions do not appear to have been met on a wide-scale basis. Our results are generally consistent with the originate-to-distribute explanation of not caring about ultimate performance, but ran deeper than incomplete screening. Our results suggest that originators and underwriters possessed sufficient information to know that their loans were considerably more risky than represented to investors, but made false representations anyway. Large-scale misreporting even for full documentation loans indicates that securitization cannot be fixed simply by requiring more documentation.
The conventional view of reputation is that the loss of future business is enough to induce market participants to correctly report. Griffin et al. (2014) show that this conventional wisdom can break down with complex securities like structured products as investors only learn the true value of the underlying assets in the next market downturn. This ability to misreport without being detected for an extended period with complex securities can incentivize underwriters of perceived high reputation to burn their reputation and misrepresent securities. As one considers the future of securitization, investors may need additional recourse and guarantees that someone will more consistently stand behind the stated representations of the underlying assets. While the securitization market has re-emerged at a vibrant pace (CMBS, ABS, and MBS), one must ask whether the seemingly minor changes made within the market are sufficient given the major structural problems recently uncovered and the negative banking externalities that the market has been shown to generate. An obvious policy implication of wide-spread prevalence of MBS fraud is more security-level transparency, and yet shockingly, most nonagency MBS issuances after the financial crisis are now private placements, and hence allow almost no public scrutiny. For long-run viability the structured finance industry clearly needs more transparency and accountability, not opacity.
We are grateful to Andres Almazan, an anonymous referee, Aydogan Alti, Malcolm Baker, Bo Becker, Itzhak Ben-David, Jonathan Cohn, Shawn Cole, Josh Coval, Tin Dihn, Giovanni Favara, Samuel Hansen, Victoria Ivashina, Alexander Ljungqvist, Chris Malloy, Jordan Nickerson, Amiyatosh Purnanandam, Jonathan Reuter, Alessio Saretto, Amit Seru, Clemens Sialm, Matthew Spiegel (the editor), Erik Stafford, Sheridan Titman, Jun Wen, as well as seminar participants at Arizona State University, Boston College, Harvard Business School, the University of Chile, the University of Massachusetts Amherst, the University of Texas at Austin, the Ohio State University Alumni Conference, and the 2013 CAREFIN Bocconi Banking Conference for helpful comments. We also thank Kevin Mei, Jacob Rachiele, and especially Christopher Miller for excellent research assistance. The data used in this paper were purchased by John Griffin through Integra FEC. Griffin is an owner of Integra FEC and Integra REC, both of which engage in financial consulting on a variety of issues, including mortgage fraud. Integra REC is a party to MBS litigation against banks. The analyses and conclusions of this paper are unaffected. Supplementary results can be found in an Internet Appendix on the Review of Financial Studies Web site.
1 Even if we instead use an overly conservative threshold that considers homes misstated when the appraisal is 20% above the AVM, 17.8% of homes have inflated appraisals and the aggregate measure of misreporting drops to only 30.1%.
2 For example, Ben-David (2011) finds evidence of inflated appraisals and “cash-back” deals in highly levered deals in the Chicago area. Jiang et al. (2014) find evidence of income falsification in low-documentation loans at a large bank.
3 We find practically the same levels of second-lien misreporting when including home equity lines of credit (HELOCs) (13.4% compared to their 13.6%) and a slightly higher level of occupancy misreporting (7.7% compared to 6.4%).
4 For example, “The Morgan Shakedown,” The Wall Street Journal, October 20, 2013; “Shakedown? Big Banks Paying for Sins of Bad Players,” CBN News, August 23, 2014.
5 The quality of their valuations is supported by AVMetrics, a firm dedicated to evaluating and ensuring the correct use of AVM's best practices. Collateral Analytics' AVM has consistently ranked among the top industry performers in competitions for AVM accuracy.
6 We matched 5,284,624 first liens that originated during the 2002 to 2007 period and were used for purchase or refinancing with an initial loan amount over $30k. After applying the additional filters described in the Internet Appendix, 5,105,221 loans remain. An additional 1,031,649 loans are lost when we drop the MBS pools in which LTV and CLTV values are the same for all MBS in the pool as described above. Finally, we drop loans in which any of the variables used as controls in our regressions have missing observations, leaving us with 3,143,755 loans.
7 It is important to note that the AVM value at origination is based on information available at that time; that is, it is not subject to look-ahead bias. Additionally, we consider the AVM model value as missing in cases in which the AVM value and the appraised value were exactly the same, as it is unlikely that the appraised value from a combination of statistical models can exactly coincide with the realized value.
8 At the 20% threshold, only 5.4% of the loans show appraisals, where the AVM is 20% or above the appraisal, indicating 12.4% (17.8-5.4) more overstated appraisals than understated.
9 A precise definition of each variable used in the regression is available in the Internet Appendix.
10 Full documentation loans whose associated credit score is slightly over 580 are also significantly more likely to be securitized, as shown in the Internet Appendix. For full documentation loans, we find the discontinuity at 600 shown in Keys et al. (2010), but at 580 the discontinuity in our sample is larger.
11 To ensure that only the amount of the first-lien mortgage is relevant, we remove loans with second liens (either reported or unreported). Interestingly, most of this activity happens exactly at the five-unit LTV number.
12 CoreLogic, Fidelity Information Services, 406 Partners, Allonhill, American Mortgage Consultants, Opus Capital Markets Consultants, and RR Donnelly are listed by Ms. Beal as competitors.
13 Underwriters may have picked random samples or samples with more favorable or adverse characteristics. There was then a waiving process in which “exceptions” were made, even for the sample loans. So, for example, for a MBS with 10% loans sampled and 28% of these loans found not to have been up to underwriting standards, only 1.6% might be replaced. According to Vicki Beal, underwriting firms used this information to negotiate better prices on the loan pools they were purchasing.
14 We have originator names for 88.3% of the loans in the main sample, 81.6% of which were issued by the twenty-five largest originators. A complete list with the names of these originators and their abbreviations is provided in the Internet Appendix.
15 Interestingly, WMC (a subsidiary of GE Capital), which is associated with the highest second-lien misreporting rate in our sample, has faced serious accusations that misrepresentation and document falsification was rampant and that several whistleblowers were completely ignored and sidelined. In January 2012, for example, the LA Times reported that WMC was under criminal investigation by the FBI and the U.S. Department of Justice for falsifying paperwork and other questionable loan practices (Hudson and Reckard 2012, “GE lending unit said to be target of U.S. probe,” Los Angeles Times, January 20).
16 In the Internet Appendix we show that occupancy misreporting and appraisal overstatements are also persistent, with correlations of 0.52 and 0.69 between periods.
17 The list of underwriters and corresponding abbreviations is presented in the Internet Appendix.
18 The settlement explicitly admits mortgage misreporting from securities issued by JP Morgan and not just from Bear Sterns and Washington Mutual.
19 To be consistent with the regression results, Figure 9 uses the 20% threshold for appraisal overstatements. However, if we use the 5% threshold that mirrors the aggregate misreporting, the misreporting for all underwriters ranges between 42% and 61%.
References
