


Abstract
To investigate whether epigenetic cell counting represents a novel method to quantify immune cells in salivary glands of patients with different forms of Sjögren’s and sicca syndrome and to capture immunopathology and potentially aid in diagnosis.
DNA from frozen salivary gland tissue sections of sicca patients was used for bisulphite conversion of demethylated DNA cytosine residues, followed by cell-specific quantitative PCR to calculate cell percentages in relation to total tissue cell numbers as quantified by housekeeping gene demethylation. The percentages of epigenetically quantified cells were correlated to RNA expression of matched salivary gland tissue and histological and clinical parameters.
The percentages of epigenetically quantified CD3, CD4, CD8, T follicular helper (Tfh) cells, FoxP3+ regulatory T cells and B cells were significantly increased in the salivary glands of patients with SS. Unsupervised clustering using these percentages identified patient subsets with an increased lymphocytic focus score and local B cell hyperactivity and classifies patients different from conventional classification criteria. In particular, Tfh cells were shown to strongly correlate with the expression of CXCL13, lymphocytic focus scores, local B cell hyperactivity and anti-SSA positivity.
Epigenetic cell counting is a promising novel tool to objectively and easily quantify immune cells in the labial salivary gland of sicca patients, with a relatively small amount of tissue needed. In view of the potential of this technique to include a huge number of (cell-specific) biomarkers, this opens up new standardized ways of salivary gland analysis with high relevance for patient classification, understanding of immunopathology and monitoring of drug responses in clinical trials.
Epigenetic cell counting is a novel tool to quantify lymphocytes in salivary glands of sicca patients.
Epigenetic cell counting could be valuable in studying immunopathology in sicca patients.
Epigenetic cell counting could aid in diagnostics, prognostics and monitoring of therapy response in clinical trials.
Introduction
Primary SS (pSS) is a chronic, systemic autoimmune disorder characterized by dryness and lymphocytic infiltration of the exocrine glands [1]. pSS occurs in the absence of other autoimmune diseases and secondary SS (sSS) presents along with other autoimmune diseases [1]. Salivary gland biopsy is widely used for the diagnosis of pSS. The lymphocytic focus score (LFS), as enumerated in haematoxylin and eosin–stained salivary gland tissue sections, forms part of routine clinical diagnostics and has an important position in the classification criteria for SS [2–4]. However, this method of analysing salivary gland inflammation has several drawbacks, including a lack of standardization of acquisition and processing of the salivary gland tissue, subjective histological interpretation and poor correlation of the scored abnormalities with dryness assessments. The latter is not necessarily a consequence of a lack of standardization, but the limited information that is collected from the current histology simply does not allow for more in-depth analyses of different cell subsets. In this respect, the immunological processes that lead to immunopathological events such as lymphoma development lack detailed information on the inflammatory cell types. In addition, molecular markers that might be associated with aberrances in the function of tissue cells such as epithelial cells or fibroblasts are currently lacking. More in-depth analysis might help to reveal the relationship between inflammation and damage of tissue cells.
Optimization of existing histology protocols to determine salivary gland inflammation will help to improve the diagnosis of SS [5]. In parallel, exploration of complementary methodologies for analysis of local immunopathology could enable diagnostics, prognostics and patient-tailored treatment. Novel techniques that allow for better precision by high-throughput cell quantification in salivary gland tissues would be very helpful. We here explore whether epigenetic cell counting (ECC) can serve as a complementary tool to objectively classify patients and to improve the characterization of immune cell infiltrate to better understand immunopathology in SS and other patients with sicca symptoms. ECC might also have the potential to stratify patients and to provide biomarkers to monitor response to therapy.
Epigenetic mechanisms such as DNA methylation are important modulators of gene expression. Epigenetic cell counting is a novel form of immune cell quantification based on real-time quantitative PCR (qPCR) that is based on certain genomic loci that remain specifically unmethylated in selected cell types, whereas they are methylated in all other cell types. This biological phenomenon can be turned into the primary sequence by treating DNA with bisulphite, leading to conversion of demethylated cytosines of the cellular DNA and allowing specific qPCR. The methylation status of the chromatin structure of either actively expressed or silenced genes is the basis of the epigenetic-based cell identification and quantification technology. Discovery of cell type–specific removal/absence of methyl groups (demethylation) permits precise and robust quantification of immune cells from only small amounts of human blood or tissue samples (Fig. 1A, B) [6]. These epigenetic biomarkers located on genomic DNA are also stably associated with a cell type of interest. This may prove superior to RNA expression, which can be subject to enzymatic degradation and is often poorly associated with protein expression and cell function. This is exemplified by the Treg-specific demethylated region, which to date provides the most accurate identification and quantification of Tregs [7]. Another advantage of ECC is that it overcomes the requirement of immune cells from blood or tissue samples to be fresh, as ECC uses DNA, which can be stored long term. This is currently a major obstacle of studies on inflammatory cells and immunopathology.
ECC detects increased CD3 lymphocytes in salivary gland biopsies correlating with gene expression and IHC
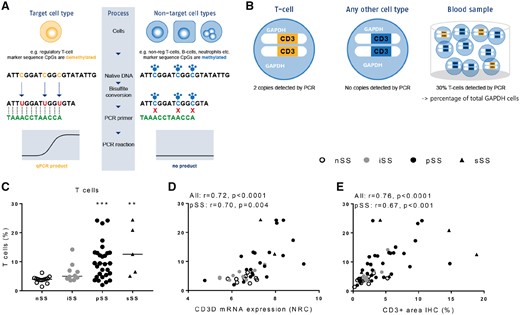
(A) ECC is based on cell type–specific epigenetic biomarkers marked by the absence of CpG methylation (demethylated regions). See Supplementary Methods. (B) Only in T cells, the CD3 gene region is epigenetically active (yellow) and will be amplified by PCR. In other cell types, this region is epigenetically inactive (blue). The number of epigenetically active CD3 gene copies translates into the number of T cells vs the total number of cells with epigenetically active reference gene GAPDH. (C) ECC detects increased CD3 percentages in salivary glands of iSS, pSS and sSS patients vs nSS patients. (D) Epigenetically quantified CD3 T cells strongly correlate with CD3 gene expression and (E) CD3 expression as digitally quantified following IHC. Medians are shown. Kruskal–Wallis test with Dunn’s multiple comparison test was used. **P < 0.01 and ***P < 0.001 vs nSS patients. Spearman correlation coefficients (r) are given for all sicca patients and for pSS patients.
In the current study we epigenetically quantified total CD3 T cells, total B cells and subsets of T cells, including FoxP3 Tregs, IL-17-producing Th cells, T follicular helper (Tfh) cells, CD4 cells and CD8 cells. Considering the important role of Tfh cells in the formation of ectopic lymphoid structures (ELSs) [8–10], the associations of these cells with clinical and immunological parameters were studied in more detail. In addition, the relationship of Tfh cells with clinical scores, B cell hyperactivity, anti-SSA positivity, CD21+ follicular dendritic cells and ELSs were studied. Finally, associations of Tfh cells with RNA expression levels were investigated, including CXCL13, which is the major chemokine involved in directing Tfh cells into the ELSs [9] and is suggested to be crucial for B cell hyperactivity [9, 11].
Our data demonstrate that epigenetic quantification of immune cells in salivary glands of SS patients is a novel tool to objectively detect significant correlations of inflammatory cell subsets with immunopathology and disease parameters.
Methods
Patients
pSS (n = 29) and sSS patients (n = 5) were diagnosed by a rheumatologist and fulfilled the American–European Consensus Group classification criteria [2]. The sSS patients were diagnosed as having SS in addition to another rheumatic autoimmune disease. Non-SS (nSS) sicca patients (n = 13) were defined as patients with sicca complaints, without a connective tissue disease including pSS, with an LFS of zero and without anti-Ro/SSA or anti-La/SSB autoantibodies. Patients with incomplete SS (iSS; n = 10) were defined as patients with sicca complaints, without a connective tissue disease, not fulfilling the classification criteria for pSS, but that do show signs of limited lymphocytic infiltration and/or the presence of anti-Ro/SSA or anti-La/SSB autoantibodies (clinical data are described in Table 1). Salivary gland tissue was surplus tissue that was provided pseudonymised, for which ethical approval was obtained according to the guidelines of the hospital’s ethical committee (document number 14-589).
Table 1 Patients’ characteristics
| Characteristics | nSS (n = 13) | iSS (n = 10) | pSS (n = 29) | sSS (n = 5) |
|---|---|---|---|---|
| Gender, female, % | 77 | 100 | 90 | 100 |
| Age, years, mean (s.d.) | 47 (15) | 49 (15) | 53 (13) | 53 (15) |
| Anti-Ro/SSA positive, % | 0 | 60 | 69 | 60 |
| Anti-La/SSB positive % | 0 | 0 | 30 | 0 |
| LFS, foci/4 mm2 | 0 | 0.4 (0.4) | 2.3 (1.4) | 3.5 (2.1) |
| IgG+ and IgM+ plasma cells in LSG biopsy, %, mean (s.d.) | 24 (14) | 26 (14) | 51 (16) | 42 (21) |
| Serum IgG, g/L, mean (s.d.) | 11.0 (3.1) | 10.8 (2.4) | 16.3 (8.2) | 14.4 (3.1) |
| ESR, mm/h, mean (s.d.) | 11 (9) | 17 (14) | 17 (15) | 19 (14) |
| Schirmer, mm/5 min, mean (s.d.) | 5 (7) | 7 (6) | 6 (7) | 6 (2) |
| Immunosuppressive medication, n | 5 | 3 | 13 | 4 |
| HCQ, n | 3 | 1 | 6 | 0 |
| Corticosteroids, n | 0 | 1 | 3 | 1 |
| Other,a n | 2 | 1 | 4 | 3 |
One pSS patient used methotrexate and another pSS patient used mesalazine, one sSS patient used methotrexate and another sSS patient used sulfasalazine. The others used NSAIDs by prescription.
ECC
Epigenetic-based quantification of inflammatory cells was carried out by Epiontis (Berlin, Germany), as previously reported [6]. Briefly, using bisulphite-converted DNA as substrate, qPCR assays were performed for the selected cell type–specific demethylated loci and for a locus known to be demethylated in all cell types (glyceraldehyde-3-phosphate dehydrogenase [GAPDH]) [6]. The latter was used to allow for determination of total cell numbers (Fig. 1B). PCR systems including primers, probes and templates for all assays were taken from Baron et al. [6]. For the present analyses, data of epigenetic-based cell counts are presented as the percentage of cell-specific demethylation divided by GAPDH locus demethylation within salivary gland tissue DNA samples and multiplying that ratio by 100 [6].
Statistical analyses
Statistical analyses were performed in GraphPad Prism 6 (GraphPad Software, San Diego, CA, USA) and SPSS version 21 (IBM, Armonk, NY, USA). Differences between the groups were assessed by Kruskal–Wallis test with Dunn’s multiple comparisons post hoc test. Spearman’s rank correlation coefficient was used for correlation analyses. Heat map visualization and unsupervised hierarchical clustering based on Euclidian distances were performed in MeV (Multiple Experiment Viewer). More detailed information on methods is described in the supplementary material, Methods section, available at Rheumatology online.
Results
ECC in salivary gland allows for robust detection of inflammatory cells
To assess whether ECC can be used as a tool to identify and quantify inflammatory cells in labial salivary gland biopsy tissue, we measured seven different cell types in all 57 sicca patients (see patient details in Table 1; the experimental procedure is described in Supplementary Fig. S1, available at Rheumatology online).
Epigenetically quantified CD3 T cells (Fig. 1C) were significantly increased in pSS and sSS patients as compared with nSS patients. As a representative marker we next assessed whether epigenetically quantified CD3 T cells could be technically validated by CD3 RNA assessment and quantification of CD3 T cells at the protein level using immunohistochemistry (IHC). Indeed, strong correlations were observed between epigenetically quantified CD3 T cells and CD3D gene expression (Fig. 1D) as well as digitally quantified CD3 T cells following IHC (Fig. 1E).
ECC-based clustering identifies sicca patients with B cell hyperactivity and clusters different than diagnosis and classification criteria
In addition to CD3 T cells, B cells, CD4 cells and CD8 cells were all significantly increased in pSS and sSS patients as compared with nSS patients (all at least P < 0.05; Fig. 2). In iSS patients, only CD8 cells were modestly yet significantly increased (data not shown). In addition, studying functionally related T cell subsets, we found both Tfh cells and FoxP3-expressing Tregs strongly increased in the salivary glands of pSS and sSS patients (Fig. 3 and Supplementary Fig. S2, available at Rheumatology online). In contrast, Th17 cells were present in substantial numbers, but no significant differences in the salivary glands of pSS, iSS and sSS patients as compared with nSS patients were observed (Supplementary Fig. S2, available at Rheumatology online).
ECC clusters patients with severe lymphocytic infiltration and B cell hyperactivity
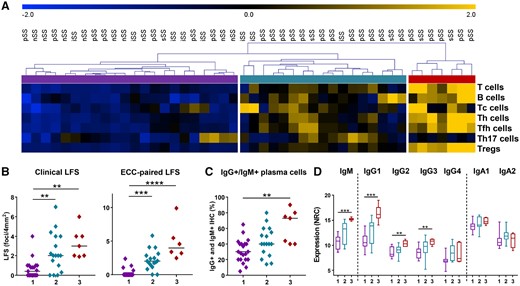
(A) Using unsupervised hierarchical clustering, three clusters of sicca patients are identified based on ECC counts (blue to yellow represents Z scores from −2 to +2 standard deviations). (B) Lymphocytic focus scores as diagnostically assessed (clinical) and of ECC-matched tissue are shown for all three clusters, with cluster 3 identifying patients with the highest LFS scores. (C) ECC-based clustering identifies patients with high B cell hyperactivity as indicated by percentages of IgG+ and IgM+ plasma cells as assessed by routine clinical practice by the pathologist and (D) by mRNA expression of the heavy chain constant region from IgG and IgA isotypes and IgM. Boxplot whiskers indicate the 5–95% interval. Medians are shown. Kruskal–Wallis test with Dunn’s multiple comparison test was used. *P < 0.05, **P < 0.01 and ***P < 0.001.
Salivary gland Tfh cells quantified by ECC are increased in SS patients and correlate with LFS
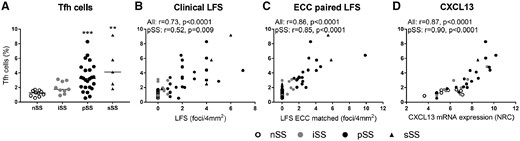
(A) Tfh frequencies as assessed by ECC are elevated in pSS and sSS as compared with nSS patients. (B) Tfh cell frequencies correlate with clinical LFS scores and (C) strongly correlate with LFS scores of tissue sections that were paired to tissue sections that were used for ECC. (D) Tfh cells also robustly correlated with CXCL13 RNA expression (DNA/RNA isolated from the same tissue sections). Medians are shown. Kruskal–Wallis test with Dunn’s multiple comparison test was used. **P < 0.01 and ***P < 0.001. Spearman correlation coefficients (r) are given for all sicca patients and for pSS patients.
Next we assessed whether ECC-based clustering could identify patient subgroups. Unsupervised hierarchical clustering of cell counts identified three patient groups (Fig. 2A). Interestingly, group 1 consisted of all nSS patients, but also seven pSS, five iSS and one sSS patient. On average, this group was characterized by low LFS scores (Fig. 2B) and low B cell activity, as indicated by the low percentages of salivary gland IgM- and IgG-expressing plasma cells as quantified by IHC for diagnostic purposes and low levels of salivary gland IgM and IgG isotype gene expression (Fig. 2C and D). Group 3 identified pSS and sSS patients with high LFS scores (Fig. 2B) and high percentages of IgM- and IgG-expressing plasma cells in the LSG, corroborated by high levels of IgM, IgG1, IgG2 and IgG3 gene expression (Fig. 2D).
Group 2 is an intermediate group based on the LFS and percentages of IgG+ and IgM+ plasma cells [LFS, mean 2.4 (s.d. 2.0) vs 0.6 (0.9); IgG+ and IgM+ plasma cells, mean 43% (s.d. 19) vs 31 (15) in group 2 and 1, respectively]. Increased serum IgG levels were observed in group 2 [18.2 g/L (s.d. 8.9) in cluster 2 vs 11.2 (2.8) in cluster 1], whereas the increase in cluster 3 was not significantly different [16.7 (8.0), P = 0.428].
In view of the association between type I IFN activity and disease activity as well as B cell hyperactivity in pSS [12], the expression of IFN-inducible genes (IFIGs) was assessed in the salivary gland biopsies, as previously described in pSS [12]. The expression of most of these genes was elevated in a proportion of the pSS patients, especially those in cluster 3 (Supplementary Fig. S3, available at Rheumatology online.). In line with this, expression of IFIGs significantly correlated with B cell and Tfh cell frequencies as quantified by ECC (Supplementary Fig. S3, available at Rheumatology online).
Increased epigenetically quantified Tfh cells strongly correlate to CXCL13 expression and B cell hyperactivity
Since Tfh cells play a crucial role in lymphoid neogenesis and have potent B cell stimulatory capacities, we assessed the frequencies of Tfh cells as quantified by ECC in association with clinical parameters of lymphocytic infiltration and B cell hyperactivity. The number of Tfh cells was elevated in pSS and sSS patients and correlated with both clinical LFS and even more strongly with LFS of ECC-paired tissue (Fig. 3A–C). Tfh cells express chemokine receptor CXCR5, by which CXCL13 directs these cells to B cell–rich areas in ELSs. Indeed, the number of Tfh cells correlates with mRNA expression of CXCL13 (Fig. 3D) and CXCR5 (r = 0.60, P = 0.009 in pSS patients). In addition, Tfh cell numbers correlated with ICOS and MAF mRNA expression (r = 0.76, P < 0.001 and r = 0.73, P < 0.001 in pSS, respectively), characteristic genes for Tfh cells, but did not significantly correlate with gene expression characteristic for other T cell subsets (CXCR3, RORC, GATA3 and FOXP3, data not shown).
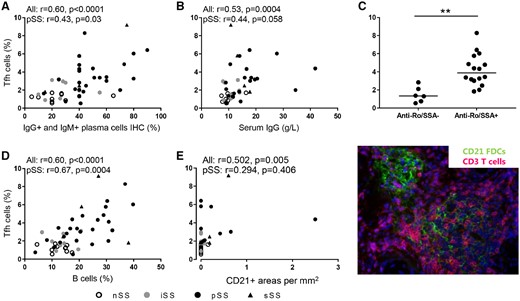
Importantly, Tfh cell frequencies correlated with clinical measures of B cell hyperactivity, including percentages of IgM- and IgG-expressing plasma cells in the salivary glands, serum IgG levels, the presence of anti-Ro/SSA autoantibodies and the frequency of B cells as assessed by ECC (Fig. 4A–D). To assess ectopic lymphoid structures in the salivary gland biopsies, co-stainings of CD3 or CD20 with CD21 (indicating follicular dendritic cells) were performed. CD21-containing follicular dendritic cell (FDC) networks were increased in SS vs nSS patients [0.3 (0.6) vs 0.0 (0.0), P = 0.016], but Tfh cell frequencies only modestly correlated with the CD21-expressing cells in sicca patients (Fig. 4E).
Salivary gland Tfh cells quantified by ECC correlate with B cell hyperactivity in SS patients
Tfh cell frequencies correlate with (A) the percentage of IgG- and IgM-expressing plasma cells, (B) serum IgG levels and (C) the presence of autoantibodies anti-Ro/SSA (median is shown; Mann–Whitney U was used). (D) In addition, Tfh cell frequencies correlate with B cell frequencies as assessed by ECC and (E) are modestly associated with the presence of CD21+ FDCs containing lymphoid structures in sicca patients. *P < 0.05, **P < 0.01 and ***P < 0.001. Spearman correlation coefficients (r) are given for all sicca patients and for pSS patients.
Discussion
We here demonstrate that ECC is a valuable technique to measure inflammatory cell subsets in salivary glands, allowing clustering of patients that are characterized by high LFS and B cell hyperactivity. Specifically, we show that epigenetically quantified Tfh cells are strongly associated with markers of lymphoid neogenesis (including CXCL13, CXCR5 and ICOS) and clinical parameters associated with disease severity (LFS, anti-SSA positivity and B cell hyperactivity).
Elevated frequencies of all studied inflammatory cells, except for IL-17-producing cells, are identified in pSS and sSS patients vs non-autoimmune sicca patients using ECC. Representative marker results were validated by RNA expression (for CD3 and Tfh cells) and IHC (for CD3), supporting the robustness of the ECC method. Clustering based on ECC results identified a cluster of pSS and sSS patients with the most severely affected salivary glands in terms of lymphocytic infiltration and B cell hyperactivity. Whether such differences are clinically meaningful and will help in decision making needs to be demonstrated in larger cohorts that could typically be made available within large consortia that are currently being established (e.g. HarmonicSS). Interestingly, the current data demonstrated ECC-based clustering that classified patients distinct from classification criteria and hence this tool may complement existing tools. For future research, it is important to correlate ECC results with disease activity scores (ESSDAI) and patient-reported scores (ESSPRI), which unfortunately were not available in the period in which the biopsies used for this study were collected. However, the results from this study indicate that ECC could be a valuable tool to improve tissue assessment for diagnostic and research purposes in sicca patients.
Although current histology has obvious advantages, such as information on tissue architecture, currently assessment of salivary gland biopsies is not performed according to standardized procedures and reliability is dependent on experienced technicians and pathologists [5]. In addition, quantification of different cell subsets by IHC staining is laborious and time consuming and, for such reasons, is often limited to a small tissue surface area. Using ECC, frequencies of immune cells are objectively quantified, which may improve the reliability of tissue assessment, homogeneity of study populations and comparability between studies. Using ECC, many cell subsets can be quantified at the same time from one tissue sample (currently ∼10 cell subsets/1 mm3). In addition, ECC is DNA-based, which is more stable than RNA, and may be applied to, for example, formalin-fixed paraffin-embedded tissue. As a future perspective, ECC potentially requires less tissue to perform reliable analyses as compared with currently used procedures, as it allows for analysis of cells in a large number of tissue layers and, if necessary, the analysis of all cells in the tissue sample. This potential is corroborated by the fact that epigenetically quantified immune cells (Tfh cells) strongly correlated with the LFS of paired tissue samples, indicating ECC accurately captures lymphocytic foci. Interestingly, the size and number (n = 1–2) of the available minor salivary glands was much smaller than what was used to assess the LFS for clinical practice (n = 5–7). In this respect, patients could benefit from this, as a much smaller number of tissue samples might be needed, potentially allowing additional analyses and possibly reducing the invasiveness of surgical procedures.
Identifying immune cell subsets using a combination of (surface) markers can be both a challenge, due to technical limitations, and time consuming, especially in tissues using IHC. As we confirm in this study [13], ECC robustly identifies several immune cell subsets with specific functional properties. As an example, we quantified FoxP3+ Tregs, whose exact markers for more than a decade have remained elusive. Stable expression of FOXP3 in Tregs was found to be largely controlled by a highly conserved CpG-enriched element in the FOXP3 gene, the Treg-specific demethylated region (TSDR) [14]. Since activated CD4 T cells can express both CD25 and FOXP3 [15], and TSDR demethylation is not shared by activated T cells, the Treg-specific epigenetic status provides the most accurate identification and quantification of Tregs [7]. Hence other unique epigenetic markers may be used to provide detailed information on the functional properties of inflammatory cells in inflamed exocrine glands. In addition to the demethylation markers we have used in the current study, future studies could focus on a wide array of markers to identify specific pathologic events such as fibrosis and angiogenesis. Such markers might also be applied to identify therapeutic targets and to develop markers for stratification, prognosis and treatment response in sicca patients.
Although all activated T cells can stimulate B cell activity, Tfh cells in lymphoid organs and inflamed tissue are considered one of the most potent T cell subsets inducing B cell hyperactivity. In addition, Tfh cells can play an important role in the formation and maintenance of germinal centres. In the present study, epigenetically quantified Tfh cell frequencies strongly correlated with important measures of immunopathology, including lymphocytic infiltration, number of B cells, elevated serum and salivary gland Ig levels and autoimmunity. Finally, the number of Tfh cells also strongly correlated with CXCL13 expression, a chemokine that tightly regulates the movement of CXCR5+ Tfh cells and B cells. Elevated CXCL13 levels are expressed by a large proportion of patients with pSS in either serum or saliva [16], correlate with B cell hyperactivity and disease activity and are elevated in patients with lymphoma [17, 18]. In addition, CXCL13 in serum and salivary glands has been shown to correlate with disease progression in several SS murine models. Furthermore, CXCL13 is elevated before disease becomes evident in a murine SS-like disease model and neutralizing CXCL13 diminishes the disease [16]. Thus epigenetically quantified Tfh cells may capture CXCL13-driven inflammation and may be valuable as a biomarker for initial diagnosis and in the assessment of disease progression and severity.
CXCL13 can be produced by follicular stromal cells that mediate the migration of CXCR5+ cells into lymphoid follicles. Moreover, overexpression of CXCL13 causes the formation of ectopic lymphoid tissue [19]. In our study, CXCL13 and Tfh cells only modestly correlated with the presence of CD21+ ELSs. This may be partly due to the fact that quantification of CD21+ FDCs is difficult, but on the other hand, increased CXCL13 and Tfh cells were also observed in patients that completely lacked CD21+ ELSs. In these patients, increased cellular infiltrates and B cell hyperactivity were also observed. These observations could be explained by the production of CXCL13 by other cells such as monocytes/macrophages, antigen-experienced T cells and Tfh cells [13, 16, 20, 21]. This could subsequently facilitate Tfh-driven B cell activation in the absence of ELSs. Although other T cell–driven processes could play a role, the present data suggest that CXCL13/Tfh-driven immune responses could contribute to B cell hyperactivity and potentially lymphoma in the absence of ELSs/germinal centres [22]. This could also help to explain some of the inconsistencies in the literature on the association of ELSs in salivary glands as an important prognostic factor for developing lymphoma in pSS patients [23–26].
In conclusion, ECC is a robust method to quantify immune cell subsets in salivary gland biopsies from sicca patients and this novel tool could be valuable in studying immunopathology and could aid in diagnostics, prognostics and monitoring of therapy responses in clinical trials in the future.
Acknowledgements
We would like to thank the pathology department of UMC Utrecht for providing tissue samples and Roel Broekhuizen and Jessica Neisen (GlaxoSmithKline) for assistance in IHC, Rina Wichers for help with RNA and DNA isolations, Barbara Giovannone for assistance in cutting salivary gland tissues, Marion Wenting-van Wijk for IHC assistance and USEQ (Utrecht sequencing facility) for RNA sequencing.
Funding: This work was funded in part by GlaxoSmithKline, including the ECC that was performed by Epiontis. This work was also supported by the Dutch Arthritis Association and has received funding from the European Union’s Horizon 2020 research and innovation programme under grant agreement 731944 (HarmonicSS project).
Disclosure statement: TR is a principal investigator in the Immune catalyst programme of GlaxoSmithKline, which is an independent research programme. He did not receive any other financial support other than the research funding for the current project. The other authors have declared no conflicts of interest.
References
Author notes
Sofie L.M. Blokland and Fréderique M. van Vliet-Moret contributed equally. Joel. A.G. van Roon and Timothy R.D.J. Radstake contributed equally.

Comments