


Abstract
Conventional radiography is key to assessing AS-related spinal involvement and has become increasingly important given that spinal fusion may continue under biologic therapy. We aimed to compare the reliability of radiographic scoring of the spine by using different approaches to understand how different readers agree on overall scores and on individual findings.
Six investigators scored 68 plain radiographs of the cervical and lumbar spine of 34 patients with a 2-year interval, for erosions, sclerosis, squaring, syndesmophytes and ankyloses using the Spondyloarthritis Radiography (SPAR) module. The intraclass correlation coefficients were calculated compared with two gold standards. The reproducibility of each finding in 1632 vertebral corners and new syndesmophytes in each corner was calculated by kappa analysis and positive agreement rates.
The intraclass correlation coefficients mostly revealed good to excellent agreement with the gold standards (0.69–0.95). The kappa analysis showed worse agreement, being relatively higher for syndesmophytes (0.163–0.559) and ankylosis (0.48–0.95). Positive agreement rates showed that erosions were never detected at the same vertebral corner by two readers (positive agreement rate: 0%). The mean (range) positive agreement rates were 10.1% (0–27.7%) for sclerosis and 19.2% (0–59.7%) for squaring, and were higher for syndesmophytes [38.8% (21.4–62.5%)] and ankylosis [77.3% (64–95.3%)].
Our results show that there is a poor agreement on the presence of grade 1 lesions included in the Modified Stoke Ankylosing Spondylitis Spine Score—mostly for erosions and sclerosis—which may increase the measurement error. The currently used definitions of reliability have a risk of overestimating reproducibility.
Rheumatology key messages
Measurement error is an important concept when assessing radiographic outcome in AS.
The methods currently used may overestimate reproducibility in radiographic scoring of the spine in AS.
Poor reliability of radiographic scores is a barrier to understanding the efficacy of therapies for preventing AS progression.
Introduction
Conventional radiography is the main imaging modality used to assess damage in the spine of patients with AS. Various scoring methods have been developed for that purpose [1–4]. Within these scoring methods, the Modified Stoke Ankylosing Spondylitis Spine Score (mSASSS) has been endorsed by the OMERACT group as being more sensitive to change, and is therefore more commonly used in clinical trials [5]. This scoring method involves the assessment of the cervical (C) and lumbar (L) spine and excludes the thoracic (T) spine for its limited visibility. Only the anterior corners of 2nd cervical vertebra at the lower corner to first thoracic vertebra at the upper corner and from lower corner of the 12th thoracic vertebra to sacrum are assessed for the presence of erosions, squaring and sclerosis (score of 1), syndesmophytes (score of 2) and bridging (score of 3). The sum of these 24 corners gives the final mSASSS value with a potential range of 0–72.
There have been previous studies describing the validation of the mSASSS to test its reliability and sensitivity to change. For reliability, studies mostly used the intraclass coefficient (ICC) method where interobserver reliability between readers or intraobserver for one or more readers was analysed for both status scores (mSASSS scores at baseline or follow-up assessment) and change scores (reliability to detect change over time—ICC of delta mSASSS values). These studies usually demonstrated excellent agreement according to the ICC values for status scores (ICC values between 0.91 and 0.99) and fair to excellent for change scores (between 0.58 and 0.86 in some of the studies [6, 7], but some studies have reported much lower reliability with ICC values of 0.32 and 0.33 [8, 9].
Other groups have described further definitions for reliability of change over time. For example, if two readers found exactly the same change in mSASSS score as an absolute value, this was considered complete agreement, whereas if there was 1 or 2 U of difference for the whole mSASSS, this was considered minor disagreement and differences more than that were considered major disagreement [4, 10, 11]. According to this categorization, around 20% of readers in different studies seemed to have disagreement in change scores despite the excellent ICC values (ICC: 0.95) [4, 11].
In longitudinal studies, two types of definitions have been used in order to define progression: an increase in mSASSS (any progression or an increase of 2 U or more over 2 years) and the development of new syndesmophytes. A very important aspect when assessing progression is to demonstrate that the measured difference is a true difference. This is particularly important in AS because the degree of progression is slow with average progression of only 1 mSASSS unit being observed over 2 years in several extension phases of clinical trials. With the realization that anti-TNF therapy can abrogate inflammation but may not stop new bone formation and with the advent of novel biologic and small molecules for the treatment of AS, the ability to accurately measure new bone formation is clinically relevant.
The smallest detectable change (SDC) is a measure of the variation due to measurement error meaning a change score can only be attributed as a real change if it is larger than the SDC. When the change is defined as any increase in mSASSS scores, it is important that every finding included in mSASSS is reliably detected—as the definition of progression may be based on the new occurrence of sclerosis, squaring or erosions. To our knowledge, the agreement on individual findings has not been systematically assessed so far. In this study, we aimed to compare the reliability of radiographic scoring of the spine by using different approaches to understand how different readers agree on overall scores, the presence of positive findings for assessments at the level of individual vertebral corners and the agreement on individual findings. The ultimate goal is to elucidate interpretational differences in the statistical measures that are commonly applied in reproducibility studies.
Methods
The Spondyloarthritis Radiography (SPAR) module was used for the purpose of the study (www.carearthritis.com). The module has been extensively described before [12]. Briefly, the primary objective of the module was to develop and undertake preliminary validation of a reference and training module for the mSASSS that addresses gaps in the current understanding of lesions observed on radiography in spondyloarthritis (SpA), providing consensus definitions, details of scoring methodology and reference images, including lesions at the threshold of detection. The radiographs were all obtained from patients with AS in the same institute by using the same methodology. For the purpose of the current study, six SpA investigators went through the SPAR training module, which includes both a PowerPoint module with standardized descriptions and examples of radiographic lesions and a set of reference cases based on Digital Imaging and Communication in Medicine (DICOM) scored by expert readers and used to facilitate calibration with less experienced readers. These readers were all rheumatologists with a special interest in SpA and were familiar with the mSASSS. The readers scored 68 plain radiographs of the cervical and lumbar spine of 34 patients at two time points with a 2-year interval.
The anterior vertebral corners in lateral images of the cervical and lumbar spine were scored for erosions, sclerosis, squaring, syndesmophytes and ankylosis, blinded to the time sequence, and a total score was calculated. Of note, erosions, sclerosis and squaring are not scored in the C-spine in the SPAR module according to a consensus of the authors of this module because either such lesions in the cervical spine constitute normal appearances (squaring) or because such lesions occur infrequently (sclerosis, erosion) and/or have not been shown to be reliably detected (erosion, sclerosis). Therefore the presence of erosions, sclerosis and squaring were only compared with the gold standards in the lumbar spine. As the overall score may not be exactly the same as with the mSASSS, the total score obtained in this study was renamed as the reduced mSASSS (RemSASSS) for clarification, for which the range is still 0–72.
These images were previously scored by two gold standard readers, a rheumatologist (W.M.) and a radiologist (R.G.L.) who have been scoring the mSASSS for >10 years and scored the reference images created for calibration of readers using the SPAR module. Ethics approval was obtained from the Health Research Ethics Board of the University of Alberta and all patients gave informed consent.
Statistics
The mean (s.d.) values of baseline and follow-up assessments are given separately for each reader and the gold standards. The coefficients of variation (s.d./mean) were calculated. The frequency of each finding according to the two gold standards was assessed descriptively. The ICC values between the six readers and two gold standards were compared and interpreted as excellent, very good, good and poor, being ICC values of >0.90, 0.80–0.90, 0.60–0.79 and <0.60, respectively.
To understand the reproducibility of each individual finding, each individual vertebral corner was also compared for all abnormalities in a total of 1632 vertebral corners. We employed Cohen’s κ to estimate the reliability among raters for that purpose. We also tested the null hypothesis of kappa being equal to zero (there is no more agreement than might occur by chance given random guessing). All of our tests rejected this hypothesis with a P-value of approximately zero, that is, the agreement among raters is significant. We interpreted the kappa scores below according to the following rules established by Landis: 0: no agreement; 0–0.2: slight agreement; 0.2–0.4: fair agreement; 0.4–0.6: moderate agreement; 0.6–0.8: substantial agreement; 0.8–1.0: almost perfect agreement; and 1.0: perfect agreement [13].
where a is the number of cases where both readers agree on the presence of a finding, and b and c are the number of cases where the presence of a finding is only observed by one reader.
For reliability of change scores, the ICC values for ΔRemSASSS (change in RemSASSS) scores were calculated among the six readers and the two gold standards. The complete agreement and minor and major disagreement rates were also calculated as defined by Baraliakos et al.: agreement was no difference between the two readers in the change in mSASSS between time points; some disagreement was defined as a difference of ⩽2 mSASSS units; and major disagreement was defined as a difference of >2 U in the change in mSASSS between time points [4, 11].
R 3.0.1 was used for statistical analysis.
Results
Patients had a mean (s.d.) age and disease duration of 41.9 (13.01) and 15 (10.3) months, respectively. There were 31 males and 3 females. The mean (s.d.) RemSASSS scores of both status and change scores are given in Fig. 1. For status scores the coefficients of variation were between 0.97 and 1.27 for gold standards and between 0.86 and 1.8 for readers 1–6. For change scores, the coefficients of variation were 1.23 and 1.31 for gold standards and between 1.18 and 2.45 for readers 1–6.
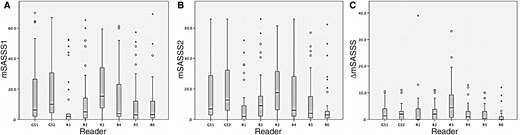
Mean (s.d.) reduced modified stoke AS spinal scores of baseline and follow-up
(A) RemSASSS values of the baseline visit; (B) RemSASSS values of the follow-up visit; (C) ΔRemSASSS between the two assessments. RemSASSS: Reduced Modified Stoke AS Spinal Scores; C: change; GS: gold standard; R: reader.
The frequency of radiographic findings
According to the first gold standard reader, erosions were never detected in the lumbar spine (n = 0, 0% for both first and second time point radiographs), and sclerosis (first time point n = 0, 0%; second time point n = 1, 0.2%) and squaring (n = 31, 7.6%; n = 31, 7.6%) were rare lesions. The frequency of the syndesmophytes (n = 91, 11.2%; n = 98, 12%) and ankylosis (n = 100, 12.3%; n = 112, 13.7%) in the cervical and lumbar spine were higher. According to the second gold standard reader, the frequency of radiographic features assigned a score of 1 were similarly low (erosions: n = 1, 0.2%; n = 1, 0.2%; sclerosis: n = 23, 5.6%; n = 22, 5.3%; squaring: n = 25, 6.1%; n = 28, 6.8%) compared with syndesmophytes (n = 142, 17.4%; n = 149, 18.3%) and ankylosis (n = 86, 10.5%; n = 96, 11.8%).
Reliability and agreement on status scores
The reliability analysis using ICC revealed that all readers had good to excellent agreement on status scores with both gold standard readers with the exception of the first reader who had poor agreement with the second gold standard reader (ICC: 0.593) (Table 1).
The intraclass coefficients for baseline, follow-up visits and change in reduced modified stoke AS spinal score
| Reader | vs gold standard | Rem SASSS1 | Rem SASSS2 | Change in Rem SASSS |
|---|---|---|---|---|
| Reader 1 | I | 0.859 | 0.692 | 0.295 |
| II | 0.783 | 0.593 | 0.233 | |
| Reader 2 | I | 0.921 | 0.934 | 0.748 |
| II | 0.887 | 0.908 | 0.705 | |
| Reader 3 | I | 0.877 | 0.858 | 0.126 |
| II | 0.919 | 0.862 | 0.165 | |
| Reader 4 | I | 0.946 | 0.948 | 0.814 |
| II | 0.933 | 0.936 | 0.741 | |
| Reader 5 | I | 0.875 | 0.888 | 0.602 |
| II | 0.818 | 0.822 | 0.482 | |
| Reader 6 | I | 0.825 | 0.713 | −0.160 |
| II | 0.760 | 0.640 | −0.197 | |
| Gold standard I | II | 0.957 | 0.958 | 0.903 |
I: 1st gold standard; II: 2nd gold standard; RemSASSS: reduced modified stoke AS spinal score.
The kappa agreement among readers and the gold standard readers for different lesions ranged from no agreement to almost perfect agreement (Table 2). Specifically for radiographic features assigned a score of 1, agreement for sclerosis (κ: −0.023, 0.268), squaring (−0.029, 0.529) and erosions (−0.007, 0.218) was no agreement to moderate. For syndesmophytes, agreement was slight to moderate (0.163–0.559). The highest kappa values were most frequently detected for ankylosis in a range between substantial to almost perfect agreement (0.583–0.949) (Table 2).
Kappa values were calculated for individual lesions among different readers and gold standards
| Reader | Sclerosis | Squaring | Erosions | Syndesmophytes | Ankylosis |
|---|---|---|---|---|---|
| Reader 1 | 0.06 (−0.01, 0.20) | −0.01 (0.01, 0) | 0 (0, 0) | 0.33 (0.18, 0.41) | 0.64 (0.58, 0.77) |
| Reader 2 | 0.13 (−0.01, 0.16) | 0.11 (0, 0.19) | 0.05 (−0.005, 0.22) | 0.36 (0.32, 0.40) | 0.74 (0.66, 0.83) |
| Reader 3 | 0.09 (−0.01, 0.27) | 0.18 (0.03¸0.29) | −0.004 (−0.004, −0.002) | 0.38 (0.34, 0.41) | 0.57 (0.48, 0.67) |
| Reader 4 | 0.02 (−0.02, 0.12) | 0.45 (0.38, 0.53) | −0.003 (−0.005, −0.002) | 0.47 (0.40, 0.56) | 0.82 (0.73, 0.95) |
| Reader 5 | 0.10 (−0.01, 0.26) | −0.01 (−0.02, −0.01) | −0.001 (−0.003, −0.002) | 0.25 (0.20, 0.32) | 0.76 (0.69, 0.83) |
| Reader 6 | 0.09 (−0.01, 0.22) | 0.13 (0.11, 0.15) | −0.006 (−0.008, −0.004) | 0.20 (0.16, 0.25) | 0.73 (0.64, 0.84) |
| Gold standard 1 vs 2 | 0.01 (−0.01, 0.06) | 0.38 (0.32, 0.40) | −0.003 (−0.003, −0.003) | 0.37 (0.26, 0.42) | 0.82 (0.82, 0.83) |
The values are the mean (range) κ calculated for the readers compared with gold standards 1 and 2 including first and second pair of radiographs.
The positive agreement rates for detecting the same abnormality by different readers and the gold standard readers are presented in Table 3 and an example of disagreement is given in Fig. 2. The positive agreement rates showed that erosions were never detected at the same vertebral corner by two readers (positive agreement rate of 0%). The mean (range) positive agreement rates for sclerosis was 10.1% (0–27.7%) and for squaring 19.2% (0–59.7%). The positive agreement was higher for syndesmophytes [38.8% (26.2–62.5%)] and highest for ankylosis [77.3% (64–95.3%)].
Positive agreement rates for individual lesions among different readers and gold standards
| Reader | vs Goldstandard | Sclerosis | Squaring | Erosions | Syndesmophytes | Ankylosis |
|---|---|---|---|---|---|---|
| Reader 1 | I | 0 | 0 | 0 | 45.5 | 65.9 |
| II | 15.1 | 0 | 0 | 29.0 | 72.0 | |
| Reader 2 | I | 0 | 15.9 | 0 | 40.7 | 72.7 |
| II | 22.8 | 12.7 | 0 | 43.5 | 84.6 | |
| Reader 3 | I | 0 | 27.2 | 0 | 42.6 | 67.2 |
| II | 23.1 | 21.2 | 0 | 47.8 | 64.0 | |
| Reader 4 | I | 0 | 59.7 | 0 | 62.5 | 85.4 |
| II | 10.0 | 48.7 | 0 | 49.3 | 95.3 | |
| Reader 5 | I | 0 | 0 | 0 | 35.6 | 76.2 |
| II | 23.0 | 0 | 0 | 26.2 | 83.3 | |
| Reader 6 | I | 0 | 23.4 | 0 | 21.4 | 75.8 |
| II | 27.7 | 21.5 | 0 | 21.6 | 85.7 | |
| Gold standard I | II | 4.3 | 43.4 | 0 | 47.2 | 87.8 |
Numbers are given as percentages.
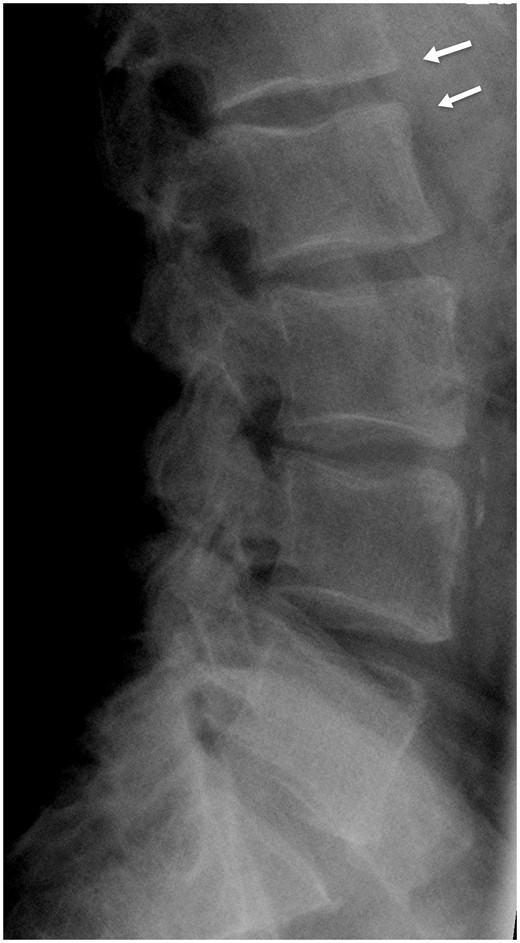
The lateral radiograph of the lumbar spine of a patient from the dataset
The vertebral corners with arrow (L1 lower, L2 upper) were scored as having syndesmophytes according to one of the gold standards with score 2 on both L1 lower and L2 upper corners (arrows) whereas being normal on both corners according to the second gold standard.
Finally the positive agreement among the two gold standard readers was calculated. It was seen that both gold standard readers also had no agreement on the presence of erosions (0%) and very low agreement on the presence of sclerosis (4.3%), although agreement was somewhat better for squaring (43.4%). Between the experts, the positive agreement rates among the gold standard readers was best for syndesmophytes (47.2%) and ankylosis (87.8%).
Longitudinal changes in different RemSASSS components
For the change scores, the ICC values were highly variable. When compared with the expert readers, three readers had lower ICC values for change scores (readers 1, 3 and 6) in a range between 0.13 and 0.60 whereas the other three had higher ICC values (0.71–0.81) (Table 1). For the level of agreement, complete agreement rates ranged from 9.7–35.3% and a range of minor disagreement in 16.1–32.4% and major disagreement in 44.1–74.2%. The gold standards had higher complete agreement rates with each other (44.2%) and minor disagreement was observed in 32.4% and major disagreement in 23.5%.
There was variation for SDCs among readers (Table 4): the SDCs of readers 1–6 were in a range between 1.7 and 7.2. The SDC of the two gold standards was 1.06.
Smallest detectable change, κ values and positive agreement rates for new syndesmophytes
| Rater | vs Gold standard | SDC | Kappa for presence of new syndesmophytes | Positive agreement rates (%) |
|---|---|---|---|---|
| Reader 1 | I | 4.85 | 0.24 | 30.8 |
| II | 5.13 | 0.18 | 8.33 | |
| Reader 2 | I | 1.87 | 0.32 | 33.3 |
| II | 2.04 | 0.37 | 34.3 | |
| Reader 3 | I | 7.19 | 0.11 | 15.8 |
| II | 7.03 | 0.32 | 45.8 | |
| Reader 4 | I | 1.65 | 0.41 | 35.3 |
| II | 1.96 | 0.32 | 28.6 | |
| Reader 5 | I | 2.31 | 0.11 | 20.0 |
| II | 2.66 | 0.23 | 32.3 | |
| Reader 6 | I | 3.27 | −0.011 | 0.00 |
| II | 3.37 | 0.053 | 0.00 | |
| Gold standard I | II | 1.06 | 0.36 | 41.4 |
Positive agreement rates are given as percentages. SDC: smallest detectable change.
The agreement on new syndesmophytes
Each vertebral corner was compared if there was a new syndesmophyte that was not seen before, by each of the readers and the gold standards. The kappa values showed a slight to fair agreement for most of the comparisons between different pairs, including the gold standards where the kappa value was 0.355. The positive agreement rates for new syndesmophytes were between 0 and 45.8%. The positive agreement rates between the gold standards were also 41.4% (Table 4).
Discussion
The present study shows that despite the excellent ICC values observed in mSASSS scores in different studies in AS, it is possible that the investigators may not be detecting radiographic lesions similarly, especially erosion, sclerosis and squaring. This information is important as progression has been defined as any progression in mSASSS according to some studies, despite the lack of agreement on the presence of a score of 1, especially in the biologic therapy era to ascertain the relative efficacy or otherwise of new therapies for AS with respect to effects on new bone formation.
ICC is directly proportional to between-subject variability in parameter scores and is inversely proportional to between-rater variability. Therefore, ICC would give accurate estimates of the rater agreement when applied to a homogeneous sample. The high coefficient of variations in our study supports the high variability among patients that as a result leads to ICC overestimating the agreement among raters, mainly for the status scores.
Although Cohen’s κ has been widely used to measure inter-rater reliability, it can be problematic in certain situations as it is affected by the level of disagreement between observers (the bias problem) and by the skewed distribution of categories (the prevalence problem). These two problems are very well studied in the literature [17, 18]. Our data are compatible with the previous literature about the low prevalence of grade 1 lesions, which on its own is known to influence the kappa statistics. Considering the limitations of κ statistics, in our perspective, the κ analysis should not be the method of choice to test the reliability of radiographic changes in the spine in SpA.
Overall agreement rates do not consider the prevalence of radiographic findings. In a scoring method such as the mSASSS, where the prevalence of erosions, sclerosis and squaring is remarkably low, overall agreement rates overestimate agreement. Positive agreement rate is a more appropriate way to truly reflect how different readers agree on the presence of a particular lesion in that condition.
In order to be able to detect progression, a scoring method should be sensitive to change and reliably measured at the same time. Which items need to be put in an index depends on (i) the frequency, (ii) the clinical and pathophysiological significance and (iii) reproducibility of the item. The present study shows that the frequency of radiographic features scoring 1 in the lumbar spine for mSASSS was very low, between 0 and 3.8%, which is similar to the data from the OASIS database [19]. In the latter study, erosions and sclerosis but not squaring were found to have prognostic value in terms of progression. This latter study assessed radiographs in known time sequence and so incurred potential bias in the detection of associations between radiographic lesions at different time points. Despite their prognostic value, our study shows that erosions and sclerosis are not reliably detected, which raises concerns regarding their inclusion in an index. Although not tested in a detailed manner, the lack of agreement on grade 1 lesions can also be seen in previous studies. In the OASIS cohort, two readers found similar numbers of cases with at least one syndesmophyte at baseline (47 vs 58%) whereas the number of cases having a score of 1 in at least one vertebral corner was remarkably different (9 vs 48%) [20].
Data support that investigators find it difficult to agree on the presence of erosions, sclerosis and squaring. Maksymowych et al. [12] used the definition ‘loss of concavity of the anterior cortex of the vertebral body on a lateral radiograph of the spine’ for squaring, which might have increased the agreement among different readers. However, vertebrae do not have exactly the same shape and so differentiation from normal will vary accordingly. Sclerosis is frequently difficult to evaluate due to overlapping structures while syndesmophytes are often small and require different window settings for optimal visualization in different regions of the spine. This is especially true for interpreting L5 S1 vertebral corners as the iliac bone overlaps with this intervertebral space and we have observed many discrepancies at this location in our study as well as vertebral corners at T12–L1.
Previous studies showed that SDCs for mSASSS are between 1.1 and 2.9 [4, 20–23]. Our study showed the SDCs calculated according to the scores of four readers (readers 2, 4, 5 and 6) were comparable to the literature (1.7–3.37) whereas the other two readers had higher SDCs (4.9–7.2). According to these results, a 1 U increase in mSASSS (as used as a definition for progression by some studies) can be due to measurement error. The other definition, an increase of 2 U or more in mSASSS, can still be due to a measurement error according to the SDC values calculated in the studies by Ramiro et al. as well as some readers in our study [20, 21]. Another important finding is the variation between SDCs. The differences among different readers in our study can be due to the differences in their experience. However, it is difficult to measure the level of experience, as the agreement did not correlate with the years of experience in rheumatology or in the field of SpA. This also indicates that SDCs need to be calculated for every reader pair separately before concluding that the observed change in mSASSS is a true difference.
Radiographic assessment remains the primary outcome to test the efficacy of treatments in AS. Based on the lack of a significant difference among anti-TNF treated patients and the historical OASIS cohort, it was argued that despite their clinical efficacy, anti-TNF drugs did not seem to have a positive effect on radiographic progression. However, slow progression of disease has been shown in various studies, the maximum progression rate in mSASSS being 1.3 U over 2 years [24]. Consequently, demonstration of efficacy by any drug requires demonstration of a progression rate less than this [25]. Our results show that, with the lack of agreement on grade 1s, the risk of measurement error may be substantial. Certain steps should be taken in order to address the limitations of the mSASSS. One of these would be standardized definition for the radiographic findings to limit subjectivity in interpretation. One of the purposes of the SPAR module was to provide this standardization and the readers in the current study scored the images after undergoing standardization with the module, which may have improved the scoring but still proved insufficient. Our data show that even after the standardization with the SPAR module, the agreement on grade 1 lesions is not acceptable. Low dose CT is being evaluated and validated as an alternative to evaluate damage, especially in the context of clinical trials.
In conclusion, measurement error is an important concept when assessing radiographic outcome in AS and the currently used definitions of reliability carry a risk of overestimating reproducibility due to the high variability of the score. Although mSASSS is the best validated tool available and probably the best option to be used in clinical trials for today, our findings point towards the need for further modification and subsequent validation of the mSASSS for the accurate evaluation of the effectiveness of therapies in AS.
Funding: No specific funding was received from any bodies in the public, commercial or not-for-profit sectors to carry out the work described in this manuscript.
Disclosure statement: W.M. has received consulting and/or speaker fees and/or grants from AbbVie, Amgen, Eli-Lilly, Janssen, Merck, Novartis, Pfizer, Sanofi and UCB Pharma. S.Z.A. received a research grant form Abbvie and speakers fee and honoraria from Abbvie, Novartis, UCB and Pfizer. All other authors have declared no conflicts of interest.

Comments