


Abstract
The five-factor model (FFM) is a widely used taxonomy of human personality; yet its neuro anatomical basis remains unclear. This is partly because past associations between gray-matter volume and FFM were driven by different surface-based morphometry (SBM) indices (i.e. cortical thickness, surface area, cortical folding or any combination of them). To overcome this limitation, we used Free-Surfer to study how variability in SBM measures was related to the FFM in n = 507 participants from the Human Connectome Project.
Neuroticism was associated with thicker cortex and smaller area and folding in prefrontal–temporal regions. Extraversion was linked to thicker pre-cuneus and smaller superior temporal cortex area. Openness was linked to thinner cortex and greater area and folding in prefrontal–parietal regions. Agreeableness was correlated to thinner prefrontal cortex and smaller fusiform gyrus area. Conscientiousness was associated with thicker cortex and smaller area and folding in prefrontal regions. These findings demonstrate that anatomical variability in prefrontal cortices is linked to individual differences in the socio-cognitive dispositions described by the FFM. Cortical thickness and surface area/folding were inversely related each others as a function of different FFM traits (neuroticism, extraversion and consciousness vs openness), which may reflect brain maturational effects that predispose or protect against psychiatric disorders.
Introduction
In recent years, there has been a growing interest in personality neuroscience, an emergent field of research exploring how the extraordinary variety of human behaviors arise from different patterns of brain function and structure (DeYoung, 2010; Booth et al., 2014).
Currently, the ‘Big Five’ or five-factor model (FFM) represents a widely used taxonomy of personality and this is because a large number of studies have converged on the conclusion that five traits (i.e., neuroticism, extraversion, openness, agreeableness, and conscientiousness) represent key descriptors of human behavioral dispositions (Digman, 1990; McCrae, 1991; McCrae and John, 1992). Nevertheless, the relationship between individual differences in FFM traits and variability in brain function and structure remains elusive and poorly characterized.
To achieve a step change in the field, it is necessary to link the enduring personality factors described in the FFM with reliable markers of brain function and structure. An emerging body of research using functional and structural neuroimaging measures has begun to tackle this issue, although the results across studies have been fragmented (e.g. different studies have not systematically assessed the brain correlates of all the FFM traits) or even conflicting (Canli et al., 2002; Omura et al., 2005; Cremers et al., 2010, 2011; DeYoung et al., 2010; Suslow et al., 2010; Hu et al., 2011; Kapogiannis et al., 2012; Taki et al., 2012; Coutinho et al., 2013; Liu et al., 2013; Lu et al., 2014; Servaas et al., 2014,, 2015; Lewis et al., 2016).
For example, opposite results have been reported for the same regions (e.g. the volume of the posterior cingulate cortex has been either positively or negatively associated to agreeableness) (DeYoung, 2010; Coutinho et al., 2013) or different brain areas have been linked to the same trait (e.g. both positive and negative correlations have been found between extraversion and the para-hippocampal cortex (Omura et al., 2005; Lu et al., 2014), amygdala (Cremers et al., 2011; Lu et al., 2014), or orbitofrontal cortex (Omura et al., 2005; DeYoung, 2010; Cremers et al., 2011; Coutinho et al., 2013).
Two factors appeared critical in determining part of the variability of the results amongst earlier reports. First, many of the previous studies were based on small samples (e.g. n∼20 participants represent the typical sample size in functional neuroimaging studies, while n∼60 participants are more characteristic in structural studies). Second, some of the past studies included heterogeneous samples of participants—e.g. with notable within-group differences in age, which in itself may have significantly influenced the results due to the well-known effects of aging on brain function and structure. Together, these limitations may have affected the replicability of the findings and/or the statistical power to detect statistically significant effects.
Furthermore, the majority of previous studies assessing the neuro anatomical basis of the FFM used voxel-based morphometry (VBM) to identify the gray-matter changes associated with the FFM personality traits (Omura et al., 2005; Blankstein et al., 2009; DeYoung et al., 2010; Hu et al., 2011; Kapogiannis et al., 2012; Taki et al., 2012; Coutinho et al., 2013; Liu et al., 2013; Lu et al., 2014). Overall, VBM findings are difficult to interpret as they may be driven by differences in cortical thickness, surface area (SA), cortical volume, and folding or any combination of these measures (Voets et al., 2008; Hutton et al., 2009). In other words, while classical morphometry methods like VBM use image intensities to provide a composite measure of apparent gray-matter density and/or volume, they are not able to separate the geometrical basis that underlies such changes in the cortex. This means that variations in the local gray-matter density may be due to a regional variation in thickness only, SA only, or any possible combination of these measures. Furthermore, the apparent gray-matter density measured via VBM may be influenced by the local gyrification index (i.e., cortical folding) (Hutton et al., 2009), a further confounding dimension that cannot be extracted without an explicit reconstruction of the cortical geometry.
Surface-based morphometry (SBM) methods enable researchers to overcome these limitations and disentangle cortical thickness, SA, and folding to examine how each of these indices contributes to variability in cortical anatomy. SBM analyses are also well suited to investigate the neuroimaging correlates of genetic factors that may act early during brain maturation and may consequently play a role in shaping FFM personality traits (Winkler et al., 2010). This is important as cortical thickness, SA, and folding are thought to have distinct developmental trajectories and cellular mechanisms (Rakic, 2009; Raznahan et al., 2011). In particular, cortical thickness is determined by the horizontal layers in the cortical columns, while SA reflects the number of radial columns perpendicular to the pial surface (Rakic, 2009). Conversely, the folding patterns at the brain’s surface relate to the microstructure of the neuronal sheets, although the local connectivity within a cortical region may also determine its degree of folding (Zilles et al., 1989). Overall, considering their differential sensitivity to genetic and developmental factors across the entire cortex, SBM metrics can provide useful information about the association between brain maturation and individual differences in the FFM personality traits.
Compared to several studies using VBM (Omura et al., 2005; Blankstein et al., 2009; DeYoung et al., 2010; Hu et al., 2011; Kapogiannis et al., 2012; Taki et al., 2012; Coutinho et al., 2013; Liu et al., 2013; Lu et al., 2014), only three studies thus far have used SBM methods to investigate how variability in cortical anatomy relates to the FFM (Wright et al., 2007; Holmes et al., 2012; Bjornebekk et al., 2013). The first study was conducted in a sample of n = 29 old adults (age-range: 61–84 years) and found that the thickness in the lateral prefrontal cortex (PFC) was positively correlated with extraversion and negatively with neuroticism (Wright et al., 2007). These data suggested that neuroticism and extraversion may have an opposite impact on age-related structural changes in the PFC (Wright et al., 2007). A second study, in a sample of n = 1050 healthy individuals aged 18–35 years, assessed only cortical thickness and negative affect (a measure closely related to the FFM trait of neuroticism) and found that this personality trait was associated with decreased thickness in the subgenual and rostral anterior cingulate cortex, which is consistent with the role of these regions in modulating the risk of developing depressive disorders (Holmes et al., 2012). A more recent study in n = 265 people (age-range: 20–85 years) reported that neuroticism was linked to reduced SA in fronto-temporal regions (Bjornebekk et al., 2013). Higher scores on extraversion were also associated with thinner inferior frontal gyrus, while conscientiousness was negatively related to SA in the temporal–parietal junction (Bjornebekk et al., 2013). Finally, no statistically significant associations were found between agreeableness and openness and any of the SBM metrics examined (Bjornebekk et al., 2013).
In the present study, we investigate the neuro-anatomical basis of the FFM in a large, homogeneous, and well-characterized samples of healthy and young participants drawn from the Human Connectome Project (n = 507, age-range: 22–36 years) (McNab et al., 2013). By employing a validated analytical method (i.e., SBM), our study aimed at providing a rigorous test of the links between the five major dimensions of personality and four measures of brain cortical anatomy. More specifically, we examined how individual differences in neuroticism, extraversion, openness, agreeableness, and conscientiousness were associated with local variability in cortical thickness, SA, cortical volume (defined as the product of cortical thickness and SA), and folding.
One of the main hypotheses (based on previous relevant studies) was that neuroticism should be associated with individual differences in SBM measures in PFC and temporal areas (Holmes et al., 2012; Bjornebekk et al., 2013), while extraversion should correlate with SBM metrics in the PFC (Bjornebekk et al., 2013). Finally, we predicted that conscientiousness was linked to variations in cortical anatomy in PFC and parietal regions that belong to the multiple demand system (DeYoung, 2010; Kapogiannis et al., 2012; Duncan, 2013; Forbes et al., 2014; Dima et al., 2015; Rodrigo et al., 2016).
Participants and methods
Human connectome project (HCP) dataset
The Human Connectome Project (HCP) public dataset includes high-resolution Magnetic Resonance Imaging (MRI) scans from healthy adults that completed several sessions of brain scanning including different MRI modalities. Pre-processed structural MRI (sMRI) as well as demographic, clinical and personality data from 507 participants from the ‘500 Subjects release’ were obtained from the HCP public repository (http://www.humanconnectome.org/documentation/S500/HCP_S500+MEG2_Release_Reference_Manual.pdf)
Participants
All participants were young and healthy adults (60% females; mean-age: 29.2 years; age-range: 22–36 years) with no obesity, hypertension, alcohol or tobacco misuse, anxiety, depressive or other psychiatric and neurologic disorders, or history of behavioural problems during childhood (e.g. conduct disorder). The majority of the participants were right-handed white Americans with a non-Hispanic or Latinos background (Table 1).
Demographic and clinical data of the sample (N = 507 participants, 300 females)
| 1st quartile | Median | 3rd quartile | |
|---|---|---|---|
| Age (years) | 27 | 29 | 32 |
| Education (years) | 13 | 16 | 16 |
| Height (cm) | 162.5 | 167.5 | 175 |
| Weight (kg) | 61.1 | 71.1 | 83.2 |
| Body mass index | 22.8 | 25.4 | 29.2 |
| Blood pressure (systolic, mmHg) | 114 | 123 | 133 |
| Blood pressure (diastolic, mmHg) | 71 | 78 | 84 |
| Number of childhood conduct problems | 0 | 0 | 1 |
| Number of panic disorder symptoms | 0 | 0 | 0 |
| Number of depressive symptoms | 0 | 0 | 0 |
| Number of cigarettes per week | 0 | 0 | 0 |
| Number of drinks per week | 0 | 2 | 7 |
| Race (%) | Asian/Natural Hawaiian/Other Pacific: 1.8% | ||
| Black or African American: 18.9% | |||
| White: 68.4% | |||
| More than one: 1.2% | |||
| Unknown or not reported: 1.8% | |||
| Missing data: 7.9% | |||
| Ethnicity (%) | Hispanic/Latino: 9.7% | ||
| Not Hispanic/Latino: 82.2% | |||
| Unknown or not reported: 0.2% | |||
| Missing data: 7.9% | |||
| Handedness (%) | Right handed: 75.7% | ||
| Left handed: 6.5% | |||
| Mixed: 9.9% | |||
| Missing data: 7.9% | |||
MRI scanning, MRI data quality control, and pre-processing
HCP sMRIs were collected from a 3-Tesla Siemens Skyra unit (housed at Washington University in St. Louis) using an axial T1-weighted sequence (TR = 2400 ms, TE = 2.14 ms, flip angle = 8°, voxel-size 0.7 × 0.7 × 0.7 mm3).
An experienced rater evaluated each structural scan and designated it as excellent, good, fair, poor or unusable on a 1–4 points scale based on criteria related to tissue contrast, blurriness, and banding artifacts. To be included in the HCP data release and in the structural pipeline processing, at least one T1-weighted and one T2-weighted rated as good or excellent must have been acquired in the same session (i.e. without the subject having exited the scanner). If these criteria were not met using the scans from the initial structural session, an extra-scan session was acquired during the same subject’s visit or (if necessary) during a subsequent visit. Structural images were also reviewed for incidental brain abnormalities by a neuro-radiologist. Finally, after the pipeline run, the outputs of the HCP structural pipelines were checked using the Connectome Workbench visualization software.
All pre-processing of the MRI data was done using the Version 3 of the pre-processing pipelines. These pipelines use freely available software from FSL (http://fsl.fmrib.ox.ac.uk/fsl/fslwiki/), FreeSurfer (http://surfer.nmr.mgh.harvard.edu/), and Connectome Workbench image analysis suites that are discussed in detail in Glasser et al. (2013) and in the HCP Reference Manual, Chapter 4: HCP Processing Pipeline (Jenkinson et al., 2012; Glasser et al., 2013).
Personality assessment
The FFM personality traits were assessed using the NEO-Five-Factors-Inventory (NEO-FFI) (Costa and McCrae, 1992; Terracciano, 2003). The NEO-FFI is composed of a subset of 60-items extracted from the full-length 240-item NEO-PI-R. For each item, participants reported their level of agreement on a 5-point Likert scale, from strongly disagree to strongly agree. The NEO instruments have been previously validated in USA and several other countries (McCrae and Terracciano, 2005). Past studies have found that the internal consistency of the five major traits is high and the test–retest correlations range from 0.78 to 0.85 over an average interval of 10 years (Terracciano et al., 2006). To test the internal consistency of each of the FFM personality trait in our sample (n = 507), the Cronbach’s α values were also calculated.
Cortical thickness, surface area (SA), cortical volume, and cortical folding
The cortical thickness, SA, and cortical volume were calculated using pre-processed and pre-segmented HCP data. The optimal pipeline used to obtain these segmentation is described in detail in a previous article (Glasser et al., 2013). The local gyrification index, which measures the degree of cortical folding within a sulcus vs. that outside the sulcus, was calculated according to the method described by Schaer et al. (2008). To map all subjects’ brains to a common space, reconstructed surfaces were registered to an average cortical surface atlas using a non-linear procedure that optimally aligned sulcal and gyral features across subjects (Fischl et al., 1999).
Statistical analyses
To perform vertex-by-vertex cluster analysis, the vertex-wise cortical thickness, SA, cortical volume, and local gyrification index maps for all subjects were converted to a common atlas space by applying the transformations computed in the previous step. For each hemisphere, correlations between subject-specific SBM measures at each vertex and individual scores in all of the FFM personality scores were tested using a multivariate general linear model (GLM). This way, we were able to assess the effect of each FFM trait on the SBM measures while factoring out the role driven by the remaining personality factors. The regression models also included age, total intracranial volume, and sex as covariates of no interest. To provide an estimate of effect sizes comparable across personality traits, after model fitting, regression coefficient estimates were multiplied by the relevant contrasts and divided by residual standard deviation. To control for multiple comparisons in the SBM analysis, cluster correction was completed using Monte Carlo simulation (vertex-wise cluster forming threshold of P < 0.05) at a cluster-wise P (CWP) value of 0.05.
Results
Behavioral results
The mean FFM scores as well as the maximum and minimum values are reported in Table 2. The Cronbach’s α values confirmed an acceptable or good internal consistency in each of the FFM traits.
FFM scores of the sample
| Mean | s.d. | Range | Cronbach’s α | ||
|---|---|---|---|---|---|
| Min | Max | ||||
| Neuroticism | 16.4 | 7.1 | 0 | 43 | 0.8 |
| Extraversion | 30.4 | 6.1 | 11 | 46 | 0.8 |
| Openness | 28.0 | 6.1 | 12 | 45 | 0.7 |
| Agreeableness | 31.9 | 4.8 | 14 | 44 | 0.7 |
| Conscientiousness | 34.7 | 5.7 | 12 | 48 | 0.8 |
For each trait, the mean, standard deviation (s.d.), minimum (Min) and maximum (Max) scores are reported.
Neuroimaging results for each FFM trait
Neuroticism
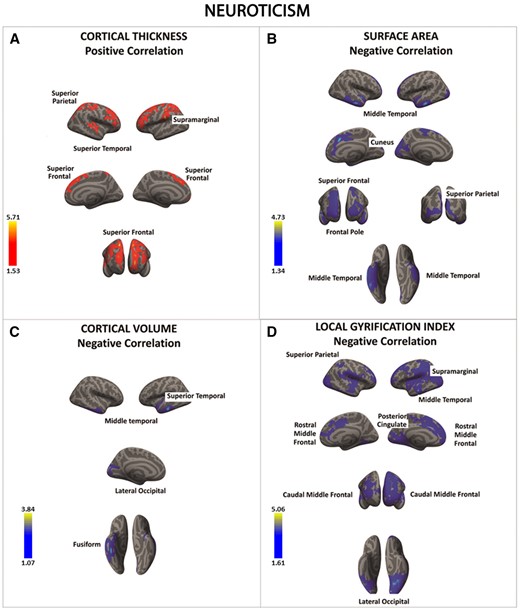
There was a significant positive association between neuroticism and cortical thickness in a series of fronto-parietal regions (regions in red) (A). In contrast, there was a significant negative association between neuroticism and surface area, cortical volume, and local gyrification index in frontal, parietal, temporal and occipital cortices (regions in blue) (B–D). Color bar: −log10 (P value).
Surface-based morphometry (SBM) results as a function of Neuroticism scores (n = 507)
| Neuroticism | ||||||||
|---|---|---|---|---|---|---|---|---|
| A. Association between neuroticism and cortical thickness (positive correlations) | ||||||||
| Cortical region | Hemisphere | Max | Size (mm2) | X | Y | Z | CWP | Effect size |
| Supramarginal | L | 4.590 | 6973.54 | −58 | −26.5 | 15.2 | 0.0001 | 0.0176 |
| Superior frontal | L | 4.065 | 13528.12 | −15.3 | 43.2 | 46.3 | 0.0001 | 0.0175 |
| R | 5.713 | 10165.41 | 16.7 | 40.8 | 44.5 | 0.0001 | 0.0181 | |
| Superior parietal | R | 4.639 | 4379.54 | 19.8 | −39.8 | 63.9 | 0.0001 | 0.0176 |
| Postcentral | R | 4.142 | 2082.04 | 46.7 | −16.4 | 57.4 | 0.0030 | 0.0170 |
| Superior temporal | R | 2.833 | 1622.64 | 69.8 | −23.7 | 2.3 | 0.0186 | 0.0161 |
| B. Association between neuroticism and surface area (negative correlations) | ||||||||
| Cortical region | Hemisphere | Max | Size (mm2) | X | Y | Z | CWP | Effect size |
| Middle temporal | L | 4.734 | 6906.27 | −64.8 | −20 | −20.3 | 0.0001 | 0.0186 |
| R | 3.816 | 9699.43 | 66.5 | −12 | −19.5 | 0.0001 | 0.0193 | |
| Rostral middle frontal | L | 2.871 | 2475.52 | −20.4 | 64.9 | 3.6 | 0.0118 | 0.0156 |
| Superior frontal | L | 2.867 | 3049.79 | −23.2 | 15.8 | 54.1 | 0.0025 | 0.0171 |
| R | 4.015 | 2217.56 | 11.4 | 18.5 | 35.1 | 0.0208 | 0.0166 | |
| Cuneus | L | 2.687 | 5598.38 | −2.4 | −83.4 | 13.3 | 0.0001 | 0.0153 |
| Superior parietal | R | 3.110 | 2046.76 | 4.4 | −86.3 | 34.2 | 0.0345 | 0.0166 |
| Frontal pole | R | 3.019 | 5238.06 | 8.1 | 68.9 | −2.2 | 0.0001 | 0.0175 |
| C. Association between neuroticism and cortical volume (negative correlations) | ||||||||
| Cortical region | Hemisphere | Max | Size (mm2) | X | Y | Z | CWP | Effect size |
| Middle temporal | L | 3.221 | 2316.37 | −59.7 | −23.6 | −21.3 | 0.0012 | 0.0176 |
| Superior temporal | L | 2.741 | 1386.99 | −44.1 | 1.8 | −19.2 | 0.0396 | 0.0168 |
| Lateral occipital | L | 2.447 | 2041.32 | −22.9 | −97.8 | 17.4 | 0.0038 | 0.0148 |
| Fusiform | R | 3.844 | 5374.52 | 43.7 | −31.1 | −22.8 | 0.0001 | 0.0173 |
| D. Association between neuroticism and local gyrification index (negative correlations) | ||||||||
| Cortical region | Hemisphere | Max | Size (mm2) | X | Y | Z | CWP | Effect size |
| Middle temporal | L | 4.816 | 30411.64 | −65.3 | −19.9 | −12 | 0.0001 | 0.0172 |
| Caudal middle frontal | L | 4.251 | 15823.58 | −29.5 | 20.4 | 44.6 | 0.0001 | 0.0162 |
| Lateral occipital | R | 5.057 | 7929.12 | 29.5 | −88.4 | 2.9 | 0.0001 | 0.0181 |
| Supramarginal | R | 3.267 | 6820.13 | 46.3 | −35.2 | 23.3 | 0.0001 | 0.0158 |
| Rostral middle frontal | R | 2.884 | 3513.25 | 29.1 | 42.2 | 30.4 | 0.0001 | 0.0157 |
| Posterior cingulate | R | 2.042 | 2544.36 | 8.4 | 3 | 41.9 | 0.0001 | 0.0142 |
| Superior parietal | R | 1.681 | 1022.58 | 32.9 | −49.7 | 49.3 | 0.0063 | 0.0139 |
Associations between neuroticism and cortical thickness (A), surface area (B), cortical volume (C) and local gyrification index (D). X, Y, Z: MNI coordinates of the local maxima; L: Left; R right; CWP: cluster-wise P values; MNI: Montreal Neurological Institute.
Extraversion
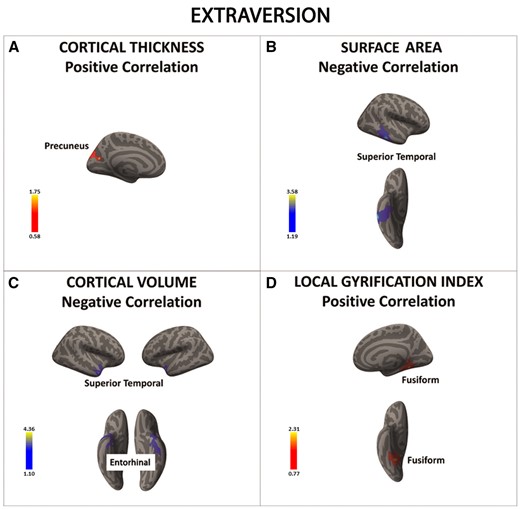
There was a significant positive association between extraversion and cortical thickness in the precuneus (in red) (A). In contrast, there was a significant negative association between extraversion and surface area and cortical volume in the superior temporal cortex and entorhinal cortex (regions in blue) (B and C). Finally, the local gyrification index in the fusiform gyrus was positively associated with extraversion (in red) (D). Color bar: −log10 (P value).
Surface-based morphometry (SBM) results as a function of Extraversion scores (n = 507)
| Extraversion | ||||||||
|---|---|---|---|---|---|---|---|---|
| A. Association between extraversion and cortical thickness (positive correlations) | ||||||||
| Cortical region | Hemisphere | Max | Size (mm2) | X | Y | Z | CWP | Effect size |
| Precuneus | L | 1.753 | 1364.60 | −20.4 | −66.4 | 18.9 | 0.0432 | 0.0156 |
| B. Association between extraversion and surface area (negative correlations) | ||||||||
| Cortical region | Hemisphere | Max | Size (mm2) | X | Y | Z | CWP | Effect size |
| Superior temporal | R | 3.578 | 2192.03 | 39.2 | 19.9 | −28 | 0.0229 | 0.0189 |
| C. Association between extraversion and cortical volume (negative correlations) | ||||||||
| Cortical region | Hemisphere | Max | Size (mm2) | X | Y | Z | CWP | Effect size |
| Superior temporal | L | 3.291 | 2352.88 | −41.6 | 2.4 | −21.3 | 0.0010 | 0.0189 |
| Entorhinal | R | 4.359 | 2781.90 | 22.2 | −5.7 | −29.4 | 0.0002 | 0.0216 |
| D. Association between extraversion and local gyrification index (positive correlations) | ||||||||
| Cortical region | Hemisphere | Max | Size (mm2) | X | Y | Z | CWP | Effect size |
| Fusiform | R | 2.314 | 1779.69 | 32.8 | −49 | −8.4 | 0.0001 | 0.0171 |
Associations between extraversion and cortical thickness (A), surface area (B), cortical volume (C) and local gyrification index (D). X, Y, Z: MNI coordinates of the local maxima; L: Left; R right; CWP: cluster-wise P value: MNI: Montreal Neurological Institute.
Openness
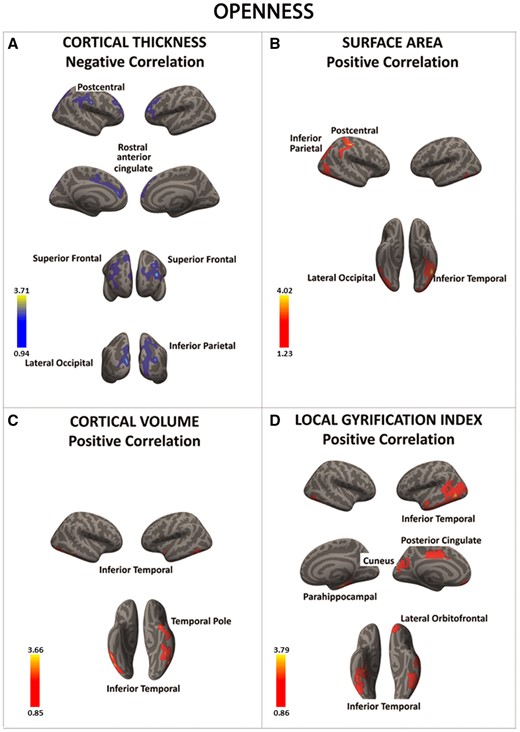
There was a significant negative association between openness and cortical thickness in a series of frontal and posterior regions (in blue) (A). In contrast, there was a significant positive association between openness and the surface area, cortical volume, and local gyrification index in posterior as well as anterior brain regions (regions in red) (B–D). Color bar: −log10 (P value).
Surface-based morphometry (SBM) results as a function of Openness scores (n = 507)
| Openness | ||||||||
|---|---|---|---|---|---|---|---|---|
| A. Association between openness and cortical thickness (negative correlations) | ||||||||
| Cortical region | Hemisphere | Max | Size (mm2) | X | Y | Z | CWP | Effect size |
| Rostral middle frontal | L | 2.819 | 3188.14 | −39.7 | 45.8 | 18.3 | 0.0001 | 0.0161 |
| R | 3.034 | 1696.34 | 43 | 31 | 34 | 0.0139 | 0.0157 | |
| Lateral occipital | L | 2.644 | 1561.46 | −11.1 | −95.8 | 15.6 | 0.0210 | 0.0162 |
| Rostral anterior cingulate | L | 2.513 | 1326.42 | −6.8 | 38.3 | 17.9 | 0.0497 | 0.0155 |
| Postcentral | R | 3.707 | 2211.42 | 63.5 | −12.2 | 30.8 | 0.0023 | 0.0174 |
| Inferior parietal | R | 3.328 | 3412.63 | 36.1 | −86.4 | 18.2 | 0.0001 | 0.0162 |
| Superior frontal | R | 2.488 | 1467.56 | 16.2 | 40.3 | 46.3 | 0.0310 | 0.0156 |
| B. Association between openness and surface area (positive correlations) | ||||||||
| Cortical region | Hemisphere | Max | Size (mm2) | X | Y | Z | CWP | Effect size |
| Inferior temporal | L | 3.688 | 6203.92 | −45.1 | −47.7 | −15.1 | 0.0001 | 0.0166 |
| Postcentral | R | 4.023 | 2358.33 | 51.1 | −23.6 | 50.4 | 0.0135 | 0.0181 |
| Lateral occipital | R | 3.447 | 4103.56 | 19.5 | −102.4 | −4.5 | 0.0001 | 0.0171 |
| Inferior parietal | R | 2.861 | 2075.41 | 31.9 | −72.2 | 22 | 0.0319 | 0.0176 |
| C. Association between openness and cortical volume (positive correlations) | ||||||||
| Cortical region | Hemisphere | Max | Size (mm2) | X | Y | Z | CWP | Effect size |
| Inferior temporal | L | 3.356 | 2024.42 | −43.1 | −56.1 | −9.9 | 0.0038 | 0.0171 |
| R | 2.545 | 1701.86 | 45.8 | −60.7 | −11.6 | 0.0137 | 0.0167 | |
| Temporal pole | L | 2.785 | 1790.26 | −24.2 | 6.1 | −30.6 | 0.0086 | 0.0167 |
| D. Association between openness and local gyrification index (positive correlations) | ||||||||
| Cortical region | Hemisphere | Max | Size (mm2) | X | Y | Z | CWP | Effect size |
| Inferior temporal | L | 3.793 | 9654.94 | −53.7 | −64.7 | −3.6 | 0.0001 | 0.0165 |
| Posterior cingulate | L | 2.564 | 1130.65 | −6.2 | −8.3 | 43.3 | 0.0058 | 0.0154 |
| Lateral orbitofrontal | L | 2.275 | 1044.04 | −20.9 | 50.3 | −16.9 | 0.0103 | 0.0148 |
| Cuneus | L | 1.906 | 1133.88 | −13.7 | −76.1 | 21 | 0.0058 | 0.0145 |
| Parahippocampal gyrus | R | 2.594 | 3615.35 | 20.6 | −22.9 | −26.3 | 0.0001 | 0.0159 |
Associations between openness and cortical thickness (A), surface area (B), cortical volume (C) and local gyrification index (D). X, Y, Z: MNI coordinates of the local maxima; L: Left; R right; CWP: cluster-wise P value; DLPFC: Dorsolateral Prefrontal Cortex; MNI: Montreal Neurological Institute.
Agreeableness
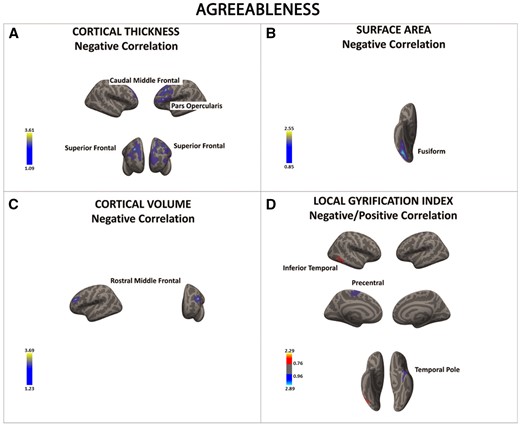
There was a significant negative association between agreeableness and cortical thickness, surface area, cortical volume, and local gyrification index in a series of frontal and temporal regions (in blue) (A–D). The only region showing a positive association between openness and local gyrification index was the inferior temporal cortex (D). Color bar: −log10 (P value).
Surface-based morphometry (SBM) results as a function of Agreeableness scores (n = 507)
| Agreeableness | ||||||||
|---|---|---|---|---|---|---|---|---|
| A. Association between agreeableness and cortical thickness (negative correlations) | ||||||||
| Cortical region | Hemisphere | Max | Size (mm2) | X | Y | Z | CWP | Effect Size |
| Caudal middle frontal | L | 3.612 | 2824.29 | −45 | 19.6 | 37.2 | 0.0001 | 0.0244 |
| Pars opercularis | L | 3.509 | 2262.22 | −55.1 | 25.7 | 14.1 | 0.0013 | 0.0231 |
| Superior frontal | L | 2.449 | 2363.72 | −6.3 | 58.5 | 10.7 | 0.0009 | 0.0219 |
| Rostral middle frontal | R | 3.276 | 2442.53 | 29.1 | 41.6 | 33.7 | 0.0010 | 0.0221 |
| B. Association between agreeableness and surface area (negative correlations) | ||||||||
| Cortical region | Hemisphere | Max | Size (mm2) | X | Y | Z | CWP | Effect size |
| Fusiform | R | 2.550 | 2108.71 | 39.5 | −66.9 | −18.6 | 0.0292 | 0.0235 |
| C. Association between agreeableness and cortical volume (negative correlations) | ||||||||
| Cortical region | Hemisphere | Max | Size (mm2) | X | Y | Z | CWP | Effect size |
| Rostral middle frontal | L | 3.692 | 1332.73 | −43.4 | 35.7 | 26.4 | 0.049 | 0.0251 |
| D. Association between agreeableness and local gyrification index (negative correlations) | ||||||||
| Cortical region | Hemisphere | Max | Size (mm2) | X | Y | Z | CWP | Effect size |
| Temporal pole | L | 2.894 | 1043.87 | −32.9 | 6 | −25.6 | 0.0103 | 0.0219 |
| Precentral | L | 2.351 | 1038.09 | −19.2 | −21.9 | 75.1 | 0.0104 | 0.0198 |
| D1. Association between agreeableness and local gyrification index (positive correlations) | ||||||||
| Cortical region | Hemisphere | Max | Size (mm2) | X | Y | Z | CWP | Effect size |
| Inferior temporal | R | 2.293 | 940.82 | 58.2 | −56.4 | −9 | 0.0103 | 0.0195 |
Associations between agreeableness and cortical thickness (A), surface area (B), cortical volume (C) and local gyrification index (D and D1). X, Y, Z: MNI coordinates of the local maxima; L: Left; R right; CWP: cluster-wise P value: DLPFC: Dorsolateral Prefrontal Cortex; MNI: Montreal Neurological Institute.
Conscientiousness
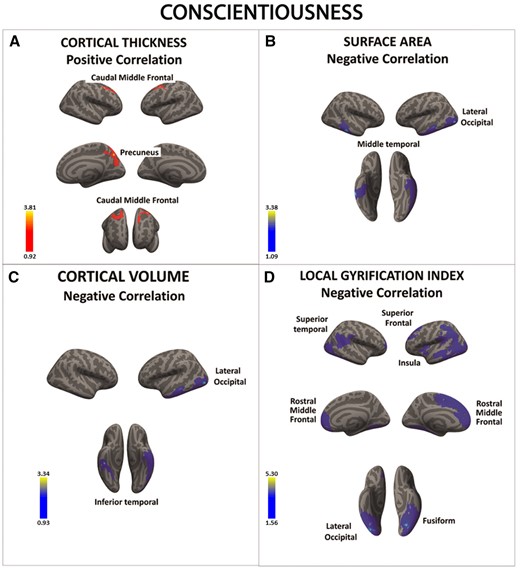
There was a significant positive association between conscientiousness and cortical thickness in a series of frontal regions (A). There was also a negative correlation between conscientiousness and surface area, cortical volume and local gyrification index in occipital, temporal and frontal cortices (B–D). Color bar: −log10 (P value).
Surface-based morphometry (SBM) results as a function of Conscientiousness scores (n = 507)
| Conscientiousness | ||||||||
|---|---|---|---|---|---|---|---|---|
| A. Association between conscientiousness and cortical thickness (positive correlations) | ||||||||
| Cortical region | Hemisphere | Max | Size (mm2) | X | Y | Z | CWP | Effect Size |
| Caudal middle frontal | L | 2.766 | 1524.13 | −28.4 | 4.6 | 55.9 | 0.0248 | 0.0187 |
| R | 3.813 | 1759.57 | 41.7 | 12.4 | 55.8 | 0.0114 | 0.0213 | |
| Pre-cuneus | R | 3.802 | 2028.22 | 5.1 | −71.7 | 39.8 | 0.0039 | 0.0207 |
| B. Association between conscientiousness and surface area (negative correlations) | ||||||||
| Cortical region | Hemisphere | Max | Size (mm2) | X | Y | Z | CWP | Effect size |
| Lateral occipital | L | 3.284 | 7203.89 | −43.7 | −82.6 | −4.7 | 0.0001 | 0.0196 |
| Middle temporal | R | 3.381 | 3322.6 | 56 | −32.8 | −18.1 | 0.0011 | 0.0203 |
| C. Association between conscientiousness and cortical volume (negative correlations) | ||||||||
| Cortical region | Hemisphere | Max | Size (mm2) | X | Y | Z | CWP | Effect size |
| Lateral occipital | L | 3.337 | 2416.34 | −44.1 | −79.3 | −3 | 0.0008 | 0.0189 |
| Inferior temporal | R | 2.784 | 1596.35 | 43.8 | −27.4 | −23.2 | 0.0207 | 0.0189 |
| D. Association between conscientiousness and local gyrification index (negative correlations) | ||||||||
| Cortical region | Hemisphere | Max | Size (mm2) | X | Y | Z | CWP | Effect size |
| Fusiform | L | 4.670 | 17416.85 | −28 | −69.7 | −7.2 | 0.0001 | 0.0200 |
| Superior frontal | L | 3.704 | 10876.54 | −12 | 17.4 | 62.8 | 0.0001 | 0.0191 |
| Insula | L | 1.686 | 874.77 | −40.5 | −3.1 | −7.6 | 0.0307 | 0.0167 |
| Lateral occipital | R | 5.299 | 8017.96 | 35.6 | −78.3 | −14.6 | 0.0001 | 0.0242 |
| Superior temporal | R | 3.417 | 3122.37 | 67.9 | −37.5 | 14.4 | 0.0001 | 0.0212 |
| Rostral middle frontal | R | 2.575 | 3976.89 | 25.2 | 58.6 | 17.7 | 0.0001 | 0.0192 |
Associations between conscientiousness and cortical thickness (A), surface area (B), cortical volume (C), and local gyrification index (D). X, Y, Z: MNI coordinates of the local maxima; L: Left; R right; CWP: cluster-wise P value: MNI: Montreal Neurological Institute.
Discussion
This study examined the neuro anatomical basis of the five-factor model (FFM) of personality using surface-based morphometry (SBM) methods in a large and homogeneous sample of healthy and young individuals (n = 507, age-range: 22–36 years). The sample was derived from the Human Connectome Project, an international research project that aims at discovering the fundamental aspects of brain structure and function in the general population (McNab et al., 2013).
Overall, each of the FFM personality traits was associated with significant variations in cortical thickness, SA, cortical volume, and folding in specific brain regions. Together, these findings demonstrate the value of applying SBM methods to investigate neuro anatomical differences in relation to the FFM personality traits. This is because each of the SBM metrics provides unique information regarding cortical anatomy and possibly different neurodevelopmental patterns. In the next sections, we discuss the results of each of the FFM trait and the implications of the present results for the field of personality neuroscience and more broadly for the study of human behavior, cognition, and emotion.
Neuroticism
Neuroticism was associated with significant SBM variations in temporal (middle and superior temporal gyrus), parietal (superior parietal, supra-marginal gyrus, cuneus/posterior cingulate), and frontal (superior PFC) cortices.
Some of these regions—i.e., the dorso-medial superior PFC, supra-marginal gyrus, and cuneus/posterior cingulate—belong to the default-mode network (DMN), a set of brain areas that has been consistently identified in task-free functional imaging studies (Raichle, 2015). The DMN is thought to play a role in auto-referential cognitive processes and self-generated thoughts (Salomon et al., 2014), which is consistent with the tendency to ruminate of individuals who score high on neuroticism (Nolen-Hoeksema et al., 2008; Hamilton et al., 2011). However, self-generated thoughts are not sufficient per se to determine neuroticism, which may be mainly linked to the negative content of these thoughts (Perkins et al., 2016; Pickering et al., 2016). It is also reasonable to expect that dynamic interactions across regions like the amygdala, insula, and the DMN represent the ‘engine’ of neuroticism, although more research is needed to support this hypothesis (Perkins et al., 2016; Pickering et al., 2016).
On the other hand, the decreased SA and folding in the superior PFC may represent the neural correlates of executive dysfunctions and problems in voluntary suppression of affective reactions reported in individuals with high levels of neuroticism (Levesque et al., 2003; Ochsner and Gross, 2005; Blair et al., 2007; Mauss et al., 2007; Phillips et al., 2008; Harenski et al., 2009). It should be also emphasized that the present SA findings were consistent with those reported in a recent study showing significant reduction in SA in fronto-temporal regions as a function of higher neuroticism scores (Bjornebekk et al., 2013). In contrast, our cortical thickness results differed from those reported in Holmes et al. (2012). This is likely due to numerous methodological differences between the two studies including correction for multiple comparisons (in the present work), the use of different versions of Freeserfer (Gronenschild et al., 2012; Chepkoech et al., 2016), different smoothing kernels (Liem et al., 2015), and the use of univariate analyses instead of multivariate modeling (as in the present study).
Finally, we note that people scoring high in neuroticism displayed significant differences in cortical thickness in similar frontal, temporal, and parietal cortices to those identified when exploring SA and folding, although the direction of the results was opposite (i.e., higher cortical thickness vs.lower SA and folding). At first glance, these results may appear puzzling especially if higher cortical thickness is simplistically thought to be associated with higher SA and folding. However, there is evidence that the opposite is true (Hogstrom et al., 2013). More specifically, SA and cortical folding have been found to be positively related each other, while both measures have been negatively associated with cortical thickness (Hogstrom et al., 2013). This pattern of ‘cortical stretching’ is thought to promote local brain connectivity via enhancing the SA and folding at the expenses of cortical thickness (Hogstrom et al., 2013). Hence, higher cortical thickness and lower SA and folding in people with high levels of neuroticism may represent a maladaptive phenomenon that predispose these individuals to develop psychiatric disorders linked to high negative emotionality (e.g. depressive and anxiety illnesses).
Extraversion
In contrast to our hypothesis and previous research reporting significant associations between extraversion and anatomical variation in the PFC (Wright et al., 2006; Bjornebekk et al., 2013), we found that extraversion was linked to differences in SBM metrics in posterior regions like the pre-cuneus, superior temporal gyrus, entorhinal cortex, and fusiform gyrus. However, we note that the two previous studies using SBM methods and FFM questionnaires found conflicting results, reporting that extraversion was associated with either thinner or thicker lateral PFC (Wright et al., 2006; Bjornebekk et al., 2013). Overall, the inconsistencies across ours and the previous studies may have been driven by significant differences in the sample characteristics and methodologies used (i.e., age-range, total sample size, analytical procedures).
Openness
Openness was linked to significantly thinner PFC regions and greater SA and folding in parietal and temporal areas as well as in the orbitofrontal cortex.
First, these results provide further support to the idea that variations within PFC regions involved in attention and salience detection may be critical to mediate individual differences in openness (DeYoung et al., 2005; DeYoung, 2013). Accordingly, our recent functional magnetic resonance imaging study showed that openness was associated with variability in the functional connectivity within PFC-dopaminergic networks that have been implicated in orienting attention towards salient stimuli (Passamonti et al., 2015). Overall, it may be that variations in SBM measures in people with high openness may facilitate the information flow within PFC circuits that mediate enhanced cognitive flexibility and reduce threshold for information processing (McCrae and Costa, 1997; McCrae and Sutin, 2009). Consistent with this view, a past study found significant changes in gray-matter volume in the lateral PFC in people with high levels of creativity and divergent thinking, two mental processes strongly linked to openness (Takeuchi et al., 2010).
Second, openness was positively associated with SA and folding in posterior parietal and temporal areas as well as in a PFC region implicated in a wide range of socio-cognitive functions (i.e. the orbitofrontal cortex) (Tzschentke, 2000; Gallese et al., 2004). As we have discussed for neuroticism, the opposite directionality of the results for the cortical thickness and SA/folding indicates, once again, that these SBM metrics can be reversely modulated by individual differences in personality traits (Hogstrom et al., 2013). In this case, however, openness was simultaneously associated with reduced cortical thickness and higher SA and folding which can be interpreted perhaps as a marker of enhanced cortical maturation in a group of people that are considered highly receptive to salient stimuli and significantly motivated to ‘‘enlarge’’ their sensory experience (McCrae and Costa, 1997; McCrae and Sutin, 2009).
Agreeableness
Agreeableness was associated to reduced SBM metrics in the inferior frontal gyrus (pars orbitalis), superior PFC, fusiform gyrus and temporal pole. Although it is unclear why cortical thickness as well as SA and folding all showed a negative association with agreeableness (in contrast to the differential modulation of these SBM metrics by the other FFM traits), it is interesting that most of the areas identified here have been implicated in socio-affective processes in which people with high levels of agreeableness excel (Jensen-Campbell and Graziano, 2001; Meier et al., 2006; Nettle and Liddle, 2008; Graziano and Habashi, 2010).
The reduced SA in the fusiform gyrus as a function of higher agreeableness scores is also consistent with the results of a previous VBM study (DeYoung, 2010), although it is difficult to directly compare VBM to SBM findings. Nevertheless, we note that the fusiform gyrus is a key part of the neural systems involved in processing facial identity and expressions (Calder and Young, 2005), two social signals at the basis of all human relationships. Consequently, the SA variability in the fusiform gyrus in agreeable people is in keeping with the social information processing function of this brain area (Calder and Young, 2005).
Finally, the cortical thinning in the pars orbitalis of the lateral PFC in agreeable people is in line with the proposed role of this region (and its connectivity patterns) in mediating the substantial differences in temperamental attitudes described between chimpanzees and bonobos, two phylogenetically related ancestors of human beings (Wrangham and Peterson, 1996; Palagi, 2006; Hare and Kwetuenda, 2010). More specifically, greater connectivity between the lateral PFC/insula and amygdala were associated with less aggressive behavior, more adult play, and greater social tolerance in bonobos relative to chimpanzees (Rilling et al., 2011).
Conscientiousness
Conscientiousness was linked to SBM indices in fronto-temporal cortices. As for neuroticism, the cortical thickening in PFC regions in conscientious persons was correlated with reduced SA and folding which indicates that different SBM measures may reflect opposite neurodevelopmental effects (Hogstrom et al., 2013).
Our data also showed a significant association between variability in PFC thickness, PFC folding, and conscientiousness. These findings are consistent with a number of previous studies and provide further support to the notion that conscientious people may have a more efficient (or at least different) functioning of the executive control system (DeYoung, 2010; Kapogiannis et al., 2012; Duncan, 2013; Forbes et al., 2014; Dima et al., 2015; Rodrigo et al., 2016). Given the evidence that conscientiousness significantly predicts performances related to successful control of impulsive behaviors (Barrick and Mount, 1991; Murphy and Lee, 1994; Friedman, 2000), it is also possible that conscientious people are particularly able to inhibit short-term pleasure seeking and other types of impulsive responses as a function of their anatomical variability in cortical structures that have been implicated in regulating these behaviors.
Strengths and limitations
This study has a number of strengths including the use of highly standardized SBM analyses and a large, homogeneous, and well-characterized sample of participants in terms of the five major dimension of personality as well as demographic features. As such, the HCP data offered greater statistical power compared to many previous studies.
In terms of potential shortcomings, it can be surmised that a relatively large number of statistical tests was performed. This could have increased the probability of type I errors, although the use of a large sample size and state-of-art methods to correct for multiple comparisons should have mitigated against this problem.
As many other studies in the field, our work was based on a self-report questionnaire and, although there is strong evidence in support of its validity and reliability, particularly in healthy individuals (Young and Schinka, 2001), this measure inevitably reflects people’s judgment on their own behavior. Hence, forthcoming research should use multiple informants to assess participants’ personality (e.g. using the observer-rating version of the NEO questionnaires in addition to the self-report version of the same questionnaire). To improve the mapping of human personality, it would be also important to examine the facets that compose each of the FFM traits. For example, conscientiousness includes facets such as order, industriousness, and self-discipline. Examining the more narrowly defined facets may thus provide a more nuanced picture of the neuroanatomical substrate of personality.
Another point that is worth mentioning is in the direction of the associations between SBM measures and FFM traits (either positive or negative). There are two non-mutually exclusive explanations for these findings. First, we have already discussed that cortical thickness tends to be negatively associated to SA and folding and that this would reflect ‘the well-established phylogenetic principle of maximizing SA and gyrification rather than increasing thickness to facilitate brain connectivity’ (Hogstrom et al., 2013). Second, although higher than average cortical thickness might usually be expected to be associated to more favorable FFM scores (e.g., lower neuroticism, higher conscientiousness) and eventually improved efficiency at the behavioral level, the opposite can be equally true—i.e., cortical thinness may be linked to favorable FFM scores and better behavioral or cognitive performance (e.g. higher intelligence quotient) (Shaw et al., 2006; DeYoung et al., 2010). This apparently counter-intuitive finding should be interpreted in light of evidence that cortical thinness is not necessarily associated with lower number of neurons but might also depend on locally potentiated cellular and/or synaptic pruning, two neurodevelopmental processes that have been associated with improved cognitive efficiency (Paus, 2005).
Finally, we acknowledge that, inevitably, our study does not provide an exhaustive picture of all brain systems mediating variability in the FFM personality traits. This is because other brain regions and networks could be found when investigating brain function (which may be mainly linked to micro-structural differences) rather than the gross cortical neuro anatomy. Further studies simultaneously assessing multiple indices of brain structure and function at different scales are thus necessary to extend our work and reveal in more detail the complexity of the neural circuits underlying individual differences in personality.
Summary and conclusions
To summarize, this study showed that each of the FFM traits was associated with variability in cortical anatomy as assessed by distinct SBM metrics (i.e., cortical thickness, SA, and cortical folding). Interestingly, many of the effects were localized in the prefrontal cortex, a set of brain regions that have significantly evolved in human beings and great apes relative to the other species. This could reflect the fact that several FFM personality traits are linked to high-level socio-cognitive skills as well as the ability to modulate ‘core’ affective responses. In conclusion, the new data presented in this study provided the most robust evidence to date on the neuro anatomical substrate of the five fundamental dimensions of human personality.
Funding
R.R. was funded by the University ‘Magna Graecia’ of Catanzaro, while L.P. was funded by the Italian National Research Council and the University of Cambridge. AT was funded by the National Institute on Aging (NIA), National Institutes of Health (NIH; 1R03AG051960-01) and by the Florida Department of Health ‘Ed and Ethel Moore Alzheimer's Disease Research Program’ (6AZ09). Data were provided by the Human Connectome Project, WU-Minn Consortium (Principal Investigators: David Van Essen and Kamil Ugurbil; 1U54MH091657) funded by the 16 NIH Institutes and Centers that support the NIH Blueprint for Neuroscience Research; and by the McDonnell Center for Systems Neuroscience at Washington University. Data collection and sharing for this project was provided by the MGH-USC Human Connectome Project (HCP; Principal Investigators: Bruce Rosen, M.D., Ph.D., Arthur W. Toga, Ph.D., Van J. Weeden, MD). The HCP project is supported by the National Institute of Dental and Craniofacial Research (NIDCR), the National Institute of Mental Health (NIMH), and the National Institute of Neurological Disorders and Stroke (NINDS) (Principal Investigators: Bruce Rosen, M.D., Ph.D., Martinos Center at Massachusetts General Hospital; Arthur W. Toga, Ph.D., University of Southern California, Van J. Weeden, MD, Martinos Center at Massachusetts General Hospital). HCP is also the result of efforts of co-investigators from the University of Southern California, Martinos Center for Biomedical Imaging at Massachusetts General Hospital (MGH), Washington University, and the University of Minnesota.
Conflict of interest. None declared.
References
