


Abstract
Research on the effects of media violence exposure has shown robust associations among violent media exposure, increased aggressive behavior, and decreased empathy. Preliminary research indicates that frequent players of violent video games may have differences in emotional and cognitive processes compared to infrequent or nonplayers, yet research examining the amount and content of game play and the relation of these factors with affective and cognitive outcomes is limited. The present study measured neural correlates of response inhibition in the context of implicit attention to emotion, and how these factors are related to empathic responding in frequent and infrequent players of video games with graphically violent content. Participants completed a self-report measure of empathy as well as an affective stop-signal task that measured implicit attention to emotion and response inhibition during electroencephalography. Frequent players had lower levels of empathy as well as a reduction in brain activity as indicated by P100 and N200/P300 event related potentials. Reduced P100 amplitude evoked by happy facial expressions was observed in frequent players compared to infrequent players, and this effect was moderated by empathy, such that low levels of empathy further reduced P100 amplitudes for happy facial expressions for frequent players compared to infrequent players. Compared to infrequent players, frequent players had reduced N200/P300 amplitude during response inhibition, indicating less neural resources were recruited to inhibit behavior. Results from the present study illustrate that chronic exposure to violent video games modulates empathy and related neural correlates associated with affect and cognition.
Introduction
The media is saturated with violence and aggression. Video games contain the most graphic, rewarded, and justified violence of any type of media (Haninger and Thompson, 2004), and they have become increasingly popular since the 1980s (Rideout, 2015). Extensive research on the effects of media violence exposure has shown a robust association between violent media exposure, increased aggressive behavior, and decreased empathy (Bushman and Anderson, 2002a; Anderson et al., 2010). Meta-analytic studies have repeatedly shown that exposure to violent video games is related to deceased empathy and prosocial behavior in teens, emerging adults, and adults (Anderson et al., 2010). For example, participants who played a violent video game for 10 minutes took significantly longer to help a confederate of the study, and subsequently rated the confederate’s injuries as less severe (Bushman and Anderson, 2009). Males between the ages of 18 and 25 are more likely than other demographic groups to spend a significant amount of time playing video games (Padilla-Walker et al., 2010). Habitual players tend to be more immersed in the gaming experience, maintain a strong identification with their avatars, and feel more connected to their video games. These factors are thought to increase the effect of media violence on aggression (Konijn et al., 2007), which in turn may be related to a reduction in empathy and prosocial behaviors (Bushman and Anderson, 2009).
While preliminary evidence indicates that violent video game play is associated with individual differences in affective and cognitive processes compared to individuals who do not play violent video games (Weber et al., 2006), research examining the amount and content of game play and the relation of these variables with affective and cognitive factors is limited. The present study measured the neural correlates of response inhibition in the context of implicit attention to valenced facial expressions as well as differences in empathic responding in frequent and infrequent players of graphically violent video games. Identifying group differences in affective and cognitive function in this sample could help inform policy decisions regarding content and visual images used in violent video games in order to mitigate the societal and individual risks posed by the gaming industry. Further, this research may have implications regarding individual differences in affective and cognitive processes for individuals who experience chronic exposure to community-based violence (i.e. Gaylord-Harden et al., 2017a, 2017b).
Exposure to media violence is associated with individual differences in attention to facial expressions
Relatively automatic processing of facial expressions is essential to social cognition. Attention to emotional content conveyed in facial expressions is critical for promoting healthy social interaction and survival (Grelotti et al., 2002). Preliminary evidence suggests that playing violent video games is associated with decreased cognitive resources allocated to processing images of violence and may indicate desensitization to violence after exposure to violent video games (Bartholow et al., 2006; Bailey et al., 2011). Likewise, this desensitization has been shown to mediate the relationship between media violence exposure and increased aggressive behavior (Engelhardt et al., 2011). Short-term exposure to media violence has been associated with slower identification of happy facial expressions (Kirsh and Mounts, 2007), and chronic exposure to violent media was related to faster and more accurate identification of angry facial expressions compared to happy facial expressions (Kirsh et al., 2006). Consistent with these findings, research that investigated the neural correlates of facial expression processing following short-term exposure to media violence showed a suppressed neural response to facial expressions (regardless of valence) during an implicit attention to emotion task (Stockdale et al., 2015).
P100
The primary visual cortex responds to visual stimuli within 100 ms after stimulus exposure (Eimer and Holmes, 2002), and this response is observable via the P100 event-related potential (ERP). Multiple researchers have shown that increased P100 amplitude and slower latencies are related to increased attention to facial expressions, suggesting that the P100 measures early attention to affective information (Turetsky et al., 2007; Bauser et al., 2012; Blechert et al., 2012). Attentional demands as characterized by P100 are also influenced by individual differences in affective function. P100 amplitude has been shown to index threat sensitivity, with increased P100 amplitude predicting greater threat sensitivity during a task that asked participants to identify a facial expression (Dennis and Chen, 2007). Children with a history of physical abuse attended more to angry facial expressions in an implicit attention task as indicated by larger P100 amplitudes to angry facial expressions as compared to happy facial expressions (Pollak and Tolley-Schell, 2003). Bauser et al. (2012) asked participants to identify the emotion displayed in either averted or head-on-faces. Emotion identification of averted facial expressions required more attention as indexed by increased P100 amplitudes and delayed latencies compared to emotional facial expressions that were viewed head-on. Furthermore, empathy was negatively correlated with P100 latencies for averted faces, suggesting that people who are better at considering other people's thoughts and feelings, were faster and more efficient at processing affective information contained in averted faces (which is more difficult to process). Taken together, these studies suggest that chronic exposure to media violence, which is known to influence empathy, may modulate the P100 in response to emotional facial expressions.
Hypothesis 1
In the present study, we hypothesized that frequent players of graphically violent video games (i.e. individuals who typically play shooter video games that are rated M for violence) would allocate less attentional resources to processing emotional facial expressions, which would be indicated by decreased P100 amplitudes in frequent players of graphically violent video gamers as compared to infrequent gamers. Further, we hypothesized that empathy would moderate the relation between the two groups and P100 amplitude such that increased empathy, particularly for infrequent players of graphically violent video games, would be associated with less attention allocated toward processing emotional facial expressions evident via reduced P100 amplitude.
N170
Approximately 170 ms after viewing a human face, a neural response is elicited in the fusiform gyrus, a part of the posterior ventral processing stream (McCarthy et al., 1997; Eimer and Holmes, 2007). The N170 ERP is theorized to reflect structural encoding of the observed face (Eimer, 2000). Fearful and angry facial expressions evoke larger N170 amplitudes compared to neutral facial expressions (Eimer and Holmes, 2007). Consistent with an evolutionary perspective that suggests that increased attention to negatively valenced stimuli functions to prioritize attention to environmental threats to increase chances of survival (Schupp et al., 2004), increased N170 amplitude evoked by negatively valenced facial expressions likely reflects relatively increased attention to negative stimuli (Blau et al., 2007). However, there may be various contexts that modulate this evolutionary predilection. Our previous research has shown that exposure to media violence attenuates N170 amplitude evoked by happy and fearful facial expressions (Stockdale et al., 2015), indicating a general desensitization to emotional facial expressions following exposure to media violence.
Hypothesis 2
In the present study, we hypothesized that frequent and infrequent players of graphically violent video games alike would have increased N170 amplitude and shorter latencies for afraid facial expressions compared to happy facial expressions, indicative of a general, evolutionary-based attentional bias to threat-related stimuli. Additionally, per our previous findings (Stockdale et al., 2015), we anticipated that frequent players of graphically violent video games would have reduced N170 amplitude to positive and negative valenced stimuli compared to the infrequent players of graphically violent video games, indicative of “emotional anesthetization”, or desensitization to affective stimuli (Stockdale et al., 2015).
Frequent exposure to violent video game play may influence response inhibition during implicit attention to valenced facial expressions
Response inhibition, or the ability to suppress a dominate response in favor of another response, is essential for adaptive affective and cognitive functioning. Playing a first-person shooter video game requires the player to constantly attend to their virtual surroundings, and inhibit behavior to only shoot enemies, while sparing comrades and innocent bystanders. Therefore, it is plausible that chronically playing violent video games, such as first-person shooter games, could improve response inhibition, and this ability may generalize to contexts beyond video game play (Hummer et al., 2010). Indeed, cognitive and motor training associated with repeated video game play was associated with increased speed of visual scanning and processing (Castel et al., 2005). However, mixed findings have emerged from previous research regarding the effects of media violence exposure on inhibition processes. Other studies have shown that video game play was not related to improved behavioral performance on a response inhibition task (Colzato et al., 2013). Related, using the color-word Stroop task, Bailey et al. (2010) illustrated that frequent gamers showed a decrease in cognitive control in a longer experimental task condition that required infrequent activation of response inhibition processes. The frequent gamers in this study also showed less midfrontal cortical activity, suggestive of less activity in anterior cingulate cortex (ACC), a brain region commonly recruited during cognitive control functions and response inhibition (Botvinick et al., 2004; Mohanty et al., 2007; Banich, 2009; Silton et al., 2010; Shenhav et al., 2016). ACC activity is robustly observed during go/no-go, stop-signal, and color-word stroop tasks (Mohanty et al., 2007; Verbruggen and Logan, 2008; Huster et al., 2010; Silton et al., 2010).
Consistent with the findings from Bailey et al. (2010), a functional magnetic resonance study showed that that participants with high levels of exposure to violent video games showed less brain activity in subcortical (i.e. amygdala) and cortical (i.e. insula, prefrontal cortex, ACC) regions involved with emotion regulation and affective processes that are engaged during video game play (Gentile et al., 2016). Bailey and West’s (2013) summary of the effect of action video games on cognitive function suggest that playing action video games may increase visual acuity, but that the effects of action video game play on more top-down processes such as task switching or response inhibition are dependent on the nature of the task. Their review of the literature suggested that when action video game play is paired with tasks requiring attending to violent and aggressive stimuli there is a benefit of action video game play, but when aggressive or violent stimuli are irrelevant to the task there is a deficit in task performance after violent action video game play. Gentile et al. (2016) indicate that individuals with high levels of exposure to violent video games may be emotionally anesthetized to the high valence, high arousing violent video game content as indicated by a reduction in activity in key brain networks that support emotional response to affective stimuli. Thus, if frequent players of violent video games are numb to affective stimuli, we would expect that less neural resources would be recruited during response inhibition in the context of affective distractors, which should imbed task performance in traditional media effects studies.
N200/P300
Of relevance to the present study, approximately 300 ms after a stop-signal stimulus is presented, a broad ERP waveform is observed which is thought to be indicative of ACC generators and associated response inhibition processes (Enriquez-Geppert et al., 2010). In go/no-go and stop-signal tasks (SST), the N200 ERP component is evoked approximately 200 ms after exposure to a signal to withhold a response, and it is thought to signify conflict detection (van Boxtel et al., 2001; Donkers and van Boxtel, 2004). However, researchers have argued that there is insufficient evidence to justify the separation of the N200/P300 into two separate ERP components (i.e. N200 and P300; Huster et al., 2013). As such, in the present study, the N200 and P300 will be treated as one broad N200/P300 complex, theorized to be generated by ACC and indicative of response inhibition (Huster et al., 2013). Novel to the present study, we evaluated the role of response inhibition in the presence of affective distractors in order to increase generalizability to violent video gaming contexts which require players to ignore affective stimuli in order to successfully shoot a targeted enemy.
Hypothesis 3
In the present study, we predicted that compared to infrequent players of graphically violent video games, frequent players of graphically violent video games would recruit less neural resources during response inhibition (in the presence of facial expressions, regardless of valence) as indicated by reduced midfrontal N200/P300 amplitude. It was also anticipated that empathy would moderate the relationship between group (infrequent or frequent gamer) and N200/P300 amplitude, such that lower levels of empathy would be related to decreased N200/P300 amplitudes.
Materials and methods
Participants
Participants from a large, Midwestern, urban university were screened using an online questionnaire to identify frequent players of violent video games and infrequent players of graphically violent video games. Frequent players of graphically violent video games (n = 32) and infrequent players of graphically violent video games (n = 32) were invited to participate in a subsequent electroencephalography (EEG) study. Participants who were left-handed and/or had a history of neurological disorder were excluded from the study. Two frequent gamers, and one infrequent gamer were excluded from analyses due to poor EEG task performance (accuracy below 50%), resulting in a final sample of 30 frequent gamers (65% Caucasian, 13% Hispanic/Latino, 13% Asian, 6% African American, and 3% Multiracial; age M = 20.74 SE = .32), and 31 infrequent gamers (45% Caucasian, 32% Asian, 16% Hispanic/Latino, 3% multiracial; age M = 20.68 SE = .21). The Institutional Review Board approved all experimental procedures.
Materials and procedure
Questionnaire measures
Video-game violence
The video-game violence questionnaire asked participants to estimate how many hours they spend on average per weekday and weekend playing video games in installments (Gentile, 2009). Participants were also asked to identify the three video games they played most frequently. Participants were classified as frequent players of graphically violent video games if they played 30 or more hours of video games per week and at least two of the three video games they played on a weekly basis were violent, as determined by being shooter video games and containing an M rating for violence on the game. Participants were classified as infrequent players of graphically violent video games if they played no more than 5 hours per week of video games and two of the three games they played most frequently were not graphically violent (rated E10 or lower).
Empathy
Empathy was measured using a self-report measure during the screening questionnaire. The Internal Reactivity Index (IRI, Davis, 1983) is a 28-item questionnaire that assesses four distinct aspects of empathic responding: perspective taking (e.g. ‘I try to look at everybody's side of a disagreement before I make a decision’), fantasy (e.g. ‘I daydream and fantasize, with some regularity, about things that might happen to me’), empathic concern (e.g. ‘I often have tender, concerned feelings for people less fortunate than me’), and personal distress (e.g. ‘I sometimes feel helpless when I am in the middle of a very emotional situation’). Questions are answered on a five-point Likert scale ranging from ‘Does not describe me well’ to ‘Describes me very well’. Items were summed and higher scores indicate greater empathy. Past research has shown that the scales can be used as individual constructs or as an overall measure of empathy (Davis, 1983; Pulos et al., 2004). The present study examined the empathic concern subscale of the IRI (α = 0.81).
Laboratory assessment session
Stop-signal task
The SST was based on the paradigm used by Stockdale et al. (2015). Faces exhibited either a fearful or happy expression; however, the task is considered an implicit attention to emotion task since participants were not asked to attend to or identify the specific facial emotions. On go trials (see Figure 1), participants were asked to press a button to indicate whether they believed the face presented was of a male or female. Go trials began with a fixation screen followed by a face presented for 1 s while participants responded by pressing one of two buttons on the electronic response box. Participants could respond any time after the stimulus onset for up to 1 s. A black screen followed the face stimulus. On stop trials (see Figure 1), a stop signal (a stripped box surrounding the face stimulus; SS) was displayed for 100 ms shortly after face stimulus onset. When the stop signal appeared, participants were asked to withhold their gender discrimination response. The delay between face stimulus presentation and the stop signal was adjusted (200–500 ms) to standardize task difficulty across participants. Specifically, if a participant was successful in withholding his/her response on the two previous stop trials the next stop trial would have a 20-ms longer stop delay (SSD). This served to make the task slightly more difficult. The better the participant was at withholding his/her response the longer the delay became, thus calibrating response inhibition effort across participants. Go and stop trials were randomly intermixed 50/50 within each block of trials. The go-trials the ERP epoch was time locked to face-onset (Face ERP), while for stop-trials the ERP epoch was time locked to the stop-signal onset (Stop ERP).
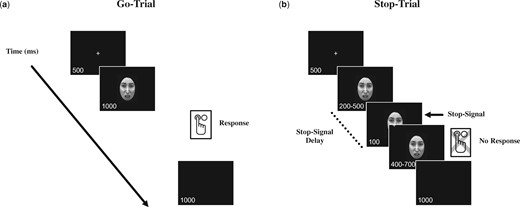
Stop-signal task paradigm. (A) Go-trials begin with a fixation screen followed by the presentation of the face for 1 s while the participants indicate the gender of the face by pressing one of two buttons on an electronic response box. (B) On Stop-trials, a stop-signal was displayed for 100 ms after a 200- to 500-ms delay. The stop-signal delay was adjusted based on participant performance so that better withholding of responses on the previous two trials resulted in an increased delay between the presentation of the face and the stop-signal, thereby making the task more difficult. The go-trials the ERP epoch was time locked to face-onset (Face ERP), while for stop-trials the ERP epoch was time locked to the stop-signal onset (Stop ERP).
Participants were seated 100 cm from a 21-inch CRT monitor in a quiet room. The face stimuli were presented and responses were recorded using E-Prime 2.0 (Schneider et al., 2002). After being fitted with an electroencephalograph (EEG) cap, participants were given task instructions and then performed two sets of 20 practice trials receiving feedback on their task accuracy and speed of responding if they were getting the majority of responses incorrect or were not responding quickly enough after each of the two sessions. After this practice session, participants completed a total of 624 trials divided across 12 blocks. There were 156 trials for each condition and valence (i.e. go-happy, go-afraid, stop-happy, stop-afraid). Half of the stimuli were male faces and half were female faces. The same 48 faces were used in each block with varied assignment (go, stop) in each block. Each block contained the four conditions and two genders. Trials were presented in random order across participants and participants received a twenty-second break between each block.
EEG recording and data reduction
EEG data were recorded during the entire SST using a Biosemi Active2 EEG system. Custom-designed Falk Minow caps with 64 equidistant active electrodes (Ag/AgCl) were used for data collection. CMS/DRL were placed near the vertex. Two electrodes were located on the mastoid bones. Two electrodes included in the caps were placed lateral to each eye to monitor horizontal eye movements. Two additional electrodes were placed on the inferior edge of the orbit of each eye to monitor vertical eye movements including eye blinks. Data were recorded with a band pass filter of 0 –104 Hz, and sampled at a rate of 512 Hz. The following EEG data processing steps were performed in EMSE (Source Signal Imaging). EEG data were re-referenced to common average reference and then digitally filtered with a 0.01 Hz high-pass filter and band-stop filter from 59 to 61 Hz. All filters had a cutoff attenuation of 12 dB/octave. A polynomial detrend was applied to the data to implement a 100 ms pre-stimulus baseline adjustment for ERP averaging. A spatial PCA filter was applied to correct for ocular artifacts. EEG contaminated with muscle or movement artifacts were identified by visual inspection and removed from the raw EEG signal and a 100 mV trial-by-trial rejection criterion was applied during averaging. Participants had on average, 73% correct “Go-Happy” trials, 69% correct “Go-Afraid” trials, 78% correct “Stop-Happy” trials, 76% “Stop-Afraid” trials.
Mean amplitude and 50-percent area latency scores (Luck, 2005) were calculated for the occipital P100 and lateralized N170 for go-trials, which were stimulus-locked to the onset of the face stimuli. Amplitude and latency of the frontocentral N200/P300 component was stimulus-locked to the onset of the stop signal for stop-trials. Electrode sites and scoring windows were selected based on a priori scoring windows derived from other studies investigating these ERPs in similar contexts and visual inspection of the data in the present study (Stockdale et al., 2015; P100: Herrmann et al., 2005; N170: Ashley et al., 2004; N200/P300: Enriquez-Geppert et al., 2010). The P100 was measured from 70 to 140 ms post face-stimulus onset in the posterior portion of the scalp (see Figure 2). The N170 was measured from 140 to 200 ms post face-stimuli onset at T5 and T6 (see Figure 3). For stop-trials, the N200/P300 complex was measured from 140 to 400 ms post stop-signal onset at electrode CZ (see Figure 4). Behavioral data were analyzed by examining within and between subject factors on response time and accuracy (whether they correctly identified the gender, participants’ responses where they did not respond at all or quickly enough were not included) for the go-trials and accuracy (whether they successfully stopped their response) and stop-signal-delay for the stop-trials.
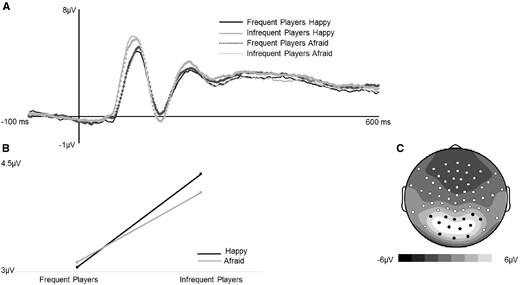
(A) Grand average ERPs (time-locked to face-onset) for correct trials averaged across 11 posterior electrodes indicated in black on topographic map. (B) Frequent players had significantly reduced P100 mean amplitudes compared to infrequent players. (C) Mean amplitude scalp topography for the average of all four conditions (70–140 ms post-face onset).
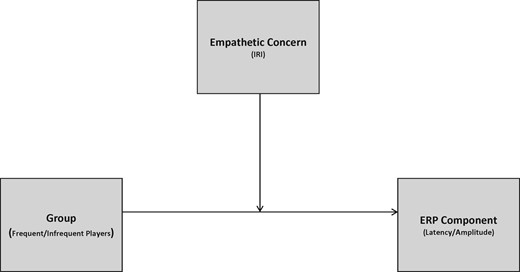
Conceptual diagram of moderation model.
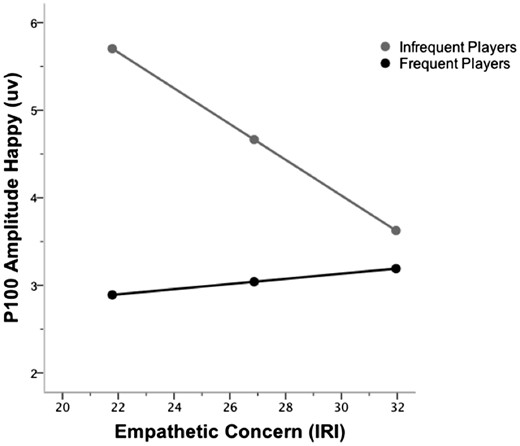
P100 amplitude evoked by happy faces (on go-trials) as a function of group (frequent/infrequent players of graphically violent video games) and empathetic concern. At higher levels of empathy, both groups showed comparable P100 amplitudes. At lower levels of empathy, P100 amplitude was reduced for frequent players. For frequent players, P100 amplitude did not vary as a function of empathy; whereas, increased empathy was related to decreased P100 amplitude for infrequent players.
Results
Questionnaire results
Video-game violence
Per study-selection criteria, the infrequent players of graphically violent video games played less than five hours per week of nongraphically violent video games (rated E10 or lower, M = 2.07 SE = .33 hours per week). Popular games listed by infrequent gamers were typically sports and racing games including FIFA, NBK, and Grand Turismo. Per study-selection criteria, frequent players of graphically violent video games reported playing thirty or more hours per week of graphically violent shooter video games (rated M, M = 41.88, SE = 2.17 hours per week). Popular games listed by gamers were typically first-person shooter games including Call of Duty, Halo, Fall Out, and Grand Theft Auto.
Internal Reactivity Index (IRI)
Empathy was measured using the empathetic concern subscale from the IRI (Davis, 1983). A one-way ANOVA was conducted to examine group differences in empathic concern. As predicted, results showed that frequent players had significantly lower empathic concern scores than infrequent players (F (1, 59) = 7.61, p = 0.008; infrequent players M = 28.55 SE = .78; frequent players M = 25.15, SE = .98).
SST behavioral results
Go-trials
A mixed-model analysis of variance (ANOVA) was conducted to evaluate group differences in gender discrimination accuracy and reaction time (RT) between frequent and infrequent players during go-trials. As an estimate of effect size, partial eta square was reported for each main effect and interaction (Green & Salkind, 2008). See Table 1 for a summary of results. Regarding accuracy, the main effect of group was not significant (p = 0.73). However, a main effect of facial expression valence (i.e. happy or afraid) was observed (p < 0.001). Participants made more errors when responding to afraid facial expressions than happy facial expressions (p <0.001). The group x valence interaction was not significant (p = 0.29). Similar to the accuracy results, the main effect of group on RT was not significant (p = 0.99). RT did not differ with regards to valence (p = 0.19), and the group x valence interaction was not significant (p = 0.83).
Means, standard errors, F-values, and partial eta squared for behavioral data, P100, N170, and N200/P300
| Variables | H | A | F | η2p | FP | IP | F | η2p | H-FP | H-IP | A-FP | A-IP | F | η2p |
|---|---|---|---|---|---|---|---|---|---|---|---|---|---|---|
| Go-trials accuracy | 0.81(0.02) | 0.78(0.02) | 18.20* | 0.23 | 0.80(0.02) | 0.79(0.02) | 0.12 | 0.00 | 0.81(0.02) | 0.80(0.02) | 0.79 (0.02) | 0.77(0.02) | 1.14 | 0.02 |
| Go-trials RT | 772.62(8.02) | 775.05 (8.44) | 1.77 | 0.03 | 773.95(11.57) | 773.72(11.57) | 0.00 | 0.00 | 772.92(11.34) | 772.32(11.34) | 774.97(11.93) | 775.12(11.93) | 0.04 | 0.00 |
| Stop-trials accuracy | 0.86(0.02) | 0.87(0.02) | 2.26 | 0.04 | 0.86(0.02) | 0.86(0.02) | 0.01 | 0.00 | 0.86(0.02) | 0.86(0.02) | 0.86(0.02) | 0.87(0.02) | 0.004 | 0.00 |
| Stop-signal delay | 491.90(2.92) | 490.49(3.92) | −0.29 | |||||||||||
| P100 amplitude | 3.69(0.25) | 3.60(0.24) | 1.43 | 0.02 | 3.10(0.34) | 4.19(0.34) | 5.19* | 0.08 | 3.06(0.36) | 4.32(0.36) | 3.13(0.33) | 4.07(0.33) | 4.31* | 0.07 |
| P100 latency | 105.63(0.84) | 107.01(0.84) | 5.00* | 0.08 | 106.54(1.11) | 106.10(1.11) | 0.08 | 0.00 | 105.35(1.19) | 105.91(1.19) | 107.73(1.19) | 106.30(1.19) | 2.61 | 0.04 |
| N170 amplitude (left) | −2.15(0.31) | −2.52(0.33) | −2.52(0.47) | −2.15(0.43) | −1.91(0.45) | −2.39(0.44) | −2.40(0.43) | −2.64(0.51) | ||||||
| N170 latency (left) | 160.30(1.34) | 160.46(1.34) | 160.77(1.77) | 160.27(2.01) | 160.71(1.93) | 159.89(1.87) | 158.66(2.03) | 162.25(1.73) | ||||||
| N170 amplitude (right) | −2.63(0.31) | −2.87(0.32) | −3.08(0.42) | −2.42(0.45) | −2.30(0.46) | −2.97(0.43) | −2.55(0.46) | −3.20(0.43) | ||||||
| Latency (right) | 162.34(1.08) | 162.55(1.02) | 161.59(1.45) | 163.31(1.66) | 164.35(1.56) | 160.33(1.43) | 162.85(1.56) | 162.24(1.32) | ||||||
| N200/P300 amplitude | 3.72(0.30) | 3.78(0.28) | 0.37 | 0.01 | 3.13(0.41) | 4.36(0.41) | 4.50* | 0.07 | 3.07(0.43) | 4.38(0.43) | 3.20(0.40) | 4.35(0.40) | 0.82 | 0.01 |
| N200/P300 latency | 305.20(3.87) | 306.17(4.08) | 0.05 | 0.00 | 302.01(4.70) | 309.36(4.70) | 1.22 | 0.02 | 297.70(5.47) | 312.70(5.47) | 306.31(5.77) | 306.02(5.77) | 3.07 | 0.05 |
Only means and standard errors are reported for the N170, since the N170 was evaluated in a three-way ANOVA.
Notes: Mean (SE); *p < 0.05; H = happy; A = afraid; FP = frequent player of graphically violent video games; IP = infrequent player of graphically violent video games.
Stop-trials
To assess the influence of frequently playing graphically violent video games on behavioral responses associated with response inhibition, mixed-model ANOVAs were run examining stop accuracy and stop-signal delay (SSD) for the stop-trials only. There was no main effect of group on accuracy (p = 0.94), there was no main effect of valence (p = 0.14), and the group × valence interaction was not significant (p = 0.95). On stop-trials in lieu of RT (as a correct response is achieved by withholding a response) the average delay between the presentation of the face and the stop-signal was calculated for correct trials (withholding a response). Because face valence was randomized across trials and the staircase is adjusted every two trials, SSD is not calculated separately for happy and afraid faces. An independent samples t-test showed that SSD did not differ between groups (t (60) = −0.29, p = 0.77). In summary, both groups showed comparable behavioral performance across go- and stop-trials.
SST ERP results
Go-trials
P100 amplitude and peak latency. Two mixed-model analysis of variances (ANOVAs) were run to examine the effects of group and valence on occipital P100 mean amplitude and latency (see Figure 2). Regarding amplitude, there was a main effect of group. P100 amplitude was decreased for frequent players of graphically violent video games compared to infrequent players (p = 0.03). The effect of valence was not significant (p = 0.24). A significant group × valence interaction was observed (p = 0.04). Analyses probing the interaction (see Figure 2) showed that frequent players of graphically violent video games had reduced P100 amplitudes evoked by happy facial expressions than infrequent players (F(60, 1) = 5.61, p = 0.021). There were no group differences in P100 amplitude evoked by afraid expressions (F(60, 1) = 3.18, p = 0.08). Neither group distinguished between valence (p > 0.05).
A second mixed-model ANOVA examined the influence of group and valence on the P100 latency. There was no main effect of group (p = .78). A main effect of valence was observed, with afraid facial expressions evoking later latencies than happy facial expressions (p = 0.03). The group x valence interaction was not significant (p = 0.11). Across both groups, P100 latency for afraid facial expressions was later than the latency for happy facial expressions (See Table 1 for means and standard errors), which either indicates that participants were slower to disengage their attention from afraid facial expressions or afraid facial expressions capture attention later than happy facial expressions.
P100 is associated withempathy.Given the a priori hypothesis that empathy would be associated with P100, moderation analyses were conducted to evaluate whether empathetic concern moderates the relationship between frequency of playing graphically violent video games and P100 amplitude. For all moderation analyses, frequency of video game play was dummy coded (0 = infrequent players; 1 = frequent players), X = frequency of video game play, M(oderator) = empathetic concern, and Y = ERP components (happy amplitude, afraid amplitude). When the full regression model and the interaction were both significant, interactions were probed, plotted, and interpreted. The conditional effect of X on Y was evaluated at +1/−1 s.d. from the sample mean of the moderator (Hayes, 2013). Results showed that at low levels of empathy, the frequent players of graphically violent video games had significantly reduced P100 amplitudes for happy facial expressions compared to infrequent gamers (Figure 3 for conceptual model, Figure 4 for interaction, and Table 2 for regression statistics). At higher levels of empathy (empathy score 1 s.d. above the mean = 31.96), both groups showed comparable P100 amplitudes (p = 0.55). At lower levels of empathy (empathy score 1 s.d. below the mean = 21.78), P100 amplitude was reduced for the frequent players of graphically violent video games (p = 0.001). For the frequent players, P100 amplitude did not vary as a function of empathy (B = .029, t(1, 28) = .475, p = 0.639). However, empathy was a significant predictor for P100 amplitude for the infrequent gamers, such that increased empathy was related to decreased P100 amplitude (B = -.204, t(1, 29) = −2.362, p = 0.025). The full regression model (p = 0.05) and interaction (p = 0.08) were not significant for afraid P100 amplitude although the direction of the results mirrored the findings for happy P100 amplitude.
Regression to evaluate moderation model
| Predictor | B | SE | t | R2 |
|---|---|---|---|---|
| Model summary | R2 = 0.195F (3, 57) = 4.608* | |||
| Group | −7.904 | 2.913 | −2.713* | |
| Empathy | −2.04 | 0.082 | −2.482* | |
| Group x empathy | 0.234 | 0.105 | 2.219* | |
| R2 increase due to interaction | ΔR2 = 0.070ΔF (1, 57) = 4.926* |
Group × empathy predicting P100 (happy) amplitude.
Note: Group dummy coding: Infrequent player =0; Frequent player =1.
p < 0.05.
N170amplitudeandpeaklatency. The N170 was measured bilaterally at two posterior sites (clusters of electrodes corresponding to T5/left posterior region and T6/right posterior region, see Figure 5) to examine potential lateralized differences in face processing. An omnibus group × valence × hemisphere mixed-model ANOVA was run to examine N170 mean amplitude. The means and standard error for these variables are presented in Table 1. There was not a significant effect of group (F (1, 60) = .78, p = 0.38, η2p= 0.01). There was a main effect of valence (F (1, 60) = 15.44, p < 0.001, η2p = 0.21) which indicated that N170 amplitude evoked in response to afraid facial expressions was larger compared to happy facial expressions. This is consistent with previous research, suggesting that more attentional resources are recruited to process afraid facial expressions than happy facial expressions. The effect of hemisphere was not significant (F(1, 60) = 2.74, p = 0.10, η2p = 0.04), The valence × group interaction was not significant (F(1, 60) = 0.70, p = 0.41, η2p = 0.01), the valence × hemisphere interaction was not significant (F(1, 60) = 0.76, p = 0.39, η2p = 0.01), the hemisphere × group interaction was not significant (F(1, 60) = 0.33, p = 0.57, η2p = 0.006), and the three-way interaction was not significant (F(1, 60) = 0.57, p = 0.46, η2p = 0.009).
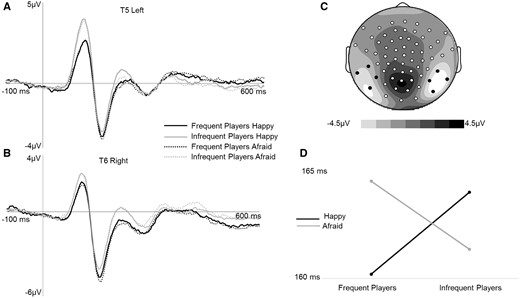
(A) Grand average N170 ERPs (time-locked to face-onset, 140–200 ms post face on-set) for correct trials averaged across four left posterior electrodes indicated in black on the topographic map. Afraid facial expressions evoked more negative N170 amplitudes at T5. (B) Grand average N170 ERPs (time-locked to face-onset, 140-200 ms post face on-set) for correct trials averaged across four right posterior electrodes indicated in black on the topographic map. Afraid facial expressions evoked more negative N170 amplitudes at T6. (C) Scalp topography for the average of all four conditions (140–200 ms post-face onset). (D) Interaction between facial expression type (happy and afraid) and group (frequent compared to infrequent players) for right N170 (50% fractional area) latency. Frequent players had faster latencies for happy compared to afraid facial expressions at T6. Infrequent players did not distinguish between facial expressions.
Similarly, an omnibus group × valence × hemisphere × mixed-model ANOVA was run to examine N170 latency. There were no significant main effects for valence (F(1, 60) = 0.05, p = 0.83, η2p = 0.001). The valence × group interaction was significant (F (1, 60) = 5.38, p = 0.02, η2p = 0.08). The valence × hemisphere interaction was not significant (F (1, 60) = 0.001, p = 0.97, η2p = 0.00), the hemisphere × group interaction was not significant (F (1, 60) = 3.18, p = 0.08, η2p = 0.05), and the three-way interaction was not significant (F (1, 60) = 0.17, p = 0.68, η2p = 0.003). The significant valence × group interaction for latency was probed and plotted (see Figure 5 (F(1, 122) = 7.15, p =0.009, η2p = 0.06 and the results indicated that infrequent players of graphically violent video games had faster latencies for afraid facial expressions compared to happy facial expressions (t = 2.44, p = 0.02), while frequent players of graphically violent video games had faster latencies for happy as compared to afraid facial expressions (t = −1.52, p = 0.14. Post hoc moderation analyses were run to explore the relationship between N170 latency and empathy, but no significant findings emerged (all ps > 0.05 for regression models and interactions).
Stop trials
N200/P300amplitude. Mixed-model ANOVAs examined group effects on amplitude and latency of the frontocentral N200/P300 complex associated with response inhibition (see Figure 6). Frequent players of graphically violent video games had a reduced mean amplitude compared to infrequent players of graphically violent video games (p = 0.04). The effect of valance was not significant (p = 0.55). The group × valence interaction was not significant (p = 0.37). For latency, there was no effect of group (p = 0.27, η2G = 0.01), no effect of valence (p = 0.83), and the group x valence interaction was not significant (F (1, 60) = 3.07, p = 0.09, η2G = 0.02). See Table 1 for means and standard errors. In summary, frequent players of graphically violent video games had reduced N200/P300 amplitudes across all stimuli compared to infrequent players of graphically violent video games, indicating that frequent players recruited less cognitive resources to successfully inhibit their responses in the context of implicit emotional distractors during stop trials. Post hoc moderation analyses were run to explore the relationship between N200/P300 amplitude and empathy, but no significant findings emerged (all ps > .05 for regression models and interactions).
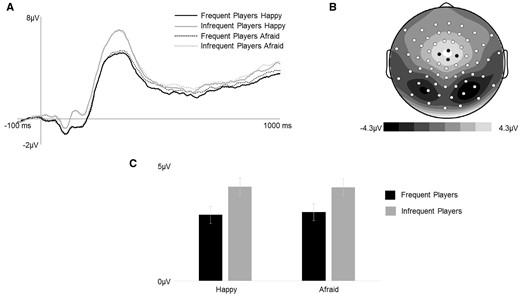
. (A) Grand average ERPs (time-locked to stop-signal onset) for correct trials averaged across four central electrodes indicated in black on the topographic map. (B) N200/P300 (140–400 ms post stop-signal onset) mean amplitude scalp topography for the average of both facial expression types across both groups. (C) N200/P300 mean amplitude (140–400 ms post stop-signal onset) for facial expression types.
Discussion
Findings from the present study contribute to the growing body of literature suggesting that chronic exposure to violent media may modulate neural function associated with affect and cognition. The present study showed that frequent players of graphically violent video games were less empathetic than infrequent players of graphically violent video games, which is consistent with previous research (i.e. Anderson et al., 2010). Frequent players of graphically violent video games had smaller P100 amplitudes in response to happy facial expressions compared to infrequent players, and this relationship was moderated by empathy. At low levels of empathy, frequent players had reduced P100 amplitudes compared to infrequent players. At high levels of empathic responding there was no difference between frequent and infrequent players of graphically violent video games. Together, these findings suggest that frequent players of graphically violent video games attend less to valenced facial expressions compared to infrequent players of graphically violent video games, particularly for those with less empathetic concern for others.
With regard to response inhibition, frequent players of graphically violent video games displayed reduced N200/P300 amplitude evoked by the stop-signal, indicating the recruitment of fewer neural resources during task performance compared to infrequent players of graphically violent video games. Since it is possible that video games ‘train’ cognitive control functions (Hummer et al., 2010), frequent players of graphically violent video games may simply be better at inhibitory response tasks than infrequent players of graphically violent video games. Alternatively, frequent players of graphically violent video games may be better at inhibiting behavior in the context of affective distractors because valenced information is less attended to compared to infrequent players, and thus does not interfere with inhibitory response functions.
Frequent and infrequent players of graphically violent video games showed comparable behavior (i.e. reaction time and accuracy) on a gender discrimination task which included distracting emotion information (faces with happy or afraid expressions). Likewise, frequent and infrequent players showed comparable response inhibition behavior in the presence of distracting emotional information. Both frequent and infrequent players of graphically violent video games were less accurate at identifying the gender of afraid faces. Previous research has shown that threat-related stimuli are highly attention-capturing and difficult to disengage from (Schupp et al., 2004). As a result, task performance can be impeded in the presence of distracting threat-related stimuli (Pessoa, 2009). It is also possible that afraid facial expressions make it more difficult to identify gender, and more experimental research is warranted to characterize whether differences in facial expression valence confound gender discrimination.
Considering the neural correlates associated with implicit attention to facial expressions, frequent players of graphically violent video games showed decreased P100 amplitude (indicative of visual cortical activity) across valenced stimuli, suggesting that frequent players attend less to facial expressions as compared to infrequent players. Infrequent players had a larger P100 amplitude in response to happy facial expressions compared to frequent players, and this finding is consistent with previous research that has shown that facial expression valence modulates P100 amplitudes (Turetsky et al., 2007; Blechert et al., 2012; Stockdale et al., 2015). While short-term media violence effects did not modulate P100 (Stockdale et al., 2015), the present study suggests that chronic exposure to media violence is associated with individual differences in perception of valenced facial expressions, and this finding further supports the hypothesis that frequent players of graphically violent video games are numb to facial expressions. Regarding latency, both frequent and infrequent players of graphically violent video games showed later P100 latencies for afraid as compared to happy facial expressions, indicating that threat-related stimuli more readily capture attention and are difficult to disengage from relative to other stimuli (Schupp et al., 2004).
Additionally, empathy moderated the relationship between gaming frequency and P100 amplitude. At low levels of empathy, frequent players of graphically violent video games had reduced P100 amplitudes to happy facial expressions compared to the infrequent players of graphically violent video games, indicating that frequent players of graphically violent video games with low levels of empathy allocate fewer attentional resources toward positively valenced stimuli. For infrequent players, as empathy increased, P100 amplitude decreased. Empathy did not modulate P100 amplitude within the frequent players of graphically violent video games, although this may be due to a relatively limited (low) range in empathy within the frequent players. Empathy is a complex social-affective process which requires several brain regions working in tandem, including bottom-up processing involving amygdala, somatosensory cortex, and insula, as well as top-down processing involving the ACC and medial prefrontal cortex (Decety et al., 2009). Decety and Jackson (2004) argued for a neurobiological model of empathic responding that integrates bottom-up processing of affective information and top-down processes of perspective taking, motivations, intentions, and self-regulation. Perception of facial expressions has been shown to result in facial mimicry and mood modulation in viewers, even when the task does not require explicitly attending to the emotional information displayed by the face. Decety (2011) argued that this initial perception of affective information ignites the cascade of empathic responding processes. The present study advances understanding regarding how empathy influences early perception of facial expressions in visual cortex and how early affective perceptual processes implicitly affect subsequent response inhibition in frequent and infrequent players of graphically violent video games.
Across both frequent and infrequent players, more negative N170 amplitudes were evoked for afraid facial expressions as compared to happy facial expressions and this finding is consistent with previous research that has shown that afraid facial expressions evoke more negative N170 amplitudes and faster peak latencies compared to other emotional expressions (Blau et al., 2007). Previous researchers have proposed that the brain prioritizes threat-related information to enhance survival (Krusemark and Li, 2013). Consistent with these findings, infrequent players of graphically violent video games had faster latencies for afraid expressions as compared to happy expressions. However, frequent players of graphically violent video games displayed the opposite pattern, with faster latencies evoked in response to happy expressions than afraid expressions. The group difference with regard to N170 latency evoked in response to facial expressions suggests that chronic exposure to media violence modulates processing of facial expressions during structural encoding, which previous researchers have shown is influenced by perceptual information (Caharel et al., 2005; Rossignol et al., 2005; Blau et al., 2007). However, additional longitudinal and experimental research is needed to establish a causal relationship.
Frequent and infrequent players of graphically violent video games showed comparable behavioral performance in response inhibition during stop trials. However, frequent players had significantly reduced N200/P300 amplitudes when inhibiting behavior compared to infrequent players of graphically violent video games. There are two potential explanations for this observed decrease in amplitude. When frequent gamers are playing violent video games they are constantly required to inhibit their behavior in order to only shoot or attack certain players, which may lead to a practice effect that carries over to other domains and tasks such that frequent gamers expend less cognitive resources to inhibit a response (Hummer et al., 2010). The task used in the present study, which required participants to watch a screen and respond or withhold a response, may be somewhat comparable to the gaming environment. As a result, the reduction in N200/P300 amplitude for frequent players of violent video games may simply reflect a practice effect. Although there were not differences in behavioral performance observed during the stop-signal trials, it is plausible that the effect size is larger for N200/P300 component than the behavioral (RT) effect size given that there is often more variance observed in response times than ERPs. A larger sample may be needed to observe this group differences in behavioral performance.
It is also plausible that frequent players of graphically violent video games are attending less to emotional facial expressions so they do not have to exert neural resources to disengage attention from distracting emotional information to inhibit behavior. Minimal research has investigated inhibitory response in the context of emotional distractors. Pessoa (2009) found that during an implicit SST using emotional facial expressions, participants’ performance improved in the presence of fearful and happy facial expressions as compared to neutral facial expressions. However, when the faces were extremely fearful or extremely happy participants’ performance decreased as compared to neutral faces, suggesting that highly arousing facial expressions (regardless of valence) can impede response inhibition. Finally, it is possible that the reduction in N200/P300 amplitude for observed in the present study for frequent gamers reflects the interaction between a carry-over practice effect as well as a lack of attention to valenced facial expressions. Future studies should be designed to disentangle the potential practice/training effects and emotional effects of chronic media violence exposure on response inhibition.
While the present study highlights key neural differences in frequent and infrequent players of graphically violent video games, it is not without limitations. The present study is cross-sectional and thus it cannot address the direction of effects of causality. Individuals who have less empathy and attend less to facial expressions may be more likely to become immersed in violent video game play. Even given the above-mentioned limitations, the present study is an important initial step in understanding the potential effects of chronic media violence exposure on the neurobiological correlates of face processing and response inhibition. There are many males between the ages of 18 and 25 years who are spending a significant amount of their waking hours playing very violent video games. Most of these gamers likely have decreased empathic concern, decreased cognitive resources allocated to processing facial expressions, and have modulations in the neural processes associated with processing threatening and nonthreatening facial expressions, and heightened inhibitory response abilities. It is possible that chronically playing violent video games can leave gamers callous, cool and in control. Additional research is needed to better inform policy as well as the community at large regarding the substantial social-cognitive risks associated with violent video play.
Conflict of interest. None declared.
Acknowledgements
The authors would like to thank Callie Short, Maher Hammed, and Kavita Patel for their contributions to the project, and the Graduate School and Office of the Provost at Loyola University Chicago for assistance with funding this research, and Noni Gaylord-Harden for her valuable insights that contributed to this project.
References
