


Abstract
The neural underpinnings of repetitive behaviors (RBs) in autism spectrum disorders (ASDs), ranging from cognitive to motor characteristics, remain unknown. We assessed RB symptomatology in 50 ASD and 52 typically developing (TD) children and adolescents (ages 8–17 years), examining intrinsic functional connectivity (iFC) of corticostriatal circuitry, which is important for reward-based learning and integration of emotional, cognitive and motor processing, and considered impaired in ASDs. Connectivity analyses were performed for three functionally distinct striatal seeds (limbic, frontoparietal and motor). Functional connectivity with cortical regions of interest was assessed for corticostriatal circuit connectivity indices and ratios, testing the balance of connectivity between circuits. Results showed corticostriatal overconnectivity of limbic and frontoparietal seeds, but underconnectivity of motor seeds. Correlations with RBs were found for connectivity between the striatal motor seeds and cortical motor clusters from the whole-brain analysis, and for frontoparietal/limbic and motor/limbic connectivity ratios. Division of ASD participants into high (n = 17) and low RB subgroups (n = 19) showed reduced frontoparietal/limbic and motor/limbic circuit ratios for high RB compared to low RB and TD groups in the right hemisphere. Results suggest an association between RBs and an imbalance of corticostriatal iFC in ASD, being increased for limbic, but reduced for frontoparietal and motor circuits.
Introduction
Repetitive behaviors (RBs) are a prevalent feature of autism spectrum disorders (ASDs) and comprise a range of motor, behavioral or cognitive abnormalities. RBs have been conceptually classified as lower-order (i.e. stereotypies and repetitive manipulation of objects) and higher-order (i.e. restricted interests and adherence to routines) (Turner, 1999). Although they have been considered characteristic of the disorder since its initial description (Kanner, 1943), RBs and restricted interests may occur relatively independently of sociocommunicative symptoms (Happé et al., 2006), and are conceptualized as a separate core domain of impairment in the Diagnostic and Statistical Manual (DSM)-5 (American Psychiatric Association, 2013). RBs in ASDs have been shown to be linked with abnormal sensory processing (Gabriels et al., 2008), reduced behavioral inhibition (Mosconi et al., 2009; Agam et al., 2010) and flexibility (D'Cruz et al., 2013), reduced cognitive set shifting (Miller et al., 2015) and anxiety (Rodgers et al., 2012; Lidstone et al., 2014). Furthermore, RB symptomatology tends to improve with age (Esbensen et al., 2009).
Neuroanatomically, RBs have been associated most notably with the basal ganglia, in particular the striatum, in addition to cortical regions spanning frontal, temporal and parietal lobes. Basal ganglia connections with cortical areas are segregated into parallel circuits (Alexander et al., 1986), which can be broadly divided into circuits supporting limbic, cognitive and motor functions (Groenewegen et al., 1993; Jaspers et al., 2016). Each circuit consists of a distinct cortico-striato-thalamo-cortical pathway, and has additional connections with the subthalamic nucleus and substantia nigra. Functional integration among circuits likely occurs at multiple overlapping points along this pathway (McFarland and Haber, 2000; Draganski et al., 2008). In particular, the substantia nigra, important for acquiring learned behavior (Schultz et al., 1997), interfaces with each corticostriatal circuit with varying degrees of connectivity. While the ventral striatum has strong efferent connectivity with the substantia nigra, its afferent connections from this region are weak. Conversely, the dorsal striatum has strong afferent, but weak efferent connectivity with the substantia nigra (Somogyi et al., 1981; Haber et al., 2000), and the central striatum has an intermediate degree of input and output. Thus, a feedforward path in striato-nigro-striatal circuitry suggests that limbic processing directs frontoparietal function, which, in turn, directs motor function (Haber and Knutson, 2010), and has particular implications for learning and habit formation (Everitt and Robbins, 2005). It has been suggested that RBs may reflect impairment within a given subcortico-cortical circuit or inefficient transfer of information between striatal circuits (Langen et al., 2011b). The heterogeneity of RBs in ASD, in particular, may reflect unique disturbances among the complexity of striatal circuitry (Mason, 2006).
Both anatomical and functional evidence indicate atypical maturation of the striatum in ASD. While striatal volume (controlling for total cerebral volume) has been reported to be normal in preschool children with ASD (Estes et al., 2011), it is increased in adolescents and adults (Hollander et al., 2005; Langen et al., 2009; Estes et al., 2011). More specifically, RBs have been associated with smaller striatal volume in pre-school age children (Estes et al., 2011) and adolescents (Langen et al., 2009) as assessed by the Autism Diagnostic Observation Schedule (ADOS-2) (Lord et al., 2012) and Autism Diagnostic Interview-Revised (ADI-R) (Lord et al., 1994), respectively. Larger striatal volume in adults has also been associated with RB measures on the ADI-R (Hollander et al., 2005). Increased growth rate of the structure in adolescents is linked to increased higher-order RBs on the ADI-R (Langen et al., 2014), suggesting that RBs may manifest in association with striatal abnormalities.
Functional connectivity magnetic resonance imaging (MRI) studies, examining low-frequency blood-oxygen-level dependent (BOLD) signal correlations (Van Dijk et al., 2010), also indicate atypical developmental trajectories of basal ganglia connectivity in ASDs, based on cross-sectional data. In typical development, 7–9 year old children have shown increased functional connectivity between basal ganglia and cerebral cortex compared to young adults, who have greater long-range cortico-cortical connectivity (Supekar et al., 2009). The emergence of long-range functional networks is consistent with a local to distributed pattern of connectivity across development (Fair et al., 2009). In ASD, contrasting maturational trajectories have been identified, with age-related connectivity increases between left inferior ventral striatum and fusiform gyrus, and between left ventral rostral putamen and superior temporal gyrus in adolescents and adults with ASDs, but inverse age-related changes in typically developing (TD) peers (Padmanabhan et al., 2013). Overconnectivity of corticostriatal circuitry may indicate immaturity of networks and impaired pruning, which is essential to emergence and function of neural networks (Supekar et al., 2009). Anomalous subcortico-cortical connectivity may affect increasingly complex functions that emerge later in development and are supported by long-range cortico-cortical circuits.
Aberrant patterns of striatal connectivity have also been directly linked to RBs. In 7–13 year old children with ASDs, increased striatal connectivity was found with heteromodal and limbic cortices as well as brainstem (Di Martino et al., 2011). Specifically, overconnectivity between the right ventral rostral putamen and the right superior temporal gyrus was associated with increased RBs, while overconnectivity between the right dorsal caudal putamen and the pons was linked to decreased RBs. Abnormal corticostriatal connectivity with the superior temporal gyrus may also be associated with impaired social reward processing. Related findings have, in fact, linked corticostriatal overconnectivity in ASDs with decreased activation to social rewards for the left caudate and with higher RBs for the right caudate (Delmonte et al., 2013). Taken together, abnormal corticostriatal connectivity may affect social processing and RBs, both of which are core features of ASDs.
Examining cortical connectivity for functionally distinct seeds of the basal ganglia and associations between circuits may provide a framework for identifying relative contributions of limbic, cognitive and motor circuits to RBs in ASDs. While RBs comprise a diverse class of characteristics in ASDs, the neural correlates of different RBs remain relatively unexplored. This may be partly due to the limited scope of testing instruments used to assess RBs in this population, for which diagnostic measures with poor psychometric properties have been most commonly employed. ADI-R and ADOS-2 are diagnostic instruments, designed to assess categorically the presence (or absence) of core symptomatology, including RBs. Their RB scales include few items (four on ADOS, eight on ADI-R), each intended to assess a broad range of behavioral manifestations. RB scores on ADOS and ADI-R therefore likely underrepresent the spectrum of RBs (Lecavalier et al., 2006), which is clinically diverse in ASDs (Lam, Bodfish and Piven, 2008).
The Repetitive Behavior Scale-Revised (RBS-R), which comprehensively assesses the full range of RBs, was created based on clinical observations (Bodfish et al., 1999; Bodfish et al., 2000) and has been statistically validated in a five-factor model showing optimal fit (Lam and Aman, 2007). To our knowledge, the current study is the first systematic investigation of the links between RBS-R metrics and intrinsic functional connectivity (iFC) of basal ganglia circuits in ASDs. In view of previous findings, we predicted that participants with ASDs would show immature and aberrant corticostriatal iFC patterns. To address the specific hypothesis of an ‘imbalance’ between ventral and dorsal corticostriatal circuits, and given the hierarchical influence of limbic circuits over cognitive and motor circuits, we examined iFC ratios between corticostriatal circuits and their association with particular types of RBs. Reduced iFC in cognitive relative to limbic striatal circuits (i.e. lower frontoparietal/limbic ratio) may reflect immature cognitive circuits and less cognitive control and was, therefore, expected to be associated with the RBS-R Cognitive Subtotal score and scores on three RBS-R subscales measuring ‘higher-order’ RBs (Ritualistic/Sameness, Compulsive, Restricted interests). Similarly, reduced iFC in motor relative to limbic striatal circuits (i.e. lower motor/limbic ratio) may capture immature motor functioning and was predicted to correlate with the Motor Subtotal score and scores on two RBS-R subscales measuring ‘lower-order’ RBs (Stereotypic and Self-injurious).
Materials and methods
Participants
The sample consisted of 58 children and adolescents with ASDs and 55 TD peers. Exclusion for excessive motion (see below) resulted in a final sample of 50 ASD and 52 TD participants. Groups were matched for age, sex, handedness, non-verbal IQ and head motion (Table 1). Diagnoses of ASD were confirmed using the ADOS-2 (Lord et al., 2012), the ADI-R (Lord et al., 1994) and expert clinical judgment based on DSM-5 criteria (American Psychiatric Association, 2000). Two ASD participants fulfilled criteria on the DSM-IV-TR (American Psychiatric Association, 2000) (one for autistic disorder, one for Asperger’s disorder), but not on the DSM-5, because their RB scores were below the DSM-5 threshold for this domain. In the interest of extending the range of variability in RBs within our ASD group, these children were retained. All participants were free of known genetic (e.g. Fragile-X or Rett syndrome) and neurological conditions (e.g. epilepsy) often associated with ASDs. Current medication and comorbidity information was available for 43 ASD participants (see Supplementary Table S1). TD participants had no personal or family history of ASDs or any other neuropsychiatric conditions. Informed assent and consent were obtained from all participants and their caregivers in accordance with the University of California, San Diego, and San Diego State University Institutional Review Boards. A subset of the data presented here have been shared through the Autism Brain Imaging Data Exchange (Di Martino et al., 2014; Di Martino et al., 2017).
Participant demographics
| Full sample | |||||
|---|---|---|---|---|---|
| Group | Group matchinga | ||||
| ASD (n = 50) | TD (n = 52) | df | t or x2 | P | |
| Sex (male:female) | 44:6 | 42:10 | 100 | 1.27 | 0.260 |
| Handedness (right:left) | 41:9 | 45:7 | 100 | 0.65 | 0.421 |
| Age | 13.2 (2.7) 8–17 | 13.7 (2.7) 8–17 | 100 | 0.81 | 0.347 |
| Verbal IQ | 102.8 (18.8) 55–147 | 107.3 (11.9) 73–133 | 100 | 1.48 | 0.143 |
| Non-verbal IQ | 105.0 (17.1) 62–140 | 106.8 (13.8) 62–137 | 100 | 0.59 | 0.554 |
| Root mean square of displacement | 0.065 (0.030) 0.017–0.122 | 0.063 (0.037) 0.017–0.215 | 100 | 0.25 | 0.805 |
| ADOS-2: SA | 11.10 (4.35) 5-20 | ||||
| ADOS-2: RRB | 4.55 (4.33) 0–19 | ||||
| ADI: Social | 18.86 (4.77) 6–28 | ||||
| ADI: Comm | 13.66 (4.90) 2–24 | ||||
| ADI: RRB | 5.83 (2.28) 1–12 | ||||
For all group-averaged variables, numbers represent: mean (standard deviation) and range.
P-values calculated using χ2 for sex and handedness; t-tests used for all others.
Data acquisition
Imaging data were acquired on a GE 3T MR750 scanner with an 8-channel head coil. Head movement was minimized with foam pillows around participants’ heads. High-resolution structural images were acquired with a standard fast spoiled gradient echo T1-weighted sequence (repetition time: 11.08 ms; echo time: 4.3 ms; flip angle: 45°; 256 × 256 matrix; 180 slices; 1 mm3 isotropic resolution). Functional T2*-weighted images were obtained using a single-shot gradient-recalled, echo-planar pulse sequence (repetition time: 2000 ms; echo time: 30 ms; 3.4 mm slice thickness; in-plane resolution: 3.4 mm2). A 6:10 min resting-state scan was acquired consisting of 185 whole-brain volumes. Participants were instructed to keep their eyes open; compliance was monitored with a video camera mounted inside the MRI bore.
RBS-R and RB subgroups
RB was assessed through caregiver-report using the RBS-R in 36 ASD participants and 34 TD participants. Caregivers used a four-point scale (0 = behavior does not occur, 1 = behavior occurs and is a mild problem, 2 = behavior occurs and is a moderate problem, 3 = behavior occurs and is a severe problem) to rate the severity of RBs over the most recent month. While the scale consists of six subscales, a factor analysis found a five-factor solution to be the best fit for grouping RBs (Lam and Aman, 2007). Scores were calculated accordingly for five factors: (i) Ritualistic/Sameness, (ii) Self-injurious, (iii) Stereotypic, (iv) Compulsive and (v) Restricted Interests. Additionally, the Wechsler Abbreviated Scale of Intelligence, 2nd Edition was administered to all participants (Wechsler, 2011).
To explore heterogeneity of RBs in the ASD group with respect to connectivity patterns, subgroups were created using a cut-off score of 22 for the Total RBS-R score. Given the lack of normative data available for RBs in ASDs, this cut-off approximated a median split while reflecting a gap in the distribution of scores within the ASD group. Subgroups included ASD participants with high RBs (ASDhigh; n = 17) and ASD participants with low RBs (ASDlow; n = 19), as well as TD participants for whom RB scores were available (n = 34). However, one TD participant with unusually high RB scores (>10 SD above the TD mean) was excluded from subgroup analyses. Analyses of variance (ANOVAs) were performed to assess possible differences between subgroups for three corticostriatal circuit indices and two ratios of corticostriatal connectivity per hemisphere. While subgroups did not significantly differ on age, sex, handedness, non-verbal IQ, medication, co-morbidities or in-scanner motion, age and motion [root mean square of displacement (RMSD)] were controlled for in all subgroup analyses (see Supplementary Tables S2 and S3).
Functional MRI (fMRI) data preprocessing and motion censoring
Data were preprocessed and analyzed using the Analysis of Functional Neuroimaging suite (AFNI; Cox, 1996) and FMRIB Software Library (Smith et al., 2004). The first five time points were discarded, and the remaining 180 time points were motion, slice-time and field-map corrected. Functional data were aligned to anatomical images, resampled to 3.0 mm isotropic voxels, and warped to the standard MNI152 template using a non-linear transformation. Data were spatially blurred to a full-width at half-maximum of 6 mm and band-pass filtered (0.008 < f < 0.08 Hz) (Cordes et al., 2001), using a second-order Butterworth filter. Average time series from trimmed white matter and ventricular compartments (from Freesurfer segmentation) as well as their first derivatives were regressed from the data.
Additional preprocessing steps were taken to control effects of head motion. At the subject-level, time points with >0.5 mm displacement relative to the previous volume were censored including two immediately following time points (Power et al., 2015). Any portions of the time series with <10 consecutive time points remaining were also censored. Participants with <80% time points after censoring were excluded entirely from all analyses (eight ASD, three TD). The number of censored time points did not significantly differ between groups (ASD: M = 12.8, SD = 21.6; TD: M = 7.4, SD = 16.7; P = 0.76), and was not correlated with RBS-R total or subscale scores (P > 0.39 for all). Following motion censoring, groups in the final sample did not differ on average head motion calculated as the RMSD (P = 0.80), nor on any single rigid-body motion parameter (with P-values for x, y, z, roll, pitch and yaw: 0.11, 0.23, 0.40, 0.53, 0.51 and 0.42, respectively). As an additional precaution, RMSD was included as a covariate in Pearson correlation analyses with RBS scores.
Striatal seeds and cortical regions of interest
Striatal regions of interest (ROIs) were based on functional parcellations by Choi et al. (2012), corresponding to three corticostriatal circuits implicated in ASDs (Langen et al., 2011a). These included striatal seeds corresponding to limbic, frontoparietal control and motor circuits (see Supplementary Figure S1A), with separate seeds in each hemisphere.
Cortical ROIs were derived empirically, by obtaining whole-brain connectivity effects (significant clusters) for striatal seeds (as described in the following section). ROIs specifically identified in each individual participant were deemed preferable to group- or literature-based ROIs, given that anatomical location of network nodes can vary significantly, especially in clinical populations (Wang and Liu et al., 2014). For whole-brain cerebral cortical analyses (excluding insula to avoid signal bleeding; Choi et al., 2012), standardized connectivity maps were generated for each participant, cluster-corrected, and entered into combined-group (ASD and TD) one-sample t-tests (Figure 1). From the resulting combined-group connectivity maps, thresholds were lifted (t = 10) to identify cortical areas maximally connected with each striatal seed. Overlap (where a voxel belonged to more than one cortical functional parcellation) was identified, and each voxel was assigned to the functional parcellation with which it most strongly correlated at the combined group level. The resulting group-level masks for each cortical ROI were used as ‘search masks’ at the subject level (see Supplementary Figure S1B). For each subject, the voxel within the search mask that correlated most highly with its respective striatal seed was identified and a spherical ROI (6 mm radius) was drawn around that voxel.
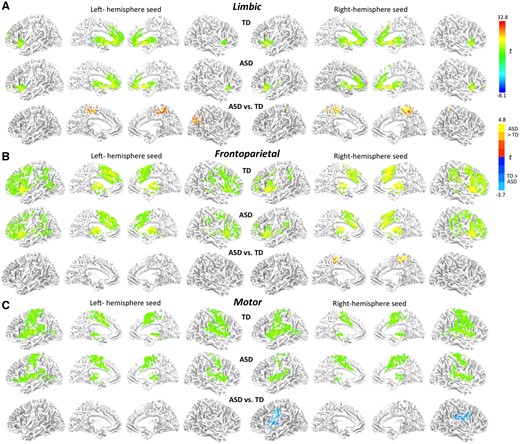
Surface renderings of within-group and between-group functional connectivity effects for three striatal seeds per hemisphere in (A) limbic, (B) frontoparietal and (C) motor parcels (as shown in Supplementary Figure S1A; all clusters).
iFC analysis and correlations with RBs
For the whole-brain analyses average time series were extracted from each striatal seed for each participant and correlated with every other brain voxel. Correlations were converted using Fisher’s r-to-z transform and entered into within- and between-group t-tests per seed.
Connectivity maps were cluster-corrected using AFNI’s 3dClustSim (version-release: October 2016) with an uncorrected threshold of P = 0.05, and a minimum cluster size of 218, for a corrected P < 0.01. For clusters showing group difference in connectivity with strongest effect sizes, connectivity (z′) values were extracted for each subject.
For each cortical ROI, average time series were extracted and Pearson-correlated with the average time series from its respective striatal seed. Correlation coefficients were Fisher r–z transformed, resulting in three corticostriatal circuit indices per hemisphere. To address the hypothesis of ‘imbalance’ between ventral divisions of the striatum compared to central and dorsal divisions in ASDs, relative measures of connectivity were calculated comparing limbic circuit indices with frontoparietal and motor circuit indices separately for each hemisphere. In particular, the corticostriatal circuit index for the frontoparietal circuit was divided by the corticostriatal circuit index of the limbic circuit. Similarly, the motor corticostriatal circuit index was divided by the limbic corticostriatal circuit index. This resulted in a frontoparietal/limbic and a motor/limbic ratio for each hemisphere. Finally, a logarithmic transform was applied to each ratio to normalize the variance. Within the ASD group, Pearson correlation was used to correlate the Total score from the RBS-R with three corticostriatal circuit indices and two ratios for each hemisphere. For protection against excessive Type-2 error from multiple comparison correction, only connectivity measures that were significantly correlated with the RBS-R Total score were further examined for correlations with RBS-R (‘lower-order’) Motor and (‘higher-order’) Cognitive subtotals in addition to five RBS-R subscales.
Results
Whole-brain analyses
In both groups, the three striatal seeds showed distinct connectivity patterns, which were largely symmetrical for homologous left and right hemisphere seeds (Figure 1). Limbic seeds in the ventral striatum showed BOLD correlations with the orbitofrontal, insular and anterior cingulate cortices. The frontoparietal seeds in anterior striatum showed most robust connectivity with lateral prefrontal and medial superior frontal regions, while the motor seeds in the posterior putamen showed iFC with the precentral and postcentral gyri, supplementary motor and perisylvian areas.
In direct group comparisons, iFC differences were found for several seeds (Figure 1; Supplementary Table S4 for cluster listings). The ASD group exhibited stronger connectivity for the limbic seeds with parieto-occipital and medial paracentral regions, but weaker connectivity for the right motor seed with motor and premotor regions.
Corticostriatal circuit indices and ratios
Circuit indices and ratios were compared between TD and ASD groups. No differences for these iFC measures were found. However, given the heterogeneity of RB symptoms within the ASD population and the variability within our sample, post hoc comparisons were performed for RBS-R Total severity subgroups: (i) TD with low RBs, (ii) ASD with low RBs (ASDlow) and (iii) ASD with high RBs (ASDhigh). Age and head motion (RMSD) were used as covariates for all subgroup comparisons.
Three one-way ANOVAs (comparing subgroup effects for (i) six circuit indices, (ii) two frontoparietal/limbic circuit ratios and (iii) two motor/limbic circuit ratios) revealed significant group effects for circuit indices [F(8, 60) = 4.00, P = 0.002], frontoparietal/limbic ratios [F(4, 64) = 6.90, P = 0.002], and motor/limbic ratios [F(4, 64) = 7.66, P = .001). Post hoc tests indicated that the group effects were due to significantly weaker corticostriatal connectivity in the ASDhigh relative to TD subgroup for the right frontoparietal and bilateral motor circuit indices, and greater corticostriatal connectivity (ASDhigh > TD) for the right limbic index. The ASDhigh subgroup also showed weaker right frontoparietal/limbic and bilateral motor/limbic ratios compared to the TD group (Figure 2; Supplementary Tables S5 and S6), reflecting weaker motor and frontoparietal relative to limbic corticostriatal iFC. Differences between the two ASD subgroups also emerged for the right frontoparietal and right motor indices, and right frontoparietal/limbic and right motor/limbic ratios, with lower frontoparietal and motor iFC, relative to limbic iFC, in ASDhigh as compared to ASDlow. Whole brain iFC findings for ASD subgroups showed overconnectivity relative to TD participants for all three seeds in the ASDlow subgroup, but underconnectivity for the motor seed in the ASDhigh subgroup (see Supplementary Figure S2).
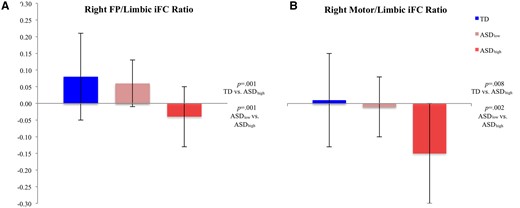
RB subgroup means for (A) right frontoparietal/limbic ratio and (B) right motor/limbic ratio.
Correlations with RBs
We further examined relationships between RBs and connectivity (z′). Age was negatively associated with the left limbic circuit index in the total sample (N = 102), and with both right and left limbic circuits in the ASD group (n = 50; see Table 2 and Figure 3). Although age was not correlated with corticostriatal circuit ratios (Table 3), both age and head motion (RMSD) were used as covariates in all correlational analyses.
Correlations between corticostriatal circuit connectivity indices (z′) and age for the whole sample and for TD and ASD groups separately
| Limbic | Frontoparietal | Motor | |||||||||||
|---|---|---|---|---|---|---|---|---|---|---|---|---|---|
| L | R | L | R | L | R | ||||||||
| df | r | p | r | p | r | p | r | p | r | p | r | p | |
| Both groupsa | 100 | −0.25 | 0.012 | −0.16 | 0.10 | −0.06 | 0.55 | 0.03 | 0.76 | −0.19 | 0.052 | −0.05 | 0.63 |
| TD | 50 | −0.14 | 0.34 | −0.06 | 0.66 | −0.04 | 0.80 | 0.17 | 0.23 | −0.18 | 0.21 | −0.03 | 0.83 |
| ASD | 48 | −0.36 | 0.012 | −0.33 | 0.019 | −0.07 | 0.61 | −0.12 | 0.41 | −0.17 | 0.24 | −0.04 | 0.77 |
Correlations are based on Pearson’s r and controlled for root mean square displacement. Bold values represent significance (P < 0.05, uncorrected).
Correlations between corticostriatal circuit ratios (z′) and age, RBS-R total scores and post hoc RBS-R subscores for right hemisphere ratios, which were significantly associated with RBS-R total scores
| Frontoparietal/limbic | Motor/limbic | ||||||||
|---|---|---|---|---|---|---|---|---|---|
| L | R | L | R | ||||||
| df | r | p | r | p | r | p | r | p | |
| Age totala | 100 | 0.17 | 0.09 | 0.05 | 0.63 | 0.05 | 0.64 | 0.02 | 0.86 |
| Age TD | 50 | 0.11 | 0.46 | 0.03 | 0.83 | −0.05 | 0.72 | −0.01 | 0.98 |
| Age ASD | 48 | 0.23 | 0.11 | 0.21 | 0.15 | 0.19 | 0.18 | 0.15 | 0.31 |
| RBS-R total | 33 | −0.09 | 0.62 | −0.42 | 0.012 | −0.04 | 0.83 | −0.40 | 0.02 |
| RB motor subtotal | 33 | −0.39 | 0.021 | −0.49 | 0.003 | ||||
| Self-injurious RB | 33 | −0.19 | 0.29 | −0.44 | 0.009 | ||||
| Stereotypic RB | 33 | −0.47 | 0.005 | −0.42 | 0.014 | ||||
| RB cognitive subtotal | 33 | −0.43 | 0.012 | −0.31 | 0.07 | ||||
| Ritualistic/sameness RB | 33 | −0.30 | 0.08 | −0.37 | 0.034 | ||||
| Compulsive RB | 33 | −0.46 | 0.006 | −0.09 | 0.62 | ||||
| Restricted RB | 33 | −0.35 | 0.044 | −0.23 | 0.20 | ||||
Correlations are based on Pearson’s r and controlled for root mean square displacement. Bold values represent significance (P<0.05, uncorrected).
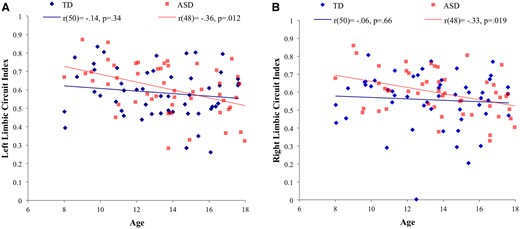
Partial correlations of age with (A) left limbic circuit index and (B) right limbic circuit index for ASD and TD groups controlling for head motion (RMSD).
Testing clusters of iFC differences from whole-brain analyses, RBs were associated with two clusters in the primary motor cortex showing reduced iFC with the right striatal motor seed in the ASD group (see Supplementary Table S4). Reduced connectivity with bilateral clusters in ventral pre- and post-central gyri was associated with greater RBS-R Total score, Motor and Cognitive subtotals, and Stereotypic, Ritualistic/Sameness (left hemisphere only), Compulsive, and Restricted RB subscales (see Supplementary Table S7). No effects in overconnectivity clusters for limbic and frontoparietal striatal seeds were detected.
For corticostriatal circuit indices, only marginal negative correlations with RBS-R Total scores emerged for the right frontoparietal and right motor connectivity indices (see Supplementary Table S8). For ratios of corticostriatal connectivity, negative correlations with RBS-R Total scores were found in the right hemisphere for frontoparietal/limbic and motor/limbic ratios (Table 3). Specifically, lower connectivity of frontoparietal and motor relative to limbic circuits was associated with greater RB severity. Follow-up analyses showed negative correlations for the right frontoparietal/limbic iFC ratio with Motor and Cognitive subtotals (Figure 4A) and Stereotypic, Compulsive, and Restricted RB subscales (Table 3). The right motor/limbic iFC ratio was negatively correlated with the Motor subtotal (Figure 4B) and Self-Injurious, Stereotypic, and Ritualistic/Sameness subscales. Although low numbers of female participants precluded statistical tests of sex differences in RBs, data points in Figure 4 corresponding to female participants are indicated for qualitative representation.
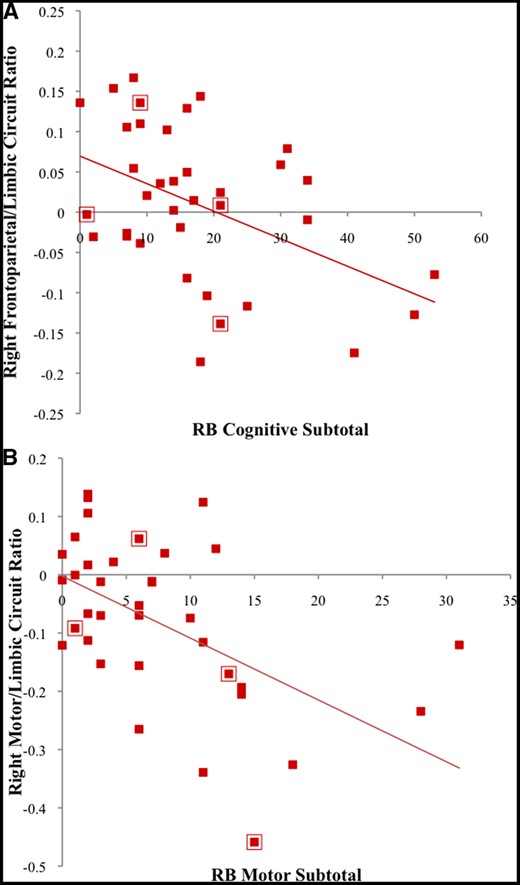
Partial correlations in the ASD group for (A) right frontoparietal/limbic circuit ratio with RB Cognitive Subtotal and for (B) right motor/limbic circuit ratio with RB Motor Subtotal, controlling for age and RMSD. Data points surrounded by a red box indicate female participants.
Discussion
We investigated iFC for three corticostriatal circuits (limbic, frontoparietal and motor) and tested for correlations with RB symptoms in children with ASDs. TD and ASD groups were compared in whole-brain analyses, and by calculating corticostriatal indices per circuit and ratios of corticostriatal indices.
Whole-brain connectivity patterns of striatal seeds in both groups were overall consistent with previous findings of corticostriatal connections being broadly organized along ventral-dorsal and rostral-caudal gradients (Postuma and Dagher, 2006; Di Martino et al., 2008; Choi et al., 2012; Greene et al., 2014). In direct group comparisons, findings were mixed, with regional overconnectivity for limbic and frontostriatal seeds in the ASD group, but underconnectivity for motor seeds. Several specific findings were broadly consistent with previous reports, including ventral striatal overconnectivity with occipito-parietal regions (Turner et al., 2006; Padmanabhan et al., 2013), which may be linked to enhanced recruitment of visuospatial processing areas and relative visuospatial strengths in ASDs (Sahyoun et al., 2010; Keehn et al., 2013). Other previous findings, such as striatal overconnectivity with supramarginal and fusiform gyri (Di Martino et al., 2011), prefrontal underconnectivity with putamen (Padmanabhan et al., 2013), and prefrontal overconnectivity with caudate and ventral striatum (Delmonte et al., 2013) were not replicated. Aside from smaller sample sizes in these earlier studies and differences in age group (mostly young adult participants in Delmonte et al., 2013), this may be attributed to differences in striatal seeds (Di Martino et al., 2011; Padmanabhan et al., 2013).
More broadly, however, our findings provide additional evidence for predominant striatal overconnectivity in ASDs (Di Martino et al., 2011; Delmonte et al., 2013). They are also consistent with findings of atypical connectivity profiles (under- vs overconnectivity) in ASDs being network-specific (Doyle-Thomas et al., 2015; Abbott et al., 2016). Examination of known circuits (rather than single ROIs) can tease out network differences and their association with ASD symptomatology. Some of our findings also appeared to support previous evidence of reduced network differentiation (Shih et al., 2011; Rudie et al., 2012; Fishman et al., 2015) and atypical cross-talk between networks (Fishman et al., 2014). For example, while iFC within the right frontoparietal circuit was reduced in the ASDhigh subgroup (with relatively severe RBs), whole brain analyses showed overconnectivity in ASD for the corresponding striatal seed outside the frontoparietal circuit (Figure 1B). Interestingly, overconnectivity was significant only in the ASDlow subgroup (see Supplementary Figure S2), suggesting that the two complementary effects (underconnectivity within and overconnectivity outside the frontoparietal network) may be linked to RB symptom severity.
Links between connectivity and RBs
Correlations with RBs were modest for corticostriatal circuit indices, with marginal negative correlations for right frontoparietal and motor circuits. More robust correlations were seen for corticostriatal ratios, which captured differential connectivity for frontoparietal and motor circuits vs limbic circuits. As hypothesized, this suggests that RBs may be more strongly associated with imbalance between corticostriatal circuits, as opposed to connectivity within individual circuits.
Adaptive learned behavior requires co-ordination of distinct, yet overlapping functions of corticostriatal circuits. Among these, the limbic corticostriatal circuit may be foundational in shaping development across all functional parcels of the striatum (Haber et al., 2000), and in driving decision-making through reward-related reinforcement (Schultz et al., 1997; Gläscher et al., 2009). Links between RBs and affective responses have been reported in ASDs, e.g. in regard to emotion words (Moseley et al., 2015) and objects of restricted interest (Cascio et al., 2014). RBs have also been associated with abnormal task-related limbic activation (Thakkar et al., 2008; Cascio et al., 2014), with underconnectivity between limbic and paralimbic regions (Zhou et al., 2016), and with a binding deficit of the D1-dopamine receptor in ventral striatum (Rothwell et al., 2014). Abnormalities in ventral striatum may degrade bottom-up modulation of cognitive and motor circuits. In a recent study, cognitive set-shifting was associated with reduced activation of both limbic and cognitive corticostriatal circuits in adolescents and adults with ASDs, suggesting impaired processing of reinforcement cues and cognitive flexibility, respectively (D'Cruz et al., 2016). Striatal circuits have also been implicated in RBs associated with reduced cognitive flexibility in a reversal learning task (D'Cruz et al., 2013). Atypical limbic and cognitive corticostriatal activity may result in preference for routines by lowering demands on a limited repertoire of learned behavioral responses.
Reduced corticostriatal iFC within the motor circuit in ASD is consistent with reported underconnectivity within motor execution networks during finger tapping (Mostofsky et al., 2009). A contrasting overconnectivity finding for large seeds including entire precentral gyri in a study by Carper et al. (2015) may relate to reduced somatotopic differentiation in primary motor cortex (Nebel et al., 2014). Underconnectivity of the striatal motor ROI with precentral gyrus in our whole-brain analysis suggests anomalous sensorimotor processing in ASDs. Reduced striatal inhibition, mediated predominantly by gamma-aminobutyric acid (GABA), may lead to excessive stimulation, and RBs have been proposed as an alleviating or compensatory response to overwhelming sensory stimulation (Hussman, 2001). Reduced GABA has been observed in various cortical regions in ASDs (Rojas et al., 2014) including primary motor areas (Gaetz et al., 2014). Possibly related, a measure of sensorimotor gating, which assesses whether a pre-stimulus cue diminishes a startle effect, was reduced in adults with ASDs and associated with RBs (Perry et al., 2007). Reduced inhibition may affect the development of integrative circuits, result in ‘noisy’ information processing, and adversely impact learning and network formation (Rubenstein and Merzenich, 2003; Nelson and Valakh, 2015). This is supported by a recent report of reduced differentiation in ASDs between anterior putamen, typically involved in social and language functions, and posterior putamen, which is connected with motor regions (Balsters et al., 2017).
When the ASD group was divided into subgroups with high vs low RB scores, connectivity differences for several circuit indices and ratios emerged. ASD participants with more severe RBs had lower frontoparietal/limbic and motor/limbic ratios in the right hemisphere, reflecting atypically increased limbic, but reduced frontoparietal and motor circuit indices. Remarkably, concordant differences were seen for ASD participants with high RB when directly compared to those with low RB, suggesting that neural correlates of RBs in ASDs may be partially independent of sociocommunicative core symptomatology, consistent with earlier proposals (Happé et al., 2006).
Cognitive and motor RB measures correlated with both motor/limbic and frontoparietal/limbic ratios. For motor RBs, effects were most robust for the motor/limbic ratio. However, contrary to expectations, the frontoparietal/limbic ratio was associated with both motor RB and cognitive RB. This indicates overlap of brain-behavior relations with some degree of specificity for different features of RBs and regionally selective corticostriatal circuits.
Circuit-specific corticostriatal connectivity imbalance in ASDs
The most robust findings for children with more severe RBs (ASDhigh subgroup) and in correlation analyses with RBS scores were found for circuit ratios, rather than iFC within individual circuits. This likely relates to differential functions of motor and fronto-parietal vs limbic corticostriatal circuits, and the roles these differential functions may play in the emergence of RBs in ASDs. Although fcMRI cannot easily resolve differential function of direct and indirect basal ganglia pathways (Calabresi et al., 2014), reduced iFC within frontoparietal and motor circuits could be interpreted as diminished function of the striatum in action selection (Jin et al., 2014), both at a complex level, including adherence to routines (frontoparietal), and at the motor level. However, effects for frontoparietal and motor circuit iFC per se were modest and became robust only in relation to atypically increased iFC within the limbic circuit. The limbic circuit, with primary striatal representation in core and shell regions of the nucleus accumbens, plays functional roles related to emotion and reward (Tisch et al., 2004; Groenewegen and Trimble, 2007). Our finding of increased limbic circuit iFC combined with reduced frontoparietal and motor circuit iFC may reflect reduced action selection ability of the basal ganglia being linked to atypical, and possibly enhanced reward processing specifically associated with dopaminergic inputs to the nucleus accumbens (Hikida et al., 2016).
Age-related effects
Subcortical connectivity undergoes substantial developmental changes, with greater subcortico-cortical connectivity, but weaker cortico-cortical connectivity in TD children compared to adults (Supekar et al., 2009). Specific subcortico-cortical connections may further mature at different rates. Porter et al. (2015) found that limbic connectivity with ventral striatum decreased with age, while frontoparietal connectivity with dorsal striatum increased. The present study found decreasing iFC in limbic corticostriatal circuits with age in the ASD group (but not the TD group), while no age-related effects were seen in the other circuits. For the limbic corticostriatal circuit, this may indicate delayed, but protracted development (Di Martino et al., 2016), with most pronounced overconnectivity in children under age 12 years, but near-normal iFC in adolescents.
Underconnectivity of frontoparietal and motor circuits in the absence of robust age-related change, on the other hand, may represent immaturity without developmental normalization. Such immaturity may relate to conclusions by Langen et al. (2011a), according to whom RBs may be adaptive in TD children at an early age, whereas their persistence in ASDs (and some other developmental disorders) becomes maladaptive.
Limitations
Functional connectivity MRI requires participants to be almost absolutely still for several minutes at a time. Since data from low-functioning children with ASDs or from those with greatest symptom severity are therefore hard to acquire, RBs were modest in many of our ASD participants and distinct links with imaging measures could be detected only in a subsample with higher RBs. Our findings may thus not fully reflect neurobehavioral links in children with the most severe forms of the behavior of interest.
In addition, while age and in-scanner head motion were controlled for in all analyses, other variables, such as handedness, sex and IQ—although not significantly different between groups—may have affected functional connectivity measures.
Conclusions
RBs that are commonly seen in children with ASDs are related to abnormal connectivity between the striatum and cerebral cortex. Importantly, the links detected in our study were circuit-specific. Overconnectivity in limbic corticostriatal circuits was seen only in younger children, possibly reflecting developmental delay. The corticostriatal connectivity ratio between frontal and motor vs limbic circuits was reduced in children with ASDs who had more severe RBs, suggesting that imbalance between these circuits, rather than their function in isolation, may be crucial substrates of restricted and RBs and interests.
Acknowledgements
This study was supported by the National Institutes of Health R01 MH081023 (RAM), R01 MH101173 (RAM) and K01 MH097972 (IF). Thanks to the children and their parents who participated in this study.
Supplementary data
Supplementary data are available at SCAN online.
Conflict of interest. None declared.
References
