


Abstract
Innate immunity has been linked to initiation of Alzheimer’s disease and multiple sclerosis. Moreover, risk of first-episode psychosis (FEP) and schizophrenia (Sz) is increased after various infections in predisposed individuals. Thus, we hypothesized an analogous role of innate immunity with increased C-reactive protein (CRP) in non-affective psychosis. Differential blood count, CRP, neutrophil and monocyte–macrophage activation markers, cortisol and psychotic symptoms (Positive and Negative Syndrome Scale [PANSS]) were assessed in controls (n = 294) and acutely ill unmedicated FEP (n = 129) and Sz (n = 124) patients at baseline and after 6 weeks treatment. Neutrophils, monocytes, and CRP were increased in patients vs controls at baseline (P < .001), and neutrophil and monocyte counts correlated positively with activation markers. Eosinophils were lower at baseline in FEP (P < .001) and Sz (P = .021) vs controls. Differences in neutrophils (P = .023), eosinophils (P < .001), and CRP (P < .001) were also present when controlling for smoking and cortisol, and partially remitted after antipsychotic treatment. FEP patients with high neutrophils (P = .048) or monocytes (P = .021) had higher PANSS-P scores at baseline but similar disease course. CRP correlated with PANSS-P at baseline (ρ = 0.204, P = .012). Improvement of positive symptoms after treatment correlated with declining neutrophils (ρ = 0.186, P = .015) or CRP (ρ = 0.237, P = .002) and rising eosinophils (ρ = −0.161, P = .036). In FEP, normalization of neutrophils (ρ = −0.231, P = .029) and eosinophils (ρ = 0.209, P = .048) correlated with drug dosage. In conclusion, innate immune system activation correlated with PANSS-P, supporting the immune hypothesis of psychosis. Neutrophil and monocyte counts and CRP levels may be useful markers of disease acuity, severity, and treatment response.
Introduction
The immune hypothesis of schizophrenia (Sz) is receiving growing interest.1 Prenatal exposure to influenza and other viruses have been regarded as environmental neurodevelopmental triggers of Sz and infections during childhood and adolescence may elicit first-episode psychosis (FEP) or a relapse of Sz in genetically predisposed individuals.2,3 A large epidemiologic study showed increased Sz risk following infections that led to hospitalization, and bacterial infections had the highest risk.3 This may be caused by inflammatory responses affecting the brain.1,4 Alternatively, a shared genetic predisposition could contribute to the simultaneous accumulation of infectious diseases and Sz within certain families.
After infections, the innate immune system is activated as the “first line” of defense. Regarding cellular components, most studies in Sz analyzed the mononuclear phagocyte system (MPS). Monocyte and microglia activation have been observed in Sz.5–7 This points to systemic MPS activation because microglia is regarded as the brain-resident MPS.
Less is known about involvement of granulocytes in Sz, which represent the dominant cellular component of the innate immune system. This may be caused by focus of (psycho)immunology researchers on peripheral blood mononuclear cells (PBMCs).8 Granulocytes (neutrophils, basophils, and eosinophils) account for approximately 50%–80% of all leukocytes, but were often discarded after PBMC isolation in previous studies.
A recent cross-sectional study combined magnetic resonance imaging of the brain and differential blood analyses and observed significantly increased neutrophil granulocytes in FEP patients (n = 137) vs controls (n = 81).9 Neutrophil granulocytes were associated with reduced total brain gray matter. Their counts correlated with clinical symptom severity, namely total, positive and general Positive and Negative Syndrome Scale (PANSS) subscores, but not with PANSS negative scores.9 This was interpreted as neutrophil-associated brain tissue loss in initial stages of Sz, leading to potential cognitive and clinical decline. This assumption was based on hypotheses of blood-brain barrier (BBB) dysfunction in Sz, which allows peripheral blood cells, proinflammatory cytokines, or antineuronal autoantibodies to enter the brain and modulate neurotransmission,10,11 and the observation of destructive neutrophil action on brain tissue in neurodegenerative diseases.12
Two recent meta-analyses found evidence for increased circulating neutrophil to lymphocyte ratios (NLRs) in patients with non-affective psychosis.13,14 One of these meta-analyses described higher monocyte to lymphocyte ratios (MLRs) in Sz and FEP vs controls.13 Both measures were considered inexpensive, reproducible clinical markers of systemic inflammation. Previous NLR- and MLR-related studies had cross-sectional designs without longitudinal follow-up and without detailed documentation of medications,13,14 and some analyzed only medicated patients and 1 disease group (ie, FEP or Sz).9,13 In addition, most NLR- and MLR-related studies lacked correlation of blood findings with clinical symptoms.13,14
To address these constraints and increase insights into potential disease course-related dynamics, we included both FEP and relapsed Sz patients with baseline assessment of patients during acute psychosis and follow-up after 6 weeks treatment. To exclude medication effects as potential confounders, we focused on FEP patients who were drug-naïve or Sz patients who were unmedicated for at least 6 weeks prior to baseline assessment. The aims were to determine if (1) previous findings of specifically elevated neutrophils can be confirmed, (2) monocyte counts are altered, (3) cell count-related findings are paralleled by increased CRP levels, (4) differential blood cell counts and CRP are altered after 6 weeks treatment, (5) cell counts correlate with serum markers of neutrophil and monocyte–macrophage activation, and (6) if differential blood cell counts or CRP correlate with PANSS clinical symptom scores, cumulative drug dosage and type of antipsychotic medication. We also calculated NLRs and MLRs to allow cross-comparisons with recent studies that applied these ratios and controlled for tobacco smoking and hypothalamic–pituitary–adrenal (HPA) stress axis activation as potential confounders.
Materials and Methods
Samples
Specimens came from the blood bank at the Department of Psychiatry, University of Magdeburg, Germany,15–17 and were collected from sequentially admitted acutely ill psychotic inpatients (February 2008 to June 2018; n = 253). FEP patients (n = 129) were drug-naïve at baseline (T0) and non-first-episode Sz patients (n = 124) were unmedicated ≥6 weeks. Controls (n = 294; healthy blood donors and hospital staff and their relatives) came from the same collection period (see table 1).
Demographic Data
| Variables | FEP | Sz | C | Test | Test Value | P Value | FEP-Sz | FEP-C | Sz-C |
|---|---|---|---|---|---|---|---|---|---|
| Bonferroni | Bonferroni | Bonferroni | |||||||
| Age (y) | 29.0 (24.5;38.5;129) | 37.0 (28.3;47.8;124) | 33.0 (27.0;45.0;294) | H test | KW = 21.574 | <.001*** | <0.001*** | 0.002** | 0.102 |
| Gender (f/m) | f: 53/m: 76 | f: 44/m: 80 | f: 117/m: 177 | Chi-square | χ2 = 0.954 | .621 | 1.000 | 1.000 | 1.000 |
| Duration of disease (y) | 0.0 (0.0;0.0;123) | 6.0 (1.5;13.5;97) | — | U test | W = 922.500 | <.001*** | — | — | — |
| Tobacco smoking (yes/no) | yes: 75/no: 54 | yes: 78/no: 46 | yes: 63/no: 231 | Chi-square | χ2 = 87.361 | <.001*** | 1.000 | <0.001*** | <0.001*** |
| BMI_T0 (kg/m2) | 22.63 (20.66;26.54;129) | 23.98 (21.80;28.67;124) | 24.38 (21.97;27.52;294) | H test | KW = 11.264 | .004** | 0.036* | 0.003** | 1.000 |
| BMI_T6 (kg/m2) | 23.94 (22.20;27.47;95) | 26.23 (23.04;29.39;79) | 23.88 (21.95;27.31;179) | H test | KW = 9.936 | .007** | 0.023* | 1.000 | 0.009** |
| Test value | W = 507.50 | W = 336.50 | W = 612.50 | ||||||
| P value | <.001*** | <.001*** | .364 | ||||||
| PANSS_total_corrected_T0 (score) | 41.0 (31.0;55.0;129) | 45.0 (33.0;63.0;123) | — | U test | W = 7104.000 | .152 | — | — | — |
| PANSS_total_corrected_T6 (score) | 17.0 (6.3;25.8;96) | 15.0 (6.0;27.0;79) | — | U test | W = 3580.500 | .527 | — | — | — |
| Test value | W = 4537.00 | W = 3055.50 | |||||||
| P value | <.001*** | <.001*** | |||||||
| PANSS-P_corrected_T0 (score) | 13.0 (9.0;17.0;129) | 15.0 (10.0;19.0;123) | — | U test | W = 6909.000 | .076 | — | — | — |
| PANSS-P_corrected_T6 (score) | 3.0 (1.0;5.0;96) | 3.0 (1.0;8.0;79) | - | U test | W = 3530.500 | .430 | — | — | — |
| Test value | W = 3990.50 | W = 2791.00 | |||||||
| P value | <.001*** | <.001*** | |||||||
| PANSS-N_corrected_T0 (score) | 8.0 (4.0;13.5;129) | 9.0 (5.0;16.0;123) | — | U test | W = 7346.500 | .310 | — | — | — |
| PANSS-N_corrected_T6 (score) | 4.0 (0.0;9.0;96) | 4.0 (0.0;10.0;79) | — | U test | W = 3787.000 | .989 | — | — | — |
| Test value | W = 3319.50 | W = 2097.50 | |||||||
| P value | <.001*** | <.001*** | |||||||
| PANSS_G_corrected_T0 (score) | 19.0 (13.0;26.0;129) | 21.0 (13.0;29.0;123) | — | U test | W = 7507.000 | .461 | — | — | — |
| PANSS_G_corrected_T6 (score) | 8.0 (3.3;13.0;96) | 8.0 (4.0;15.0;79) | — | U test | W = 3641.500 | .652 | — | — | — |
| Test value | W = 4483.50 | W = 3047.00 | |||||||
| P value | <.001*** | <.001*** | |||||||
| Neutrophils_T0 (×109/l), reference range: f 1.9–7.3, m 1.8–6.2 | 4.70 (3.64;6.26;128) | 4.74 (3.57;6.75;122) | 3.19 (2.62;3.99;293) | H test | KW = 108.669 | <.001*** | 1.000 | <0.001*** | <0.001*** |
| Neutrophils_T6 (×109/l) | 3.89 (3.18;4.62;95) | 4.46 (3.41;5.65;78) | 3.05 (2.41;3.83;182) | H test | KW = 46.200 | <.001*** | 0.090 | <0.001*** | <0.001*** |
| Test value | W = 3238.00 | W = 1995.00 | W = 7916.50 | ||||||
| P value | <.001*** | .006** | .842 | ||||||
| Eosinophils_T0 (×109/l), reference range: 0.03–0.44 | 0.11 (0.06;0.21;128) | 0.14 (0.07;0.24;122) | 0.17 (0.12;0.25;293) | H test | KW = 27.104 | <.001*** | 0.250 | <0.001*** | 0.021* |
| Eosinophils_T6 (×109/l) | 0.23 (0.12;0.36;95) | 0.20 (0.13;0.30;78) | 0.17 (0.11;0.27;182) | H test | KW = 5.388 | .068 | 1.000 | 0.087 | 0.472 |
| Test value | W = 667.00 | W = 614.00 | W = 7389.00 | ||||||
| P value | <.001*** | <.001*** | .737 | ||||||
| Basophils_T0 (×109/l), reference range: 0.01–0.08 | 0.05 (0.00;0.08;128) | 0.03 (0.00;0.08;122) | 0.05 (0.00;0.06;293) | H test | KW = 1.010 | .603 | 1.000 | 0.845 | 1.000 |
| Basophils_T6 (×109/l) | 0.06 (0.00;0.07;95) | 0.05 (0.00;0.08;78) | 0.05 (0.00;0.06;182) | H test | KW = 3.217 | .200 | 1.000 | 0.208 | 1.000 |
| Test value | W = 1004.00 | W = 498.50 | W = 5072.00 | ||||||
| P value | .164 | .124 | .994 | ||||||
| Lymphocytes_T0 (×109/l), reference range: f 1.2–3.6, m 1.0–3.2 | 2.13 (1.60;2.62;128) | 2.10 (1.64;2.66;122) | 1.98 (1.64;2.35;293) | H test | KW = 3.352 | .187 | 1.000 | 0.476 | 0.375 |
| Lymphocytes_T6 (×109/l) | 2.12 (1.79;2.58;95) | 2.25 (1.71;2.78;78) | 1.95 (1.63;2.50;182) | H test | KW = 7.201 | .027* | 1.000 | 0.137 | 0.067 |
| Test value | W = 2143.00 | W = 1445.50 | W = 8460.00 | ||||||
| P value | .612 | .916 | .751 | ||||||
| Monocytes_T0 (×109/l), reference range: f 0.25–0.85, m 0.26–0.87 | 0.49 (0.34;0.67;126) | 0.52 (0.38;0.64;122) | 0.39 (0.32;0.49;293) | H test | KW = 43.543 | <.001*** | 1.000 | <0.001*** | <0.001*** |
| Monocytes_T6 (×109/l) | 0.45 (0.37;0.57;95) | 0.46 (0.32;0.58;78) | 0.38 (0.31;0.50;182) | H test | KW = 15.185 | <.001*** | 1.000 | 0.001** | 0.022* |
| Test value | W = 2254.50 | W = 1810.00 | W = 7999.00 | ||||||
| P value | .524 | .042* | .835 | ||||||
| Erythrocytes_T0 (×1012/l), reference range: f 3.96–5.16, m 4.54–5.77 | 4.96 (4.54;5.31;129) | 4.87 (4.59;5.14;124) | 4.87 (4.59;5.17;293) | H test | KW = 1.644 | .439 | 0.659 | 0.909 | 1.000 |
| Erythrocytes_T6 (×1012/l) | 4.90 (4.59;5.24;95) | 4.88 (4.55;5.22;78) | 4.88 (4.56;5.15;182) | H test | KW = 0.359 | .835 | 1.000 | 1.000 | 1.000 |
| Test value | W = 1500.00 | W = 1682.50 | W = 8658.00 | ||||||
| P value | .410 | .481 | .385 | ||||||
| Thrombocytes_T0 (×109/l), reference range: f 176–391, m 146–328 | 273 (232;327;129) | 270 (221;321;124) | 271 (237;317;294) | H test | KW = 0.452 | .798 | 1.000 | 1.000 | 1.000 |
| Thrombocytes_T6 (×109/l) | 262 (215;306;96) | 253 (215;311;78) | 276 (242;314;182) | H test | KW = 6.481 | .039* | 1.000 | 0.195 | 0.070 |
| Test value | W = 2455.00 | W = 1956.50 | W = 8712.00 | ||||||
| P value | .517 | .038* | .221 | ||||||
| Neutrophil/Lymphocyte ratio_T0 | 2.18 (1.66;3.09;128) | 2.33 (1.58;3.04;122) | 1.69 (1.32;2.02;293) | H test | KW = 63.988 | <.001*** | 1.000 | <0.001*** | <0.001*** |
| Neutrophil/Lymphocyte ratio_T6 | 1.82 (1.42;2.48;95) | 2.03 (1.46;2.77;78) | 1.64 (1.26;2.05;182) | H test | KW = 17.745 | <.001*** | 0.452 | 0.028* | <0.001*** |
| Test value | W = 3236.00 | W = 1777.00 | W = 7261.00 | ||||||
| P value | <.001*** | .063 | .368 | ||||||
| Monocyte/Lymphocyte ratio_T0 | 0.24 (0.16;0.33;126) | 0.24 (0.18;0.31;122) | 0.19 (0.16;0.25;293) | H test | KW = 26.878 | <.001*** | 1.000 | 0.002** | <0.001*** |
| Monocyte/Lymphocyte ratio_T6 | 0.22 (0.17;0.28;95) | 0.21 (0.17;0.26;78) | 0.19 (0.16;0.25;182) | H test | KW = 5.396 | .067 | 1.000 | 0.069 | 0.726 |
| Test value | W = 2447.00 | W = 1942.00 | W = 7161.50 | ||||||
| P value | .231 | .013* | .243 | ||||||
| CRP_T0 (mg/l), reference range: <5.0 | 2.1 (0.6;4.0;128) | 3.1 (1.0;4.0;121) | 1.0 (0.5;2.1;294) | H test | KW = 50.480 | <.001*** | 0.017* | 0.001** | <0.001*** |
| CRP_T6 (mg/l) | 1.7 (0.7;4.0;95) | 1.9 (0.9;4.0;77) | 1.0 (0.6;2.3;182) | H test | KW = 19.527 | <.001*** | 1.000 | 0.006** | <0.001*** |
| Test value | W = 1501.00 | W = 1189.50 | W = 5041.50 | ||||||
| P value | .410 | .010** | .443 |
Note: Data presented as median (quartile 1; quartile 3; sample size). BMI, body mass index; CRP, C-reactive protein; FEP, first-episode psychosis; PANSS, Positive and Negative Syndrome Scale; Sz, schizophrenia; T0, acutely ill unmedicated; T6, after 6 weeks of treatment.
*P < .05, **P < .01, ***P < .001.
Exclusion criteria were cannabis consumption or other substance abuse, psychosis induced by other medical conditions, a history of immune disease or immunotherapy.16 Controls were screened for personal or family history of neuropsychiatric disorders using the Mini-International Neuropsychiatric Interview.18 Procedures were approved by the local institutional review board and written informed consent was obtained.
Blood analyses and psychopathological assessments (PANSS) were performed at baseline. Follow-up assessments after 6 weeks (T6) were available for 175 patients. The types and cumulative dosages of antipsychotic drugs taken from baseline to follow-up were documented and converted into chlorpromazine (CPZ) equivalents.19–21 A total of 163 subjects were medicated for 6 weeks after baseline assessment (olanzapine: n = 71; quetiapine: n = 17; risperidone: n = 45; aripiprazole: n = 15; typical antipsychotic drugs: n = 9; other drugs/combinations: n = 6). Blood samples were obtained from fasting subjects at 08:00 am and collected into BD Vacutainer tubes (Becton Dickinson). Ethylenediamine tetraacetic acid-blood tubes were used for determining differential blood counts within 1 h. Serum tubes were centrifuged at 1000g for 10 min after 2 h clotting. Supernatants were aliquoted and stored at −80°C.
Blood Analyses
Differential blood counts were determined using an XN-3000 automated counter (Sysmex Corporation). Serum CRP concentrations were measured by a Cobas 8000 c701 modular analyzer (Roche Diagnostics). In a representative subgroup (n = 240; supplementary table S1), multiplex immunoassay serum measurements (HumanMAP platform; Myriad RBM) were available from a previous study.17 These originated from the same aforementioned samples and included cortisol and markers of neutrophil or monocyte–macrophage activation. The following serum markers were used to assess neutrophil activation: granulocyte colony stimulation factor (G-CSF) promotes neutrophil proliferation and maturation whereas myeloperoxidase (MPO) is a lysosomal protein which is stored in azurophilic granules of neutrophils and is released into the extracellular space during degranulation; neutrophil gelatinase associated lipocalin (NGAL) is expressed in neutrophils and involved in innate immunity by sequestrating iron that in turn limits bacterial growth. Monocyte/macrophage activation was assessed by the following serum markers: soluble CD40 antigen (sCD40), a costimulatory protein which is expressed on monocytes/macrophages and is required for their activation. sCD40 inhibits the interaction between CD40L and CD40-bearing cells. Macrophage inflammatory protein-1 alpha (MIP-1α, synonym CCL3) belongs to the family of chemotactic cytokines known as chemokines, is produced by macrophages after they are stimulated with bacterial endotoxin. Intra- and inter-assay coefficients of variation were <5% for all assays.
Statistics
Chi-square tests were performed to calculate group differences regarding gender, smoking and diagnosis-dependent differences regarding subject numbers with blood cell counts within/above reference ranges. Corrected PANSS scores were derived by subtraction of minimum (no symptoms) from raw scores. Most data were not normally distributed as indicated by Shapiro–Wilk tests. Thus, differences between groups were calculated by non-parametric Kruskal–Wallis H tests and Mann–Whitney U tests. Bonferroni-correction was applied to correct for multiple comparisons. Cliff’s delta (δ) was used to assess effect sizes (δ ≥ 0.147 “small,” δ ≥ 0.330 “medium,” δ ≥ 0.474 “large”).22 Correlation of cell counts with demographic, clinical, and blood measures were assessed by Spearman rank tests. Partial correlation coefficients were calculated to evaluate correlations of illness duration with blood cell counts or CRP, controlling for age. Multiple comparisons were accounted for by applying false discovery rate (FDR) corrections. Analysis of covariance using an aligned rank data transformation (ART; http://www.r-project.org) was performed to control diagnostic group effects at baseline for covariates “number of cigarettes” and “cortisol concentration.”
All statistical tests were two-tailed with P < .05 considered significant and P < .10 as trending toward significance.
Results
Baseline/T0
FEP patients were younger, with shorter disease duration and leaner at baseline than Sz patients, but not significantly different regarding gender distribution (table 1). Both patient groups contained more tobacco smokers than controls and showed no significant difference regarding baseline PANSS scores.
Patients showed significantly higher neutrophil counts than controls with large effect sizes (FEP vs controls: ǀδǀ = 0.529, Sz vs controls: ǀδǀ = 0.508) but FEP and Sz patients did not significantly differ regarding neutrophil counts at T0. About 23% of FEP and 30% of Sz patients had neutrophil counts above the reference range, compared to 6% in controls (table 2). NLR was significantly higher in patients than controls with medium effect sizes (FEP vs controls: ǀδǀ = 0.397; Sz vs controls: ǀδǀ = 0.399).
Prevalence of Neutrophil or Monocyte Counts and CRP Measures Above the Reference Range
| Variables | FEP | Sz | C | FEP | Sz | C | FEP | Sz | C |
|---|---|---|---|---|---|---|---|---|---|
| Neutrophils_T0 | Monocytes_T0 | CRP_T0 | |||||||
| Within reference range (n) | 99 | 85 | 276 | 104 | 109 | 259 | 114 | 94 | 267 |
| Above reference range (n) | 29 | 37 | 17 | 22 | 13 | 34 | 14 | 27 | 27 |
| Above reference range (%) | 22.7 | 30.3 | 5.8 | 17.5 | 10.7 | 11.6 | 10.9 | 22.3 | 9.2 |
| P value (chi-square test) | <.001*** | .203 | .002** | ||||||
| Neutrophils_T6 | Monocytes_T6 | CRP_T6 | |||||||
| Within reference range (n) | 85 | 65 | 173 | 87 | 70 | 157 | 85 | 69 | 165 |
| Above reference range (n) | 10 | 13 | 9 | 8 | 8 | 25 | 10 | 8 | 17 |
| Above reference range (%) | 10.5 | 16.7 | 4.9 | 8.4 | 10.3 | 13.7 | 10.5 | 10.4 | 9.3 |
| P value (chi-square test) | .009** | .405 | .917 | ||||||
Note: Abbreviations are explained in the footnote to Table 1.
**P < .01, ***P < .001.
Monocyte counts were also significantly higher in patients compared to controls, with small effect size in FEP (ǀδǀ = 0.262), medium effect size in Sz (ǀδǀ = 0.385), and no significant difference between FEP and Sz at T0. This was not reflected in diagnosis-dependent differences regarding number of subjects with monocyte counts above the reference range (table 2). MLR was higher in patients compared to controls with small effect sizes (FEP vs controls: ǀδǀ = 0.213; Sz vs controls: ǀδǀ = 0.298). Neutrophil and monocyte counts were correlated (ρ = 0.409, P < .001) and both neutrophil (ρ = 0.398, P < .001) and monocyte (ρ = 0.168, P < .001) counts were correlated with CRP levels at T0.
CRP levels were significantly higher in patients compared to controls, with small effect size for FEP (ǀδǀ = 0.214) and medium effect size for Sz (ǀδǀ = 0.436). CRP measures were significantly higher in Sz vs FEP patients (ǀδǀ = 0.202) and approximately 11% of FEP and 22% of Sz patients had CRP levels above the reference range, compared to 9% in controls (table 2).
Eosinophil counts were lower in patients with small effect sizes (FEP: ǀδǀ = 0.312; Sz: ǀδǀ = 0.168). No diagnosis-related differences were observed regarding basophil and lymphocyte levels at T0 and similar proportions of erythrocytes and thrombocytes were observed across all groups, suggesting that increased leukocytes were not caused by reduced fluid intake/dehydration of patients.
Follow-up/T6
FEP and Sz patients showed significantly improved PANSS-total, PANSS-P, PANSS-N, and PANSS-G scores at T6 (table 1). As at baseline, symptom severity did not differ between FEP and Sz patients at T6. Significantly lower neutrophil counts were observed for FEP and Sz patients but did not reach the median level of controls (FEP: ǀδǀ = 0.355; Sz: ǀδǀ = 0.464; table 1). Neutrophil counts remained above the reference range in 11% of FEP and 17% of Sz patients, compared to 5% in controls (table 2). NLRs significantly decreased in FEP and a similar trend was found in Sz patients. No significant changes over time were observed regarding monocyte counts in FEP. Monocyte counts significantly decreased in Sz but did not reach control levels (table 1). Accordingly, MLRs decreased in Sz patients. Diagnosis-dependent differences in subject numbers with monocyte counts above the reference range were not detectable at follow-up (FEP: ~8%, Sz: ~10%, controls: ~14%; table 2).
Similarly, CRP levels decreased significantly in Sz (P = .010), but were still elevated in patients vs controls (FEP: 1.7; Sz: 1.9; controls: 1.0 mg/l; FEP vs control: P < .001, ǀδǀ =0.226; Sz vs controls: P = .006, ǀδǀ = 0.315). Nevertheless, diagnosis-dependent differences in subject numbers with CRP levels above the reference range were not detectable at follow-up (table 2). In contrast, eosinophil counts were significantly increased in both patient groups and did not differ from controls at T6. As at baseline, no significant differences were observed regarding basophils and lymphocytes. The proportion of erythrocytes did not change over time but decreased thrombocyte counts were observed in Sz patients, which may be drug induced.23,24 Controls had stable CRP and differential blood counts which did not change significantly from T0 to T6.
Parallels to Neutrophil and Monocyte Activation Markers at T0
Multiplex analysis of 240 serum samples with FDR correction showed that neutrophil counts correlated significantly with G-CSF (ρ = 0.401, P < .001), MPO (ρ = 0.451, P < .001), NGAL (ρ = 0.506, P < .001), but also with sCD40 (ρ = 0.239, P < .001), and MIP-1α (ρ = 0.218, P < .001) levels. A similar pattern was seen for monocyte counts as these correlated with G-CSF (ρ = 0.285, P < .001), MPO (ρ = 0.182, P = .005), NGAL (ρ = 0.294, P < .001), sCD40 (ρ = 0.315, P < .001), and MIP-1α (ρ = 0.239, P < .001). G-CSF levels were higher in Sz patients vs controls (P = .003) and MPO and NGAL concentrations were higher in FEP and Sz patients compared to controls (MPO: FEP vs controls and Sz vs controls: P < .001; NGAL: FEP vs controls: P = .005, Sz vs controls: P < .001). sCD40 (P < .001) and MIP-1α (P = .016) levels were elevated in Sz but not in FEP patients vs controls.
Association of Cell Counts and CRP With Psychotic Symptoms
Baseline/T0
Neutrophil counts correlated with PANSS-P scores in FEP (ρ = 0.244, P = .036) and Sz (ρ = 0.223, P = .054) patients at baseline (supplementary table S2). Similarly, CRP levels correlated with PANSS-P (ρ = 0.224, P = 053), PANSS-G (ρ = 0.220, P = .054) and PANSS-total (ρ = 0.243, P = .036) in FEP patients but not in Sz patients. No significant correlations were found with PANSS-N scores. Monocyte counts were correlated at trend level (ρ = 0.149, P = .067) with PANSS-P, for FEP and Sz patients combined. FEP patients with significantly increased neutrophil or monocyte counts above the normal reference ranges showed significantly higher PANSS-P scores at baseline (figure 1). Eosinophil counts at baseline correlated inversely with PANSS-G in FEP (ρ = −0.199, P = .073) and Sz (ρ = −0.245, P = .036) patients and at trend level with PANSS-total in FEP (ρ = −0.201, P = .073) but not with Sz patients (supplementary table S2). No correlations of osinophil counts were observed with PANSS-P and -N.
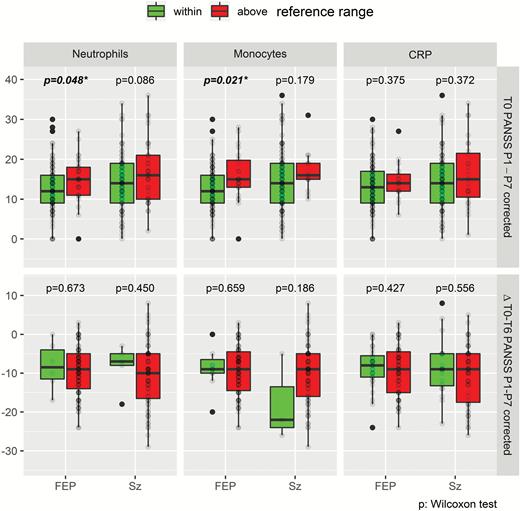
Upper: Comparison of PANSS-P scores in FEP and Sz patients with neutrophil/monocyte counts and CRP values above vs within reference ranges at baseline. Lower: Follow-up comparison of PANSS-P changes after 6 weeks treatment. Significant P values are in bold; *P < .05. CRP, C-reactive protein; FEP, first-episode psychosis; PANSS, Positive and Negative Syndrome Scale; Sz, schizophrenia.
Follow-up/T6
The changes in neutrophil counts correlated with ΔPANSS-total (ρ = 0.176, P = .021) and ΔPANSS-P (ρ = 0.186, P = .015) but not with ΔPANSS-N or -G. Similarly, ΔCRP correlated with ΔPANSS-total (ρ = 0.213, P = .005), ΔPANSS-P (ρ = 0.237, P = .002), and ΔPANSS-G (ρ = 0.188, P = .015) but not with ΔPANSS-N. No correlations were observed for monocytes. Changes in eosinophils correlated negatively with ΔPANSS-total (ρ = −0.165, P = .031), ΔPANSS-P (ρ = −0.161, P = .036) and ΔPANSS-G (ρ = −0.194, P = .011) but not with ΔPANSS-N.
Follow-up comparison of ΔPANSS-P scores in patients who had high vs normal-range CRP values and neutrophil/monocyte counts at baseline showed no significant differences (figure 1) and the applied/required medication dosage (CPZ units) did not differ between groups (data not shown).
Antipsychotic Influence on Cell Counts and CRP
In FEP patients, CPZ equivalents correlated negatively with Δneutrophils (ρ = −0.231, P = .029; figure 2). Separate correlation analyses per medication subgroup suggested that this was mainly driven by olanzapine (ρ = −0.282, P = .058; n = 46). Similarly, normalization of eosinophils correlated with CPZ equivalents in FEP (ρ = 0.209, P = .048) but without indications for medication subgroup-related changes. Changes of CRP or monocytes in FEP and Sz were not significantly correlated with CPZ equivalents.
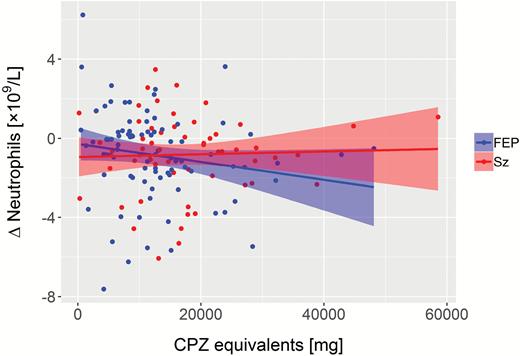
Correlation of reduced neutrophil count from baseline to follow-up with cumulative drug dosage (CPZ) in FEP (ρ = −0.231, P = .029; n = 90). No correlation was observed in Sz (ρ = −0.055, P = .643; n = 73). FEP, first-episode psychosis; Sz, schizophrenia.
Age/Illness Duration Influence on Cell Counts and CRP
We observed no significant correlation of age with neutrophil, eosinophil, and monocyte counts. Also, illness duration in Sz did not correlate with cell counts. Applying FDR correction, CRP levels were correlated significantly with age at T0 (ρ = 0.161, P = .001) and T6 (ρ = 0.158, P = .024). Partial correlation analysis after adjustment for age in Sz patients showed that illness duration correlated with CRP levels at follow-up (ρ = 0.319, P = .008) but not at T0.
Effect of Smoking and HPA Axis Activation on Cell Counts and CRP
Group differences regarding cell counts at baseline were checked by ART with the covariates “number of cigarettes” and “cortisol concentration.” Smoking significantly influenced neutrophil (P < .001) and monocyte (P < .001) but not eosinophil counts (P = .168) or CRP measures (P = .884). Also, cortisol measures were associated with monocyte counts (P = .025) but not with neutrophil (P = .940) or eosinophil (P = .514) counts or CRP measures (P = .284). Considering both covariates, differences across diagnostic groups regarding neutrophils (P = .023), eosinophils (P < .001), and CRP (P < .001) were confirmed. Oppositely, monocyte counts did not show diagnosis-dependent differences when considering both covariates (P = .316).
Separate analysis of nonsmokers confirmed diagnostic group differences regarding neutrophils (P < .001), eosinophils (P < .001), and CRP (P = .011) at baseline.
Discussion
Regarding the role of the innate immune system during acute psychosis, the potential involvement of granulocytes has been less explored than the MPS. We performed the largest systematic analysis of differential blood counts in FEP and Sz to date. We found significantly increased neutrophil counts during acute psychosis with large effect sizes in both drug-naive FEP and unmedicated Sz patients, which confirms previous studies on elevated neutrophil counts in patients with non-affective psychosis.9,25 Furthermore, the percentage of subjects with neutrophil counts above the reference range was significantly higher in FEP and Sz compared to controls. Consistent with recent meta-analyses,13,14 we observed increased NLRs in both patients groups, albeit with medium effect sizes.
Unlike Núñez and colleagues9 who only found alterations in neutrophil counts, we observed additional diagnosis-dependent aberrations of other leukocyte populations. Monocyte counts were elevated in FEP and Sz patients at baseline, as described previously,6,26 but this was not reflected by diagnosis-dependent differences regarding the percentage of subjects with counts above the reference range. However, MLRs were increased in FEP and Sz, consistent with a recent meta-analysis.13 Also, eosinophil counts were reduced in both patient groups and increased significantly at follow-up. Transient decreases of eosinophils may occur during the acute phase of infections, whereas numbers may rise later during infection remission. Differences across diagnostic groups regarding neutrophils, eosinophils, and CRP were confirmed by considering smoking and cortisol levels as covariates.
As neutrophil and monocyte counts only partly normalized during treatment and considering the lacking difference of these cell counts between FEP and Sz at baseline and follow-up, increased numbers of innate immune cells may be trait markers of psychosis. Nevertheless, further upregulation occurs in a state-dependent manner, as shown by acutely even higher respective cell counts and serum activation markers of these cell types.
Consistent with Núñez and colleagues,9 we found that positive symptoms correlated with neutrophil counts, which suggests that these cells may act as a modulator of acute disease severity. The reduction in neutrophil counts at follow-up correlated with improved positive symptoms. However, monocyte counts correlated with PANSS-P at baseline only at trend level. Furthermore, CRP levels correlated with PANSS-P consistent with a recent meta-analysis.27
Our findings are consistent with those of large meta-analyses showing increased levels of CRP in FEP and Sz, regardless of antipsychotic use.27 Age-adjusted correlation analysis of Sz patients showed that illness duration correlated with CRP levels at follow-up, suggesting that CRP is a marker of disease progression in psychosis. CRP has been considered to interface between innate immunity and inflammation and between the innate and adaptive immune systems.28
The increased neutrophils and monocytes and reduced eosinophils resembles distribution patterns of leukocytes which may be caused by “formes frustes” of infection. The partial normalization at follow-up may indicate a transient inflammatory response during onset of acute psychosis that wanes afterwards and persists in an attenuated form. Our finding of upregulated NGAL and MIP-1α may support a role of bacterial infections as a triggering factor of psychosis, as suspected from epidemiologic research.3 In addition to infections, other environmental factors might be responsible for immune activation in FEP and Sz. It has been proposed that inflammation-mediated pathways may serve as a final common pathway for environmental risk factors of early-childhood adversity, adolescent cannabis use, social exclusion, which could mediate the pathophysiology of psychosis spectrum disorders.29 These risk factors are relevant at different neurodevelopmental stages (early childhood, adolescence, early adulthood) and have been associated with increased proinflammatory cytokine and CRP production or microglial activation.29 Such immunological effects can modulate brain development and function via synaptic pruning, microglial priming (ie, exaggerated or heightened microglial response), and modulation of the HPA stress axis.29
Antipsychotics may have anti-inflammatory effects as suggested by our observed correlation of CPZ equivalents with a reduction of neutrophil counts in FEP from T0 to T6. For olanzapine, this is not surprising because of its structural similarity to clozapine, which has been associated with neutropenia and agranulocytosis.30–32 The high-ranking efficacy of clozapine and olanzapine in Sz may be partly driven by anti-inflammatory properties.33 Because of the smaller subgroups of patients receiving other medications, we cannot determine whether this effect occurs for these.
Remarkably, we found that CRP levels decreased at follow-up. Accordingly, a recent meta-analysis found no increases in CRP levels after initiation of antipsychotic treatment.27 Furthermore, this is consistent with a longitudinal study of Sz that found antipsychotic-increased CRP levels only in subjects with normal baseline CRP levels.34
This study benefitted from comparably large sample sizes and clinically well-characterized patients. We also tested a simple, universal set of markers using routine laboratory analyses. Two psychotic disease groups with different disease duration, and a longitudinal design with follow-up after 6 weeks were chosen to increase information on disease course-related dynamics. Moreover, we confirmed our differential blood count data using serum markers of neutrophil and monocyte activation in a representative subcohort, allowing assessment of potential immune-modulating drug effects. As delay in spontaneous neutrophil death has been observed as a consequence of tobacco smoke and nicotine,35 we specifically assessed the impact of cigarette smoking. Other substance abuse disorders were an exclusion criterion. Finally, stress during acute psychosis was considered by including cortisol as covariate. Some limitations should also be noted. First, the chosen serum markers of neutrophil and monocyte–macrophage activation are not cell-type specific. Second, we could not uncover the background of neutrophil and monocyte activation in FEP and Sz due to lack of comprehensive microbiological-virological data or comprehensive information about early-childhood adversity/social exclusion. Finally, no brain imaging data were available to link with brain pathology. Generally, blood parameters are relatively insensitive for detection of neuroinflammation, but supporting evidence for a role of neuroinflammation and infections in FEP and Sz is available from previous CSF studies.36,37
In conclusion, our analysis of routine laboratory parameters such as neutrophil count and CRP levels identified a subgroup of acutely psychotic FEP and Sz patients with signs of innate immune system activation. Higher neutrophil counts and CRP levels in patients may be associated with greater severity of psychosis (higher PANSS-P scores). The decline of neutrophils or CRP and rising eosinophils from baseline to follow-up may be considered as markers of treatment response as these changes correlated with improvement of PANSS-P. Recent reports implicated the innate immune system in initiation of inflammation and as executers of tissue damage in neurodegenerative and neuroinflammatory disorders.38,39 The correlation of neutrophil and monocyte counts with positive symptoms in FEP suggests a similar role of the innate immune system in triggering psychosis. This idea is supported by the observation that anti-inflammatory drugs like celecoxib (a COX2 inhibitor) seem to work in acutely ill patients during the first years of Sz development.40 Notably, human and animal data suggested that blockade of prostaglandin E2 synthesis by COX2 inhibitors boosts innate immunity and bacterial killing.41,42
BBB disruption, which has been implicated in the pathophysiology of Sz, could be triggered by neutrophils, monocytes, and CRP.10,43,44 Although peripheral CRP does not actually cross the BBB, higher CRP levels can increase permeability, affecting tight junctions,44 facilitating CRP and proinflammatory cytokines, antineuronal autoantibodies, or peripheral blood cells to cross the BBB. High peripheral CRP levels during acute episodes could facilitate entrance of other blood cells into the brain and promote disease progression. Moreover, proinflammatory cytokines induce disturbances in dopaminergic, glutamatergic, noradrenergic, or serotonergic neurotransmission, either directly or by modulation of the kynurenine pathway of tryptophan metabolism.1 For instance, an increased concentration of the endogenous NMDA glutamate receptor antagonist kynurenic acid has been observed in the prefrontal cortex of individuals with Sz.45 Antineuronal antibodies against neurotransmitters and other synaptic proteins may act as additional disease modifiers.4 These are, however, linked to a dysfunction of the adaptive immune system (which is activated later / “second line” in the context of inflammatory responses and involves lymphocytes).
Our study suggests that antipsychotic medications, particularly olanzapine, may downregulate neutrophils in acutely ill psychotic patients. Future drug development may focus on novel compounds to modify innate immunity in non-affective psychosis.
Funding
This study required no extra funding.
Conflicts of Interest
S.B. is a director of Psynova Neurotech Ltd and Psyomics Ltd. All other authors have no conflicts of interest.
